Market Report – Aug23
Summary
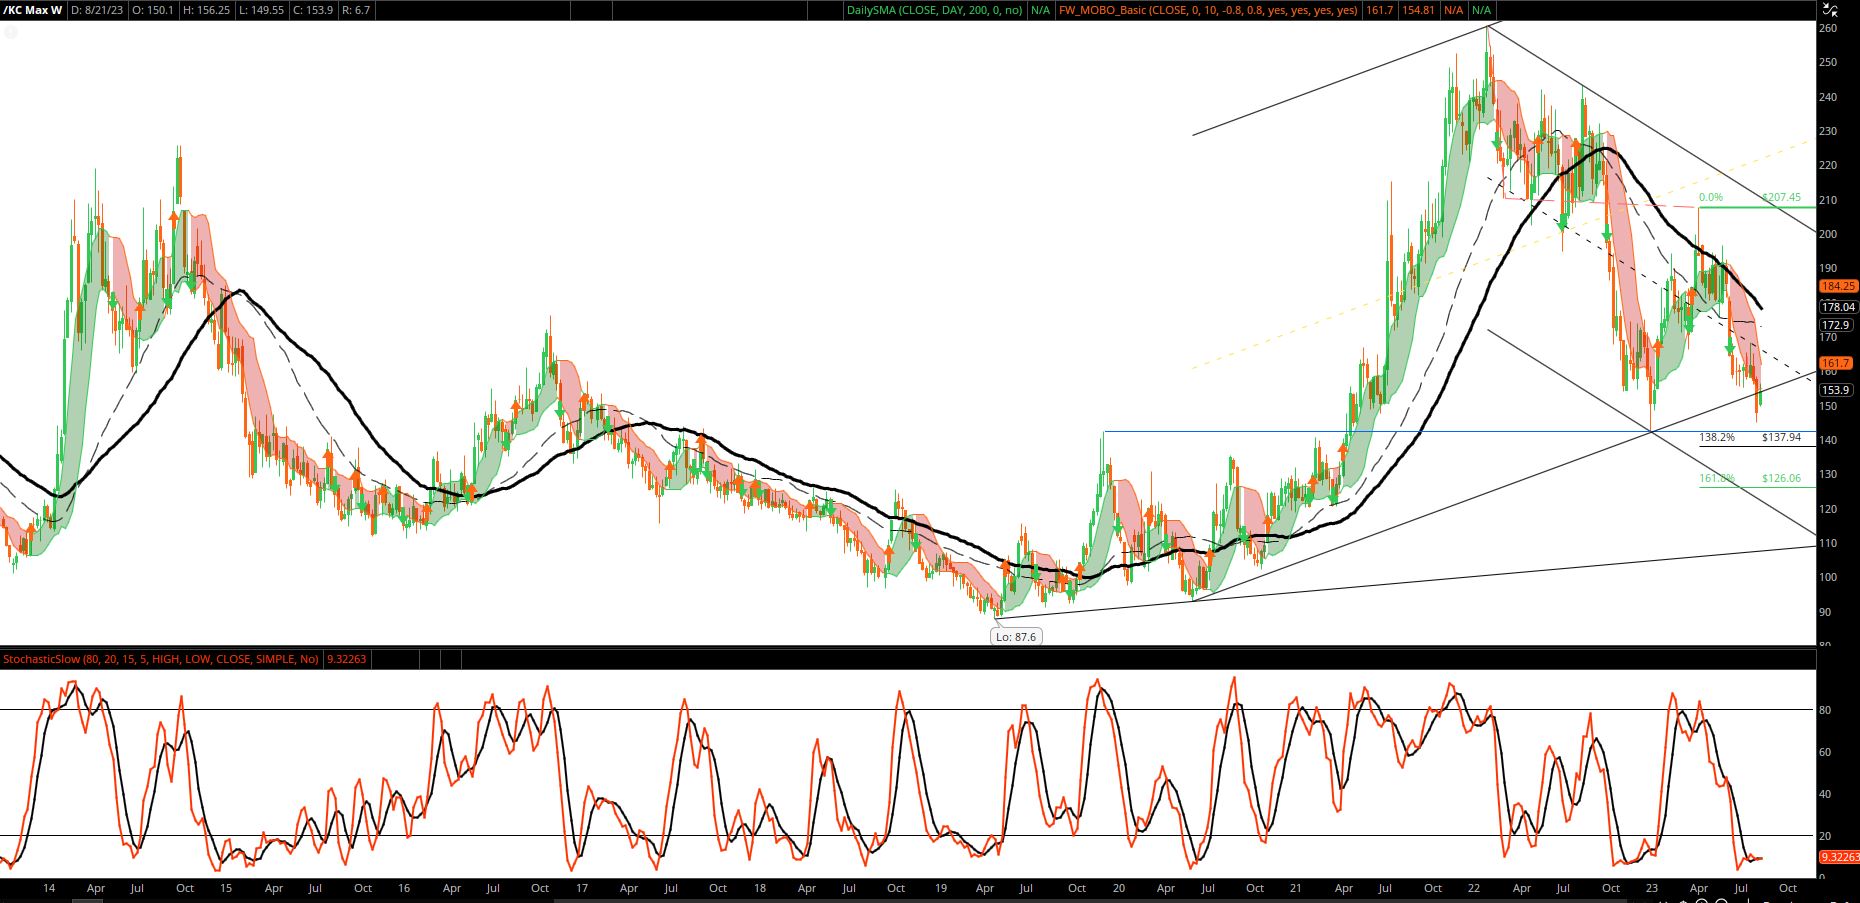
The basis of my views over the last year has been that the market peaked in Feb of 2022 (260.45) and has since checked off all the requisite bear boxes:
- Bearish Candles on all time frames.
- Traded below major moving averages and, more importantly, found resistance several times over the last few months at those moving averages.
- Technical projections continue to play out (current projection is 138). That is also the target for the Jul23-Dec23 poll (details below).
- Funds have shifted their positioning to net short.
- Brazil crop for 23/24 will be the highest “off year” crop and will likely lead to another decent crop for 24/25 should weather cooperate.
- All of this pointed to new lows and we did achieve that.
And while I still think we ought to see another new low (below 142), it’s not clear how much lower the market ought to go. The cure for low prices is always low prices and vice versa for high prices. At some point roasters, who are behind in their future buying as per COT report, will see value. Producers are not happy with current prices and will not likely chase it down too aggressively, unless funds can keep it down and force producers to trade positions with them. Plus in an El Niño year there is potential for meaningful weather impact.
If the bottom is near then we ought to trade in a range bound pattern from that new low. As I favor 138 as the target, a 130/140 to 170/180 range over the medium term seems reasonable.
Recommendations
Given above, my recommendations for clients that have already fixed forward at the recent lows would be to do more of the same. If market drops further, then adding to the position either aggressively with futures or, if uncertain, sell puts to finance near call spreads. (130 put vs ??? Call Spread…to be determined)
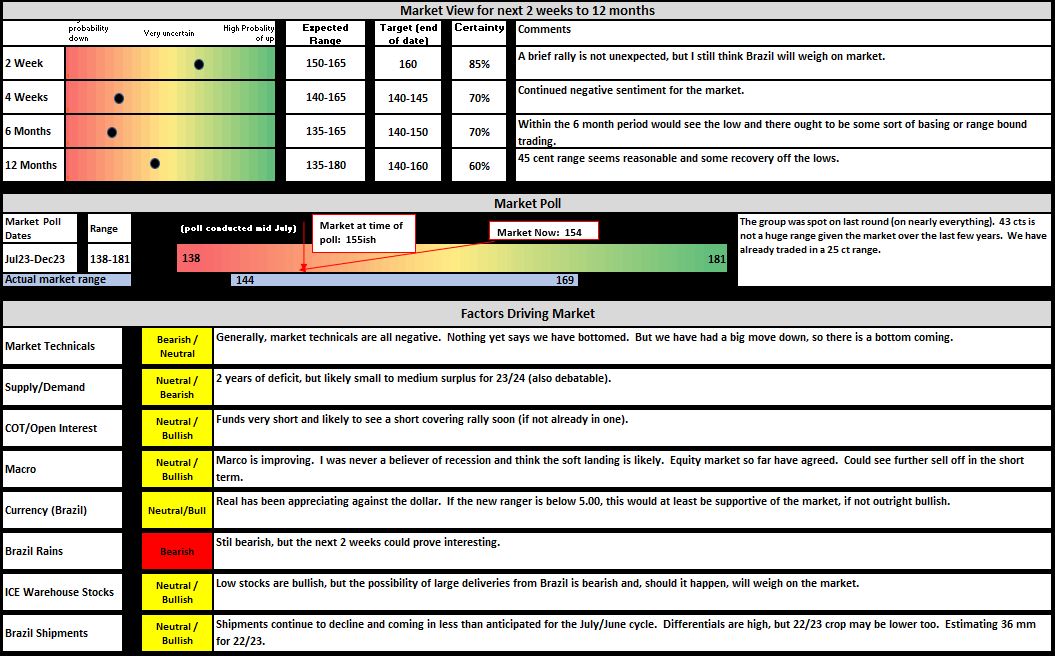
Summary Graphic
- A quick summary of points guiding recommendations.
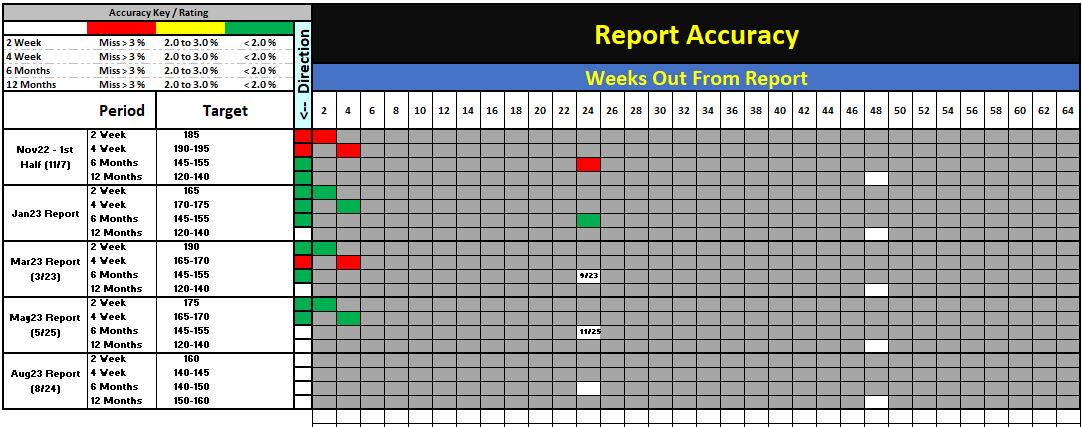
Market Prediction Accuracy
- I am keeping a scorecard for the predictions I make. Decide what size helping of salt one ought to take.
Supporting Graphs
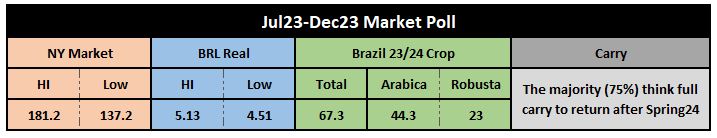
Market Poll – Jul23-Dec23
- In mid July I conducted my bi-annual poll and below table summarizes results. At the time the market was around 160 and had not rallied to 169 yet.
- I think the results are consistent with known fundamentals and technicals. Generally a bearish tone.
- These results also allign(ed) with my view at the time that we might see 175, but eventually trade down to 138, putting in a new low. I generally still think we need to put in more move down below the 142 low of earlier this year. Coffee may surprise and exact the maximum amount of pain; that might be a push into the 120/130 range. But I don’t think so.
- I was a bit surprised with the results on the market not returning to full carry until after Spring24. But given where interest rates are and where they may still go, that is understandable. Plus ICE warehouse stocks continue to drop. More on that below.
- Let’s see if we can nail it like last poll.
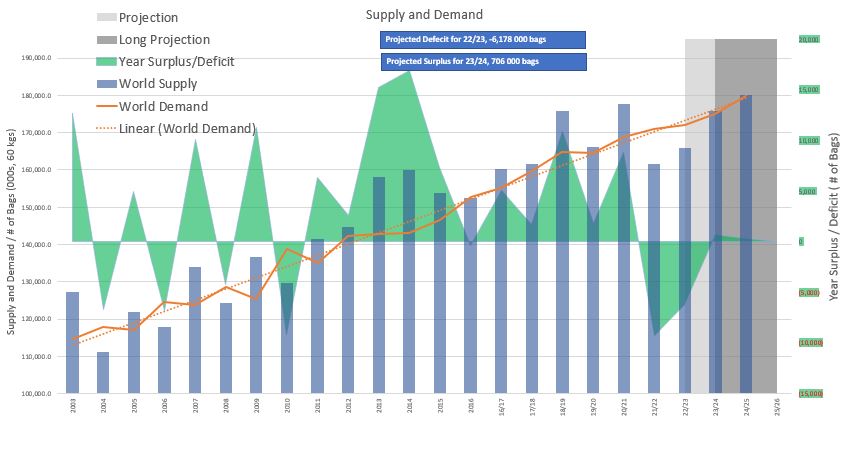
Supply and Demand
- Not a ton of change, still sticking with 67/68 mm for Brazil 23/24 crop and likely much larger 24/25 crop (still a lot to happen before then).
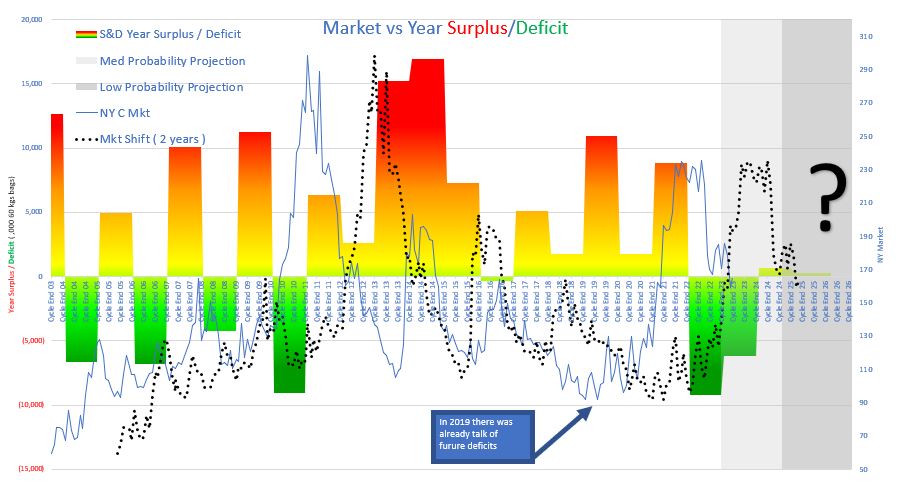
- There are some predicting a 3rd year of deficit (production vs consumption) and others surplus. I am on the slight surplus side still.
- I don’t think current fundamentals merit a huge drop from here, nor a huge spike (bar any weather phenomenon). Early rains in Brazil bears watching (ironic use of the word) with the potential for early flowering within a traditionally dry period: ie, flowers may not fix.
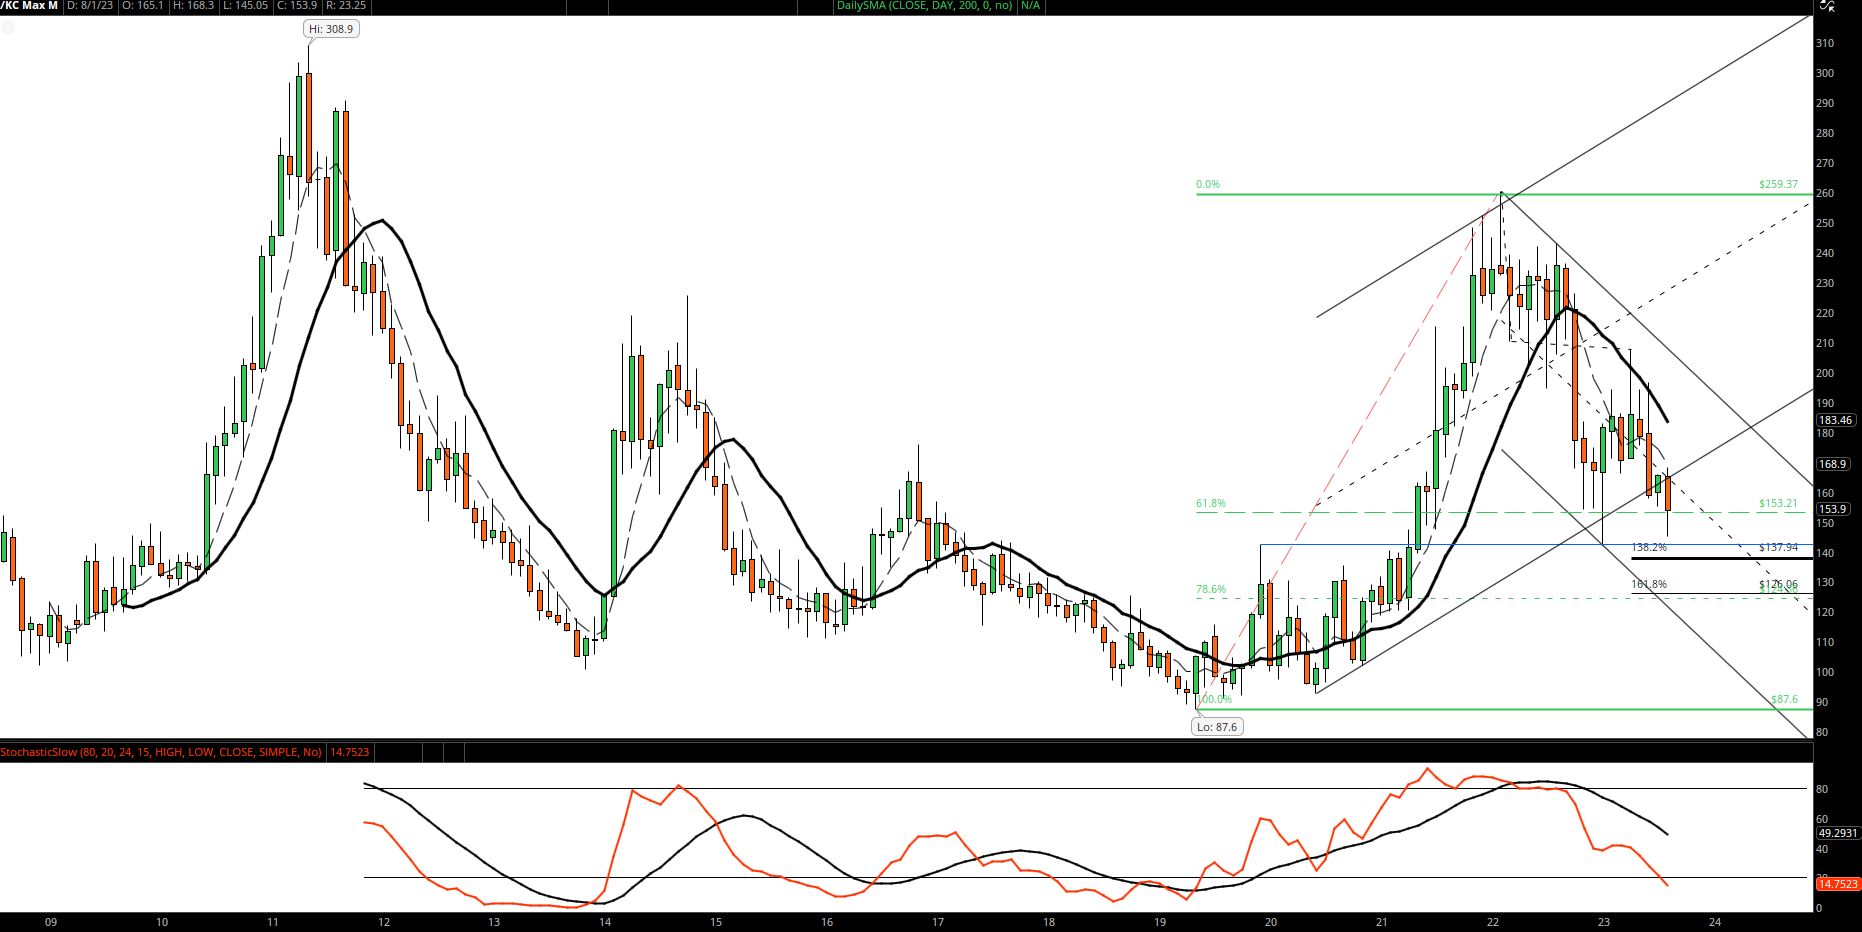
Market Graphs
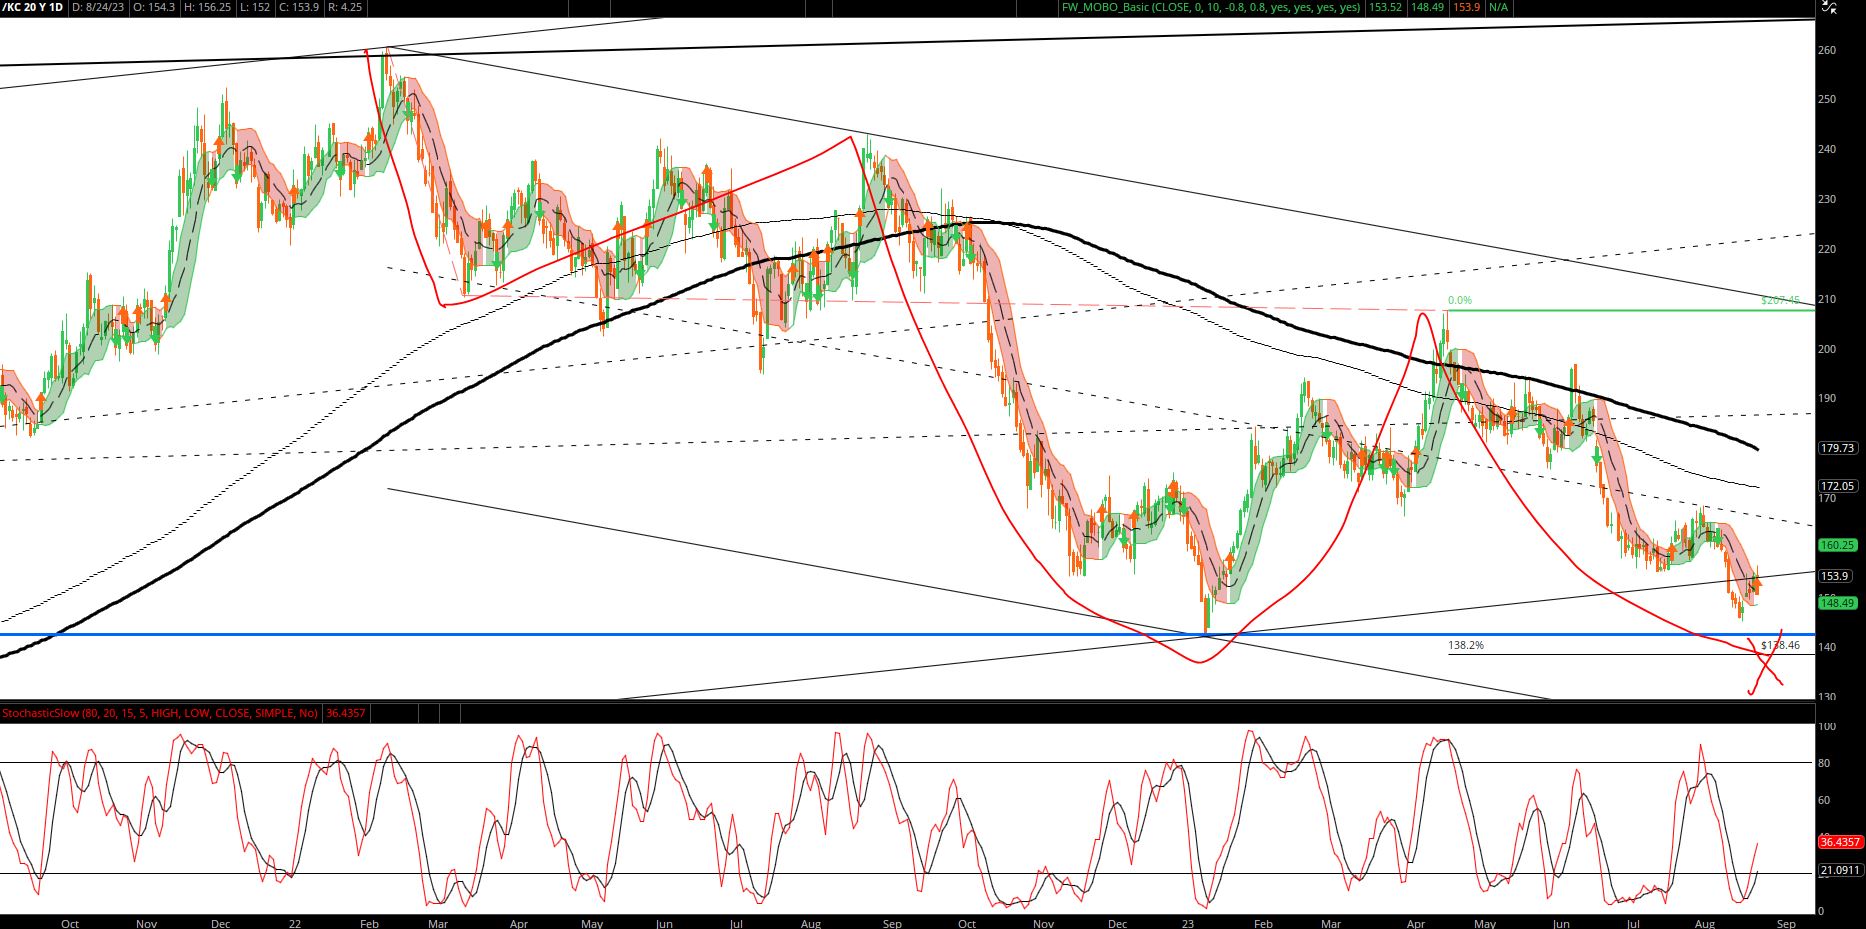
- I am still of the belief that this last move down is the last before we either start trading in a range (base pattern) or if the fundamentals merit, bounce from there. Since most markets trade in a range (70 % by some estimates), the easy bet is a range bound market. I think the fundamentals support that too. The kicker is, what is the low of the base.
- One could make the argument that the most recent low of 145ish was it. I still think the market is targeting a minimum of roughly 138 before years end. That also aligns with the poll numbers and is also a perfect Fibonacci measurement off the original move down that begin in January of 2022.
- We are treading well below key moving averages and other technical points that will be tough to push through should the market rally more.
- Short term resistance is in the 163/169 area. Longer term a close above 175/180 area might negate any more down side.
- For those that are uber bearish, a target of 125 is not out of the question.
COT Open Interest
Weekly Summary
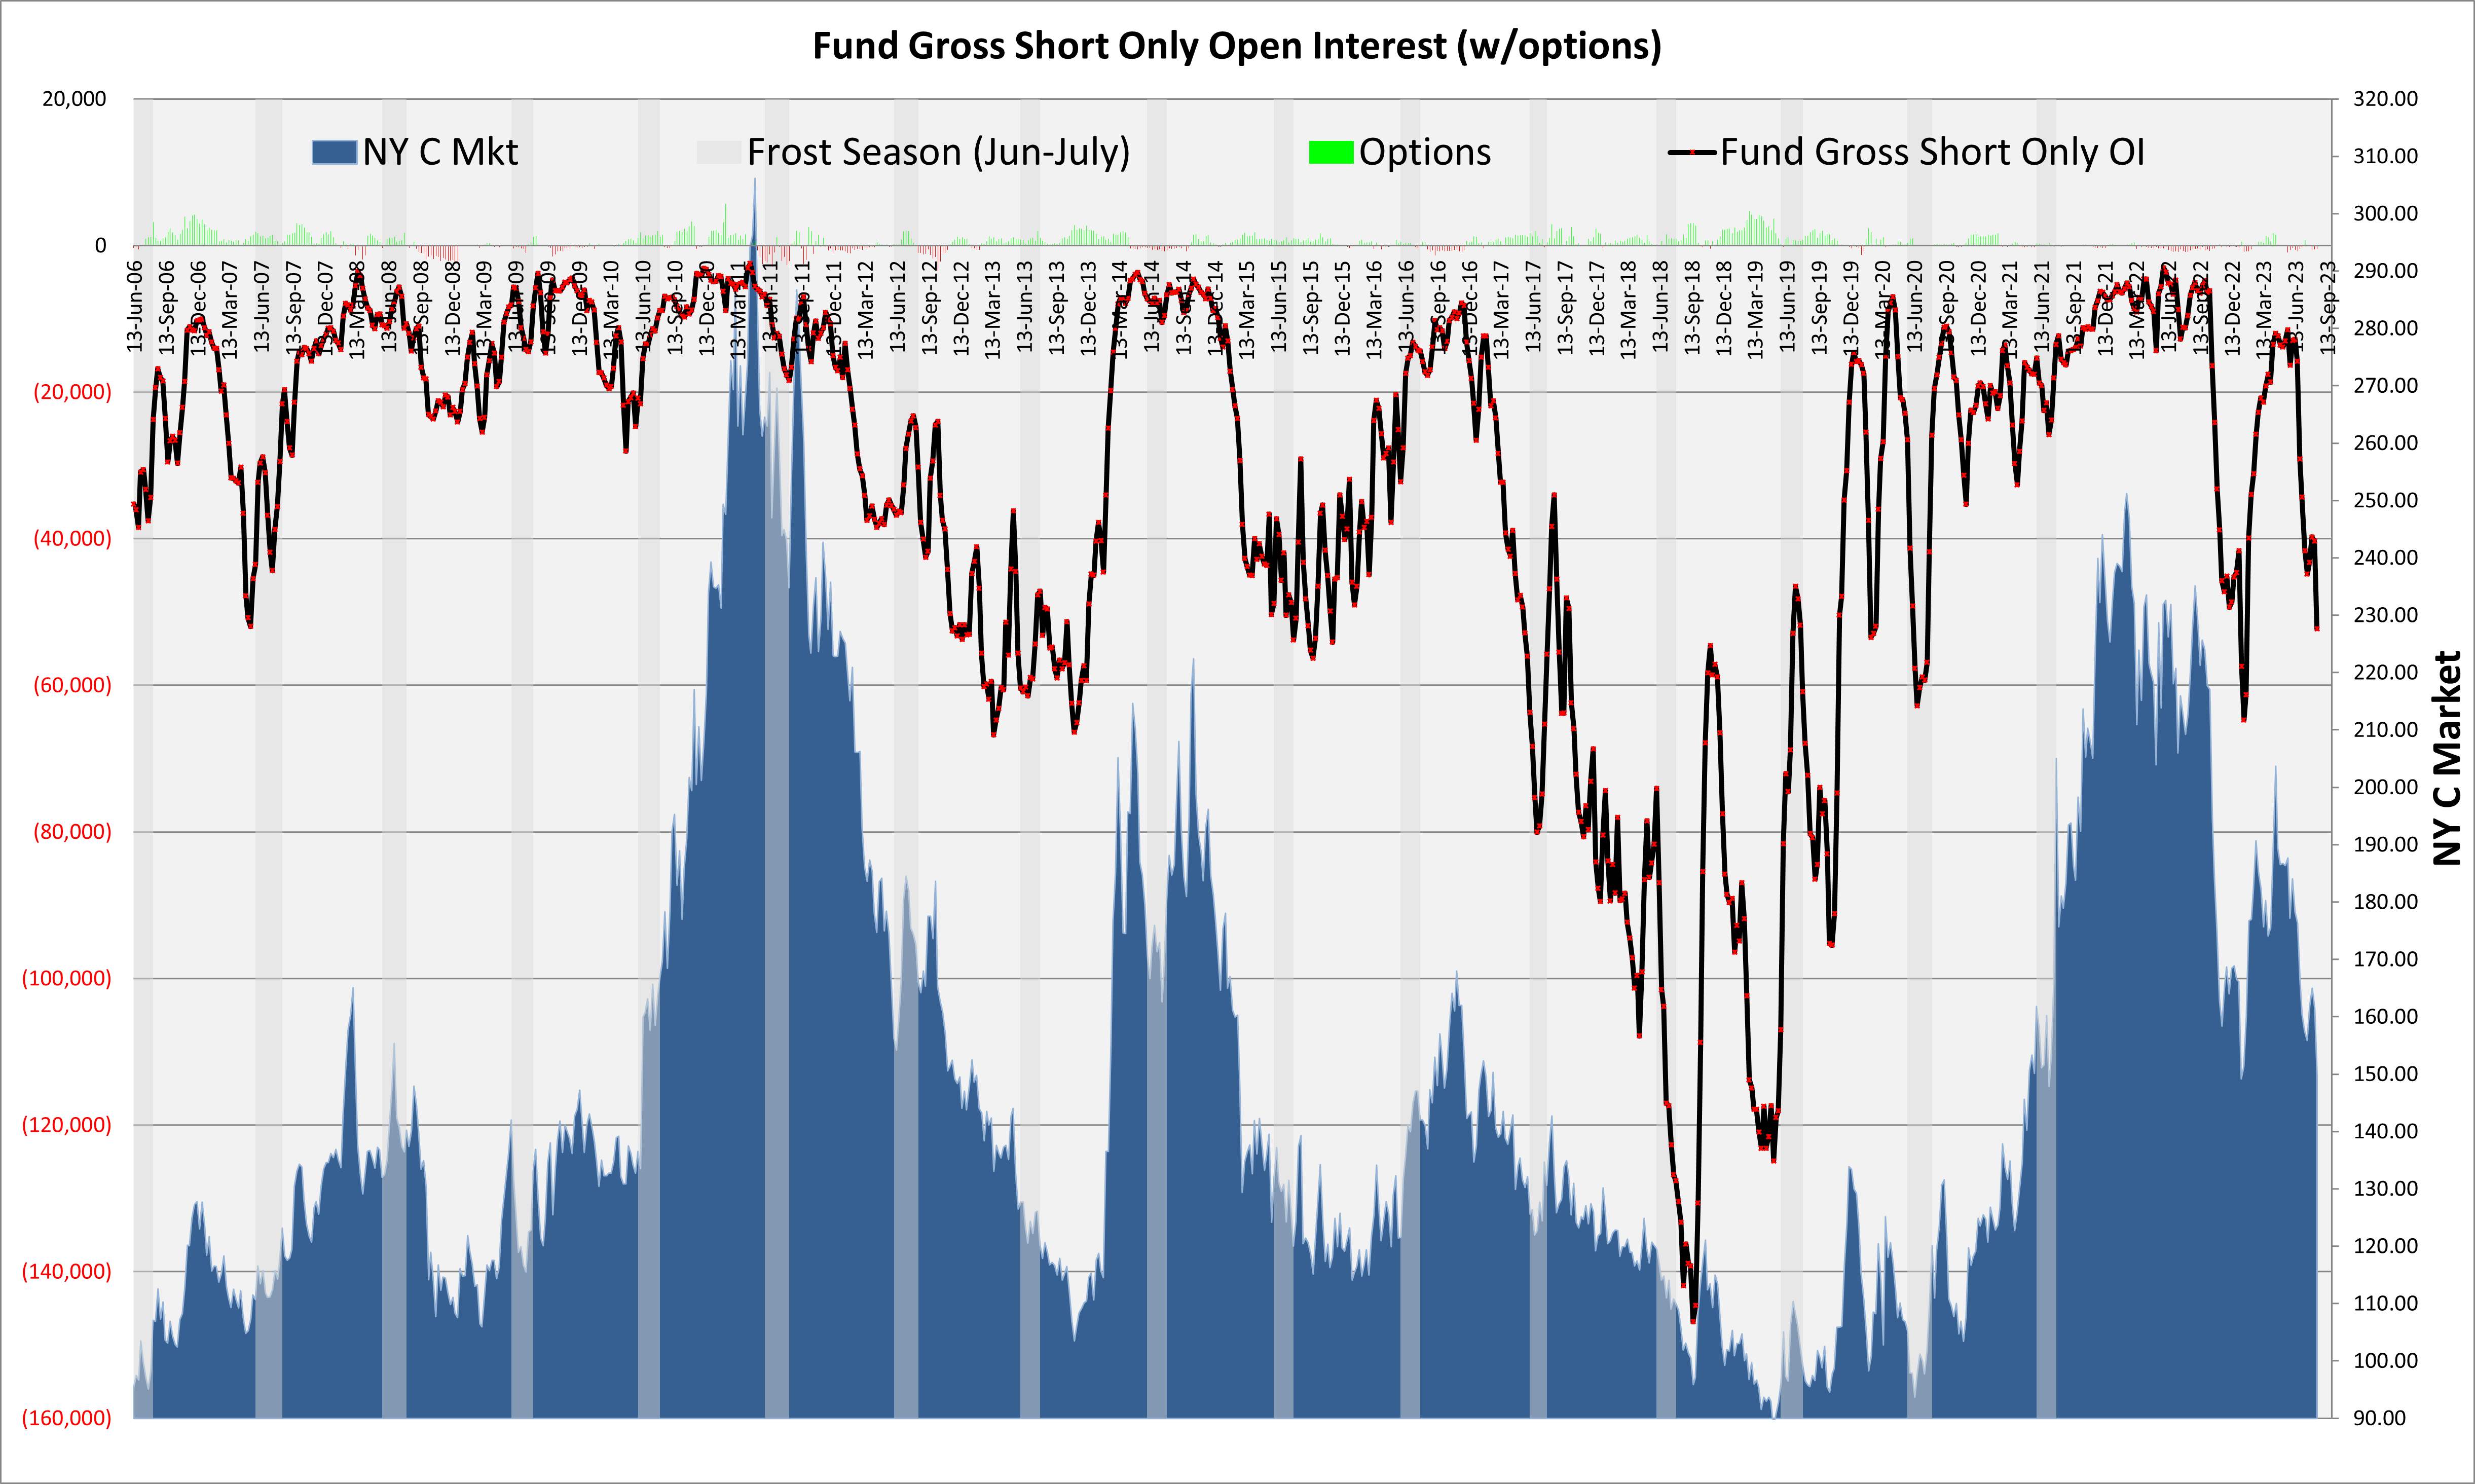
- The two weeks prior to the Aug 15th report saw the market drop 15.4 cents (Tues to Tuesday).
- All of the selling was from the funds, mostly new shorts.
- Ironically most the buying from the Trade/Producer side and not from the Roaster side leaving the still vulnerable should fundamentals change or weather spark a rally.
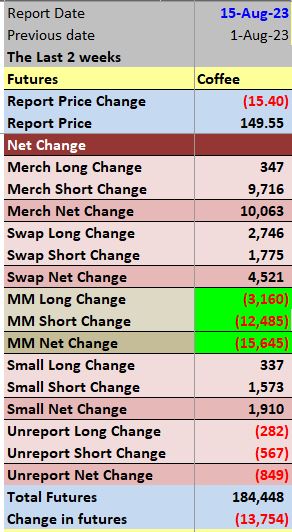
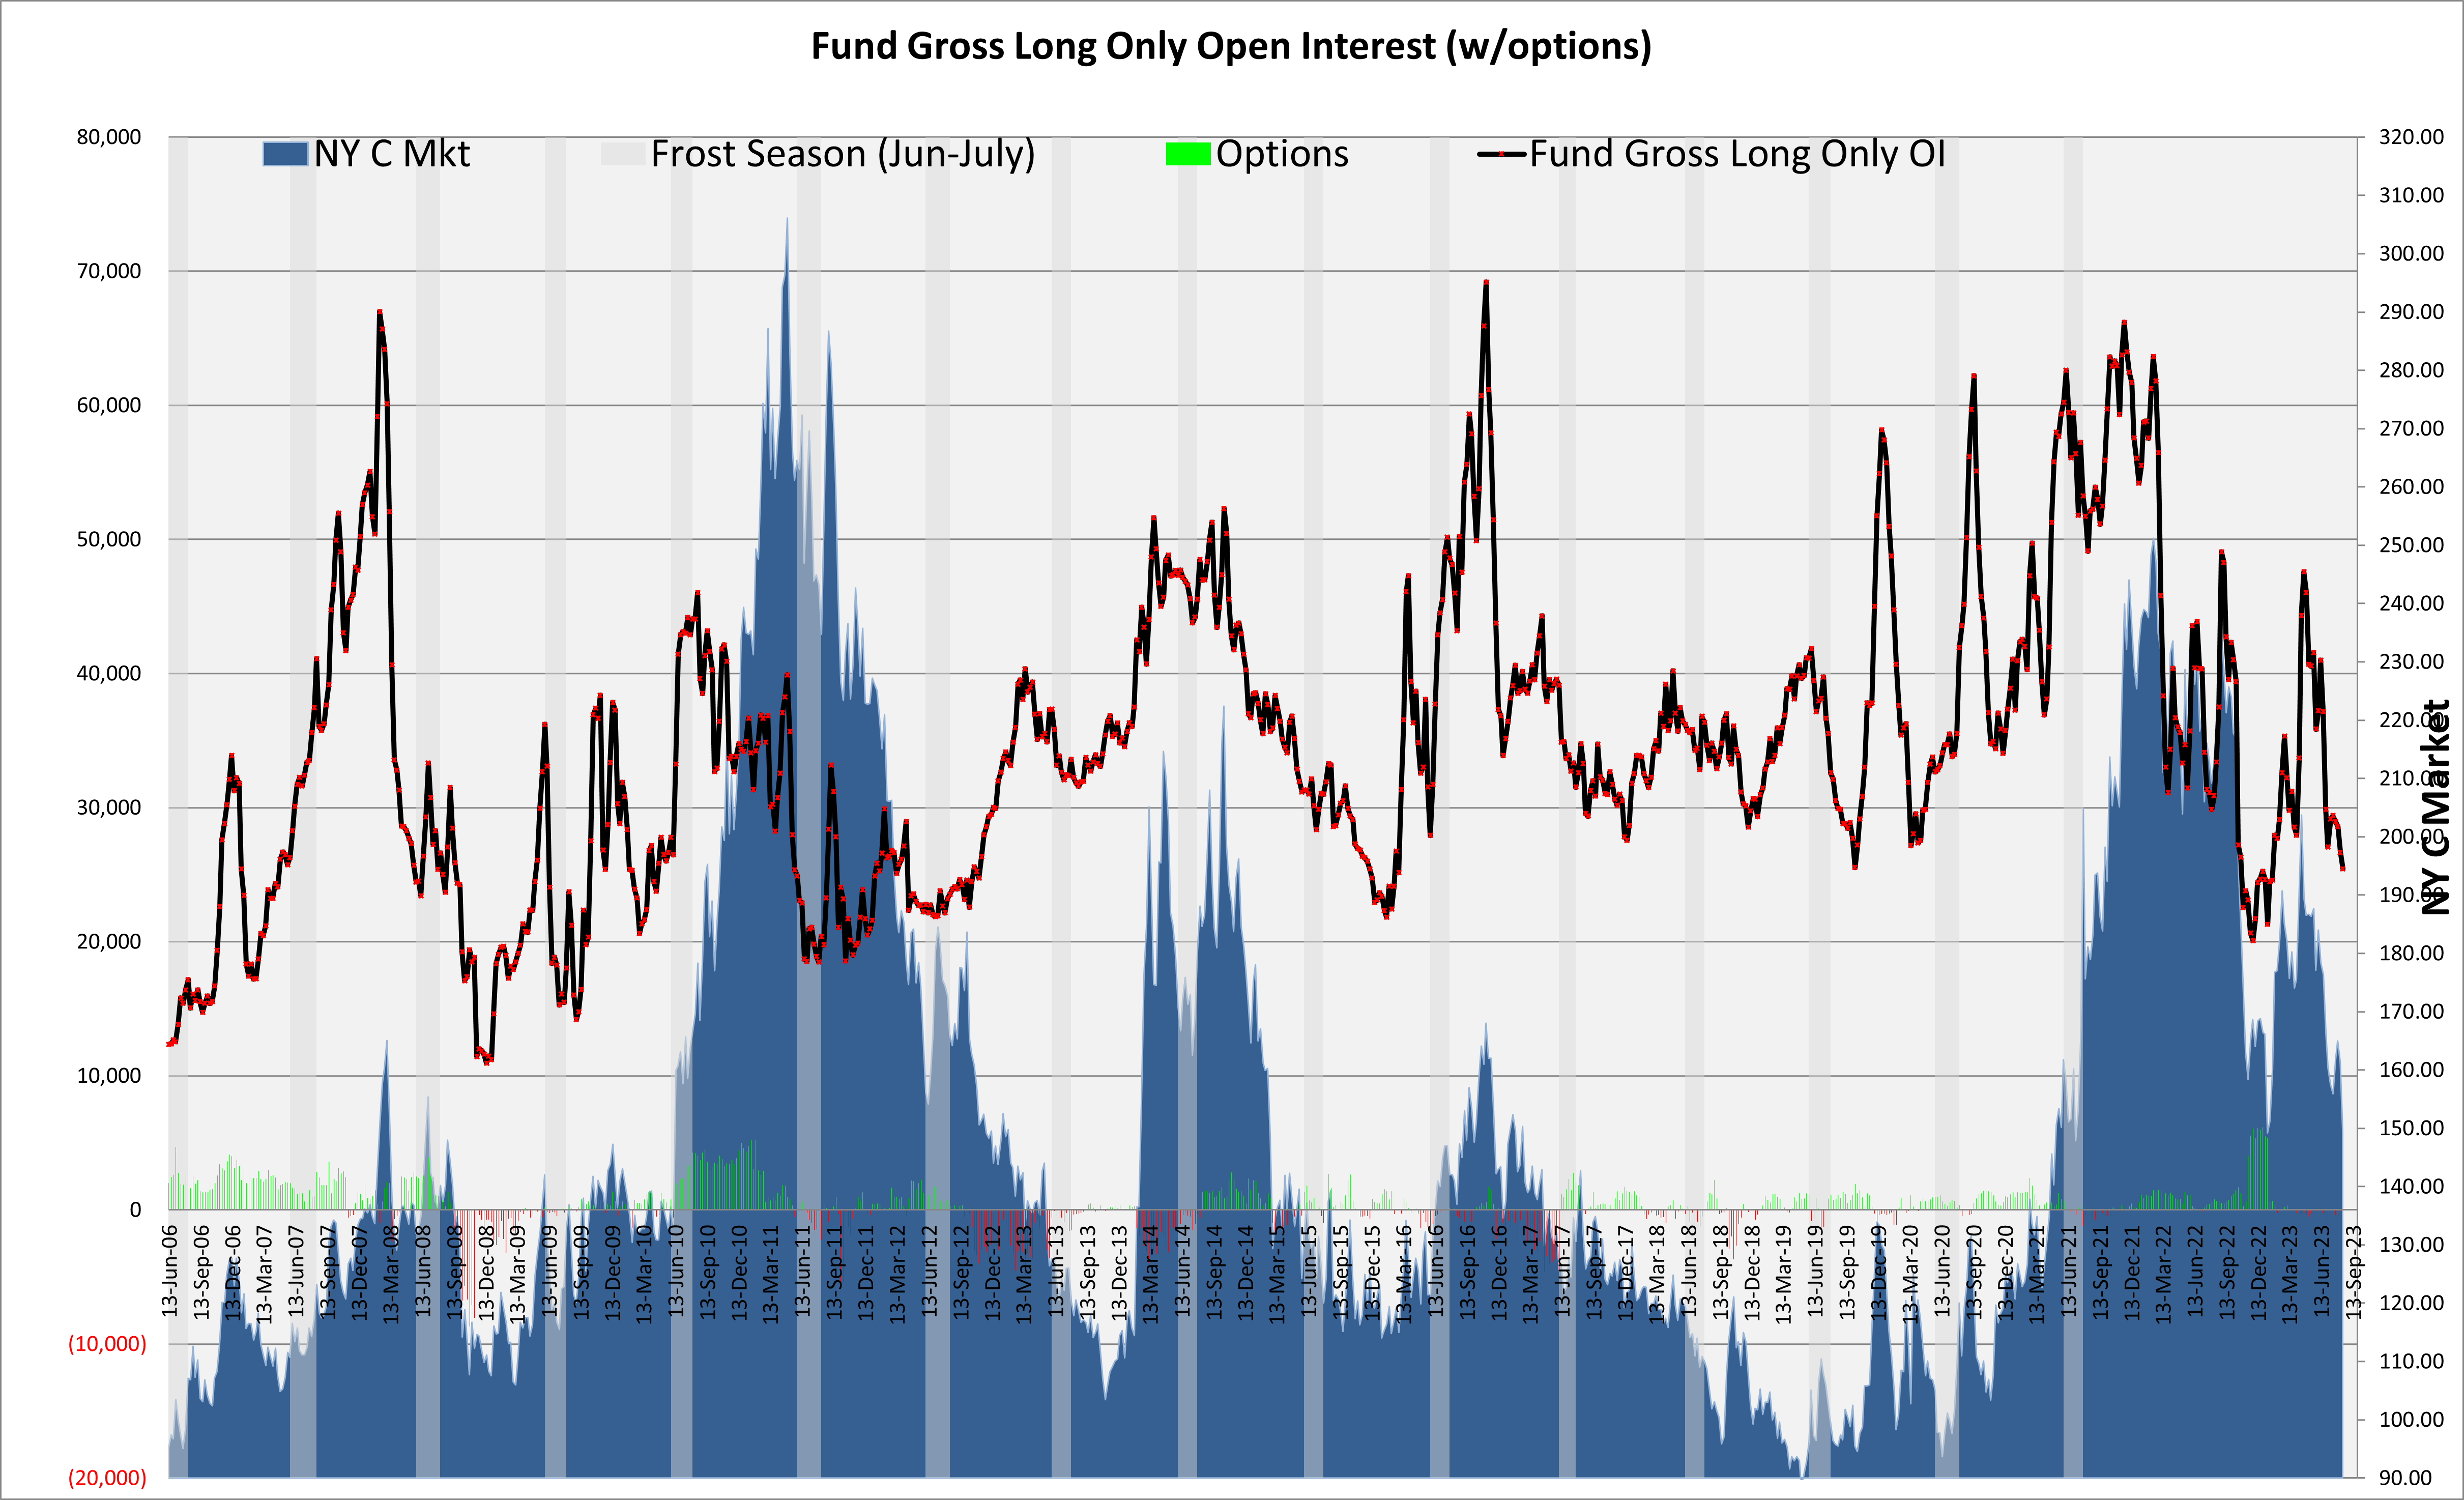
Managed Money
- Historically speaking we are decently net short. Nothing compared to what happened in 2018, but looking back over the last 2o years, funds would be considered exposed to a short covering rally.
- Gross long has liquidated substantially.
- Gross short is, as mentioned above, historically fairly short. It’s not clear that the fundamentals would at all support another large short position like 2018.
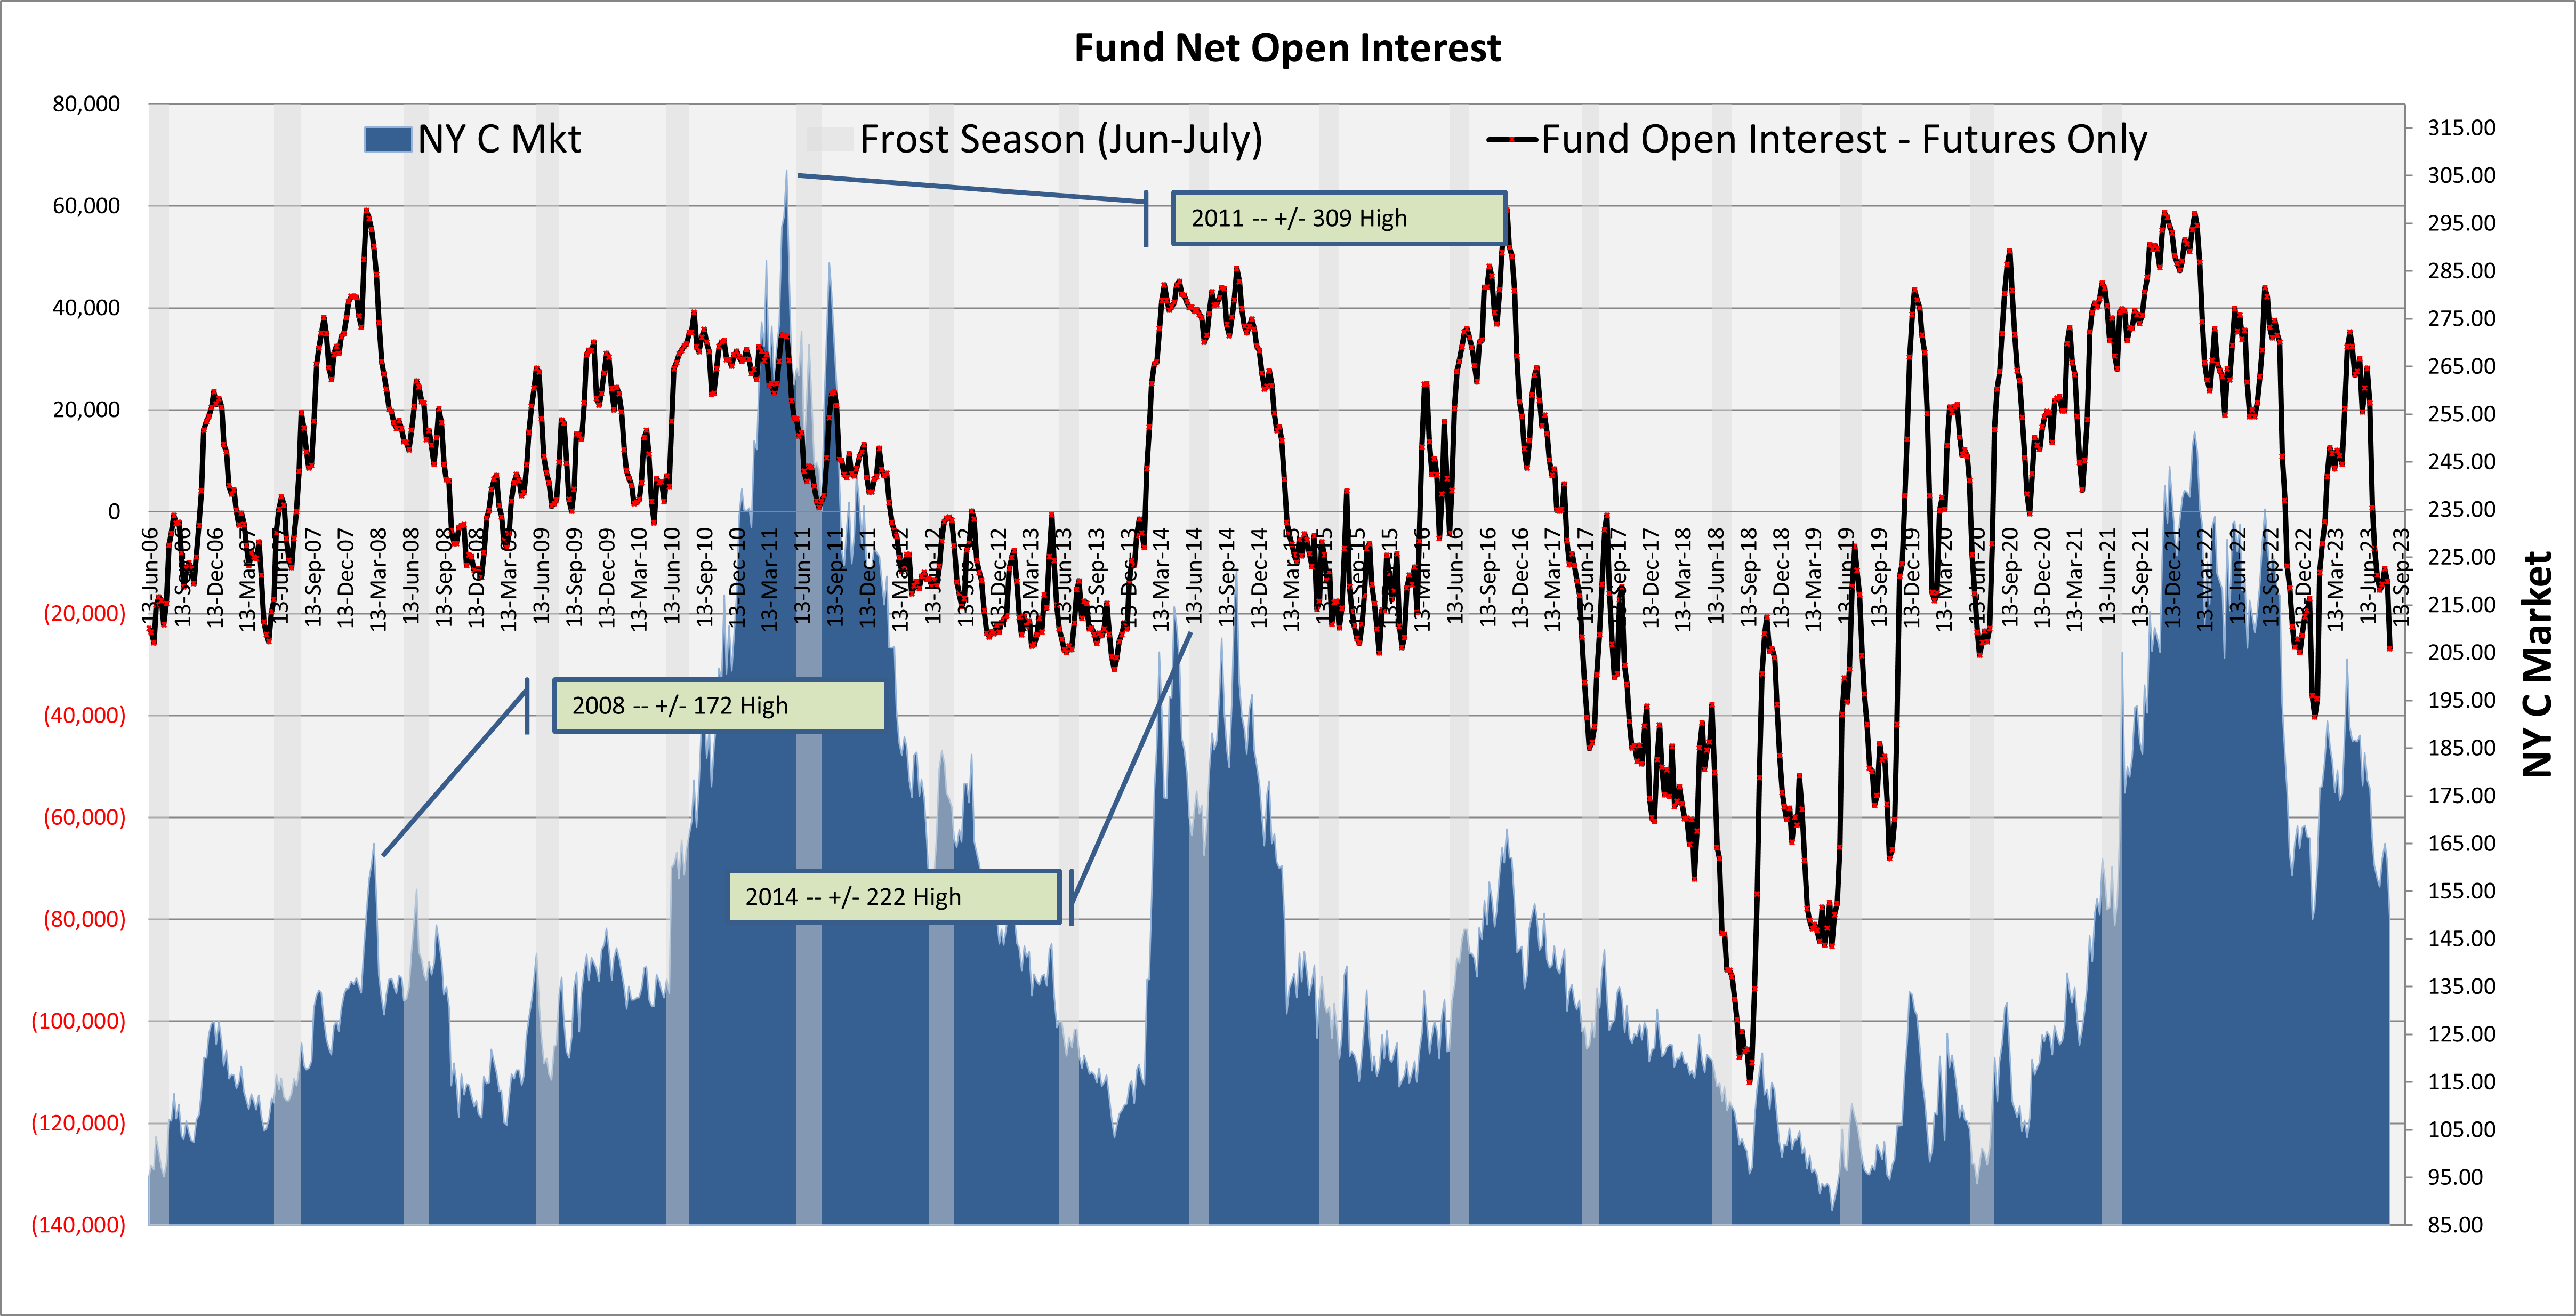
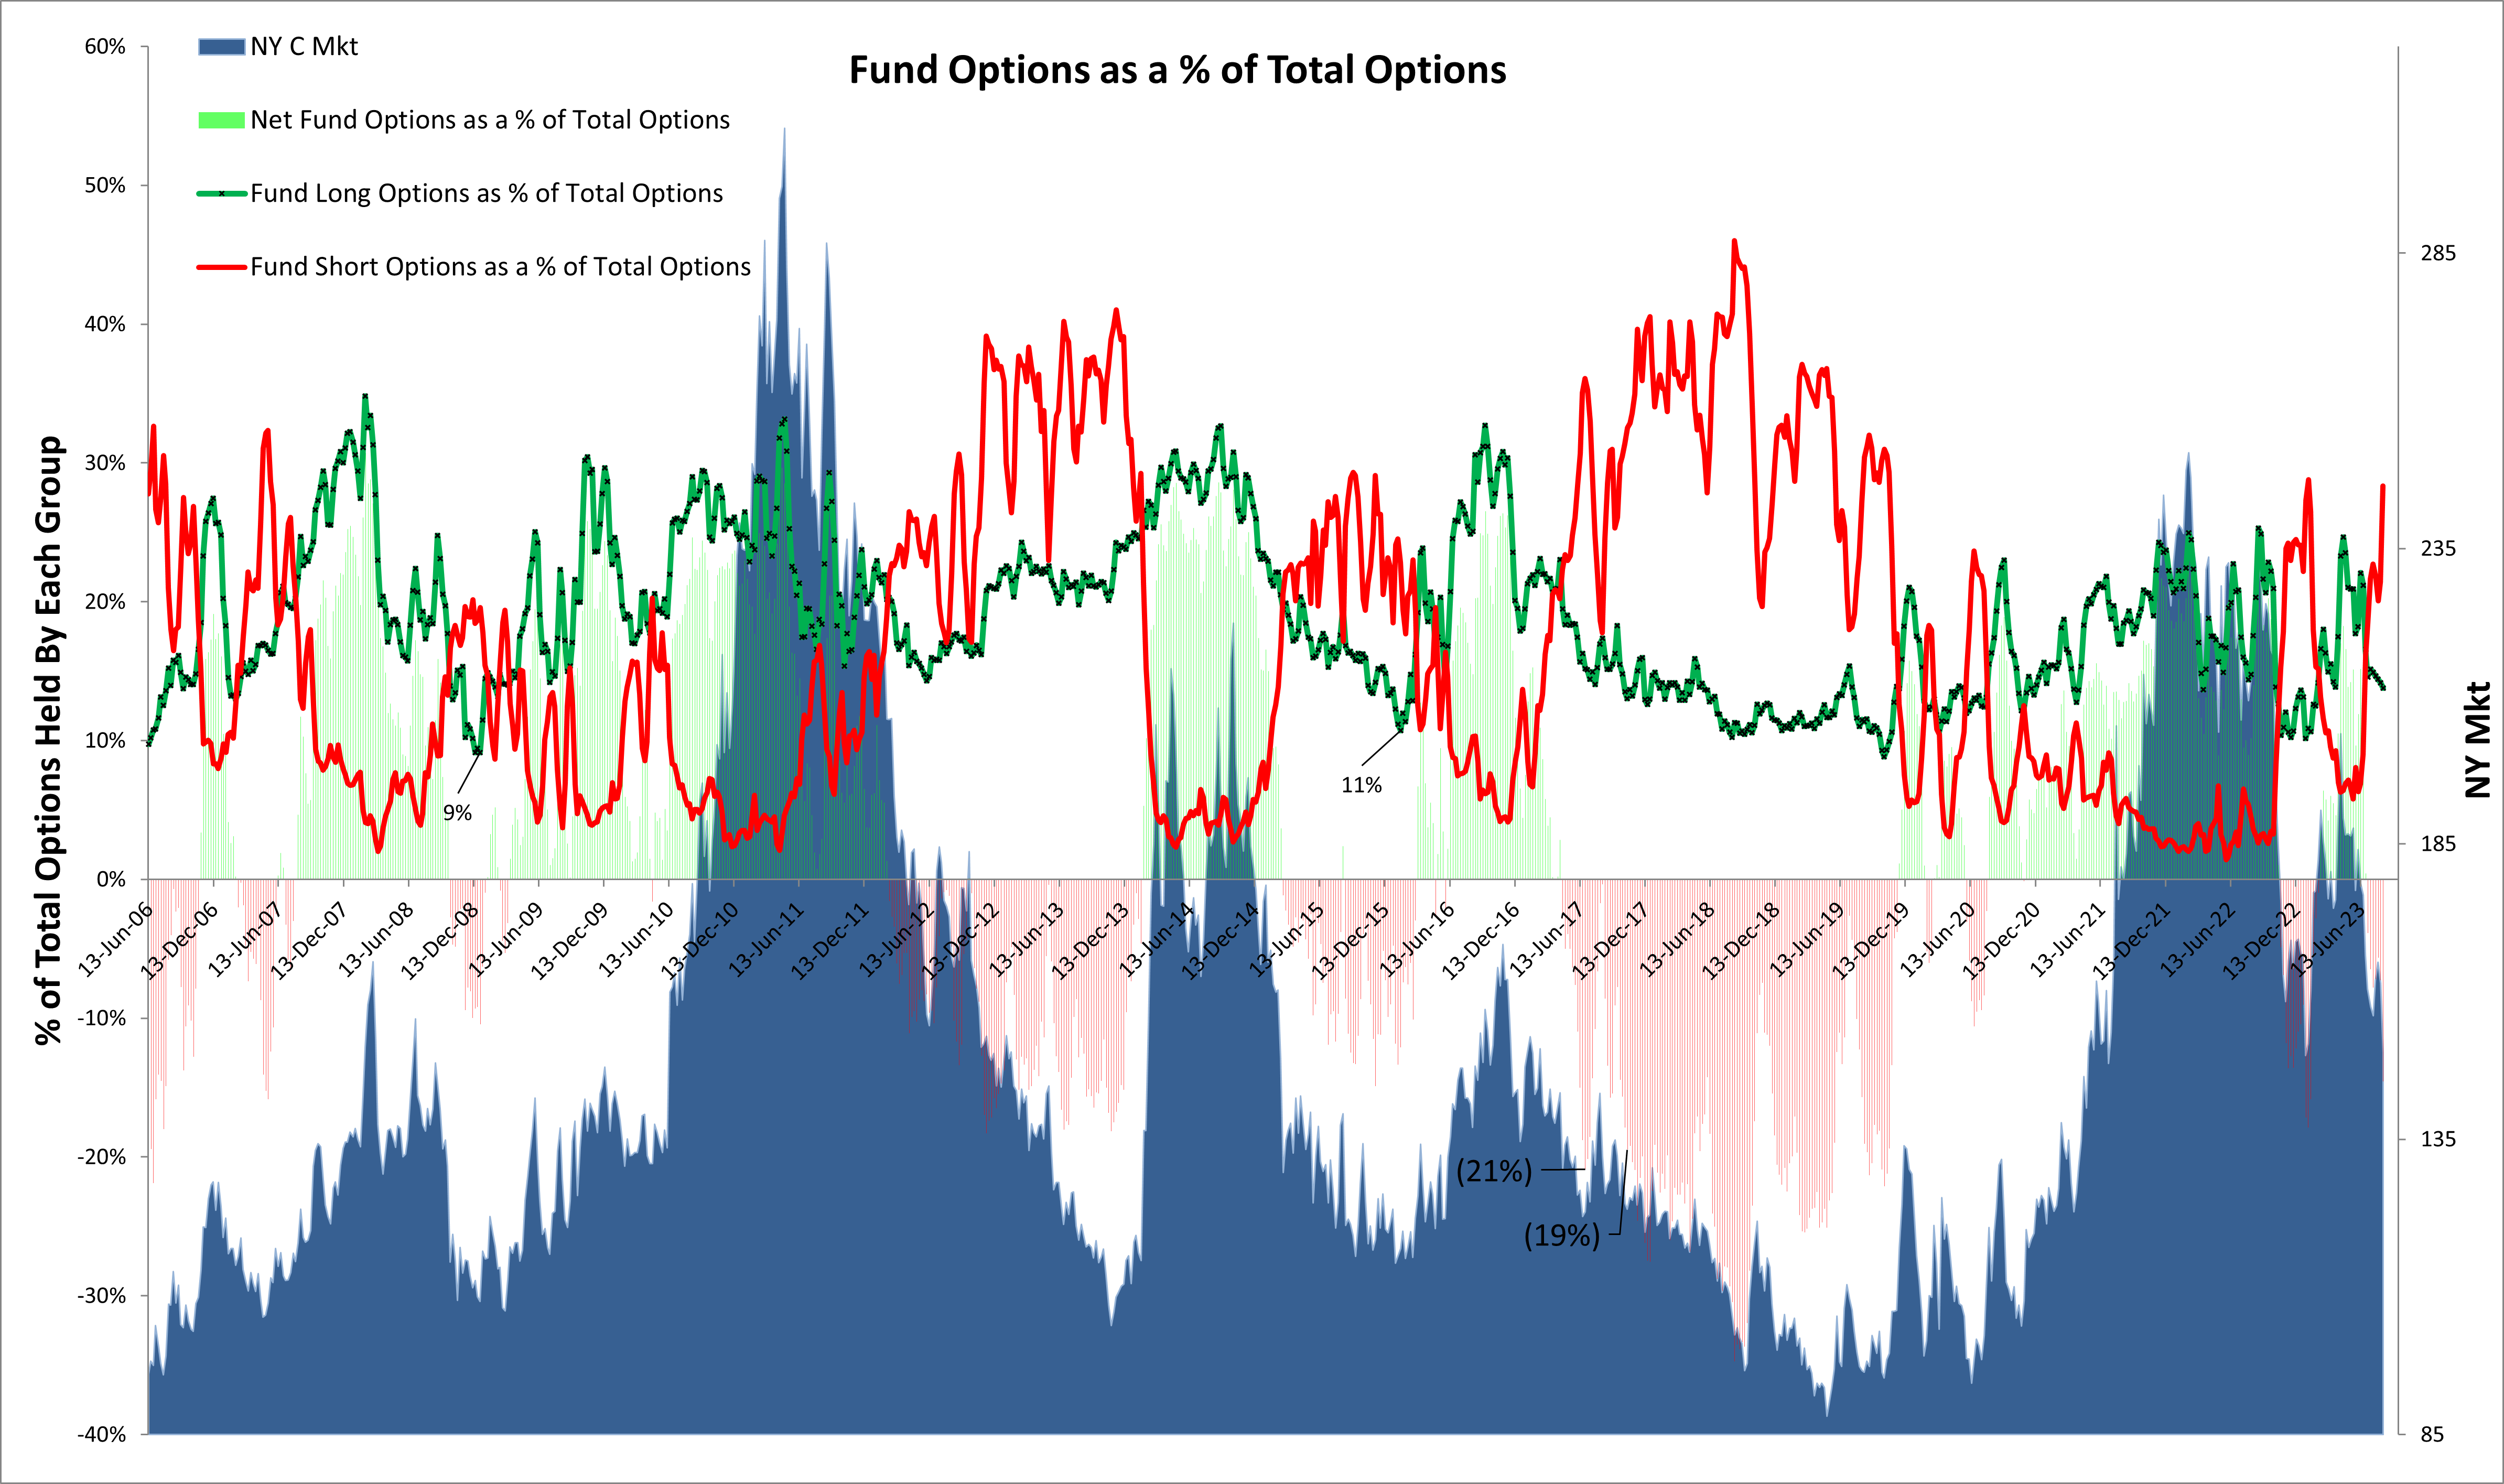
Managed Money – Options and # of Participants
- Both of these graphs suggest maybe short term rally, but more sustained, medium term downside.
- The number of # funds now far outweighing the # of long funds.

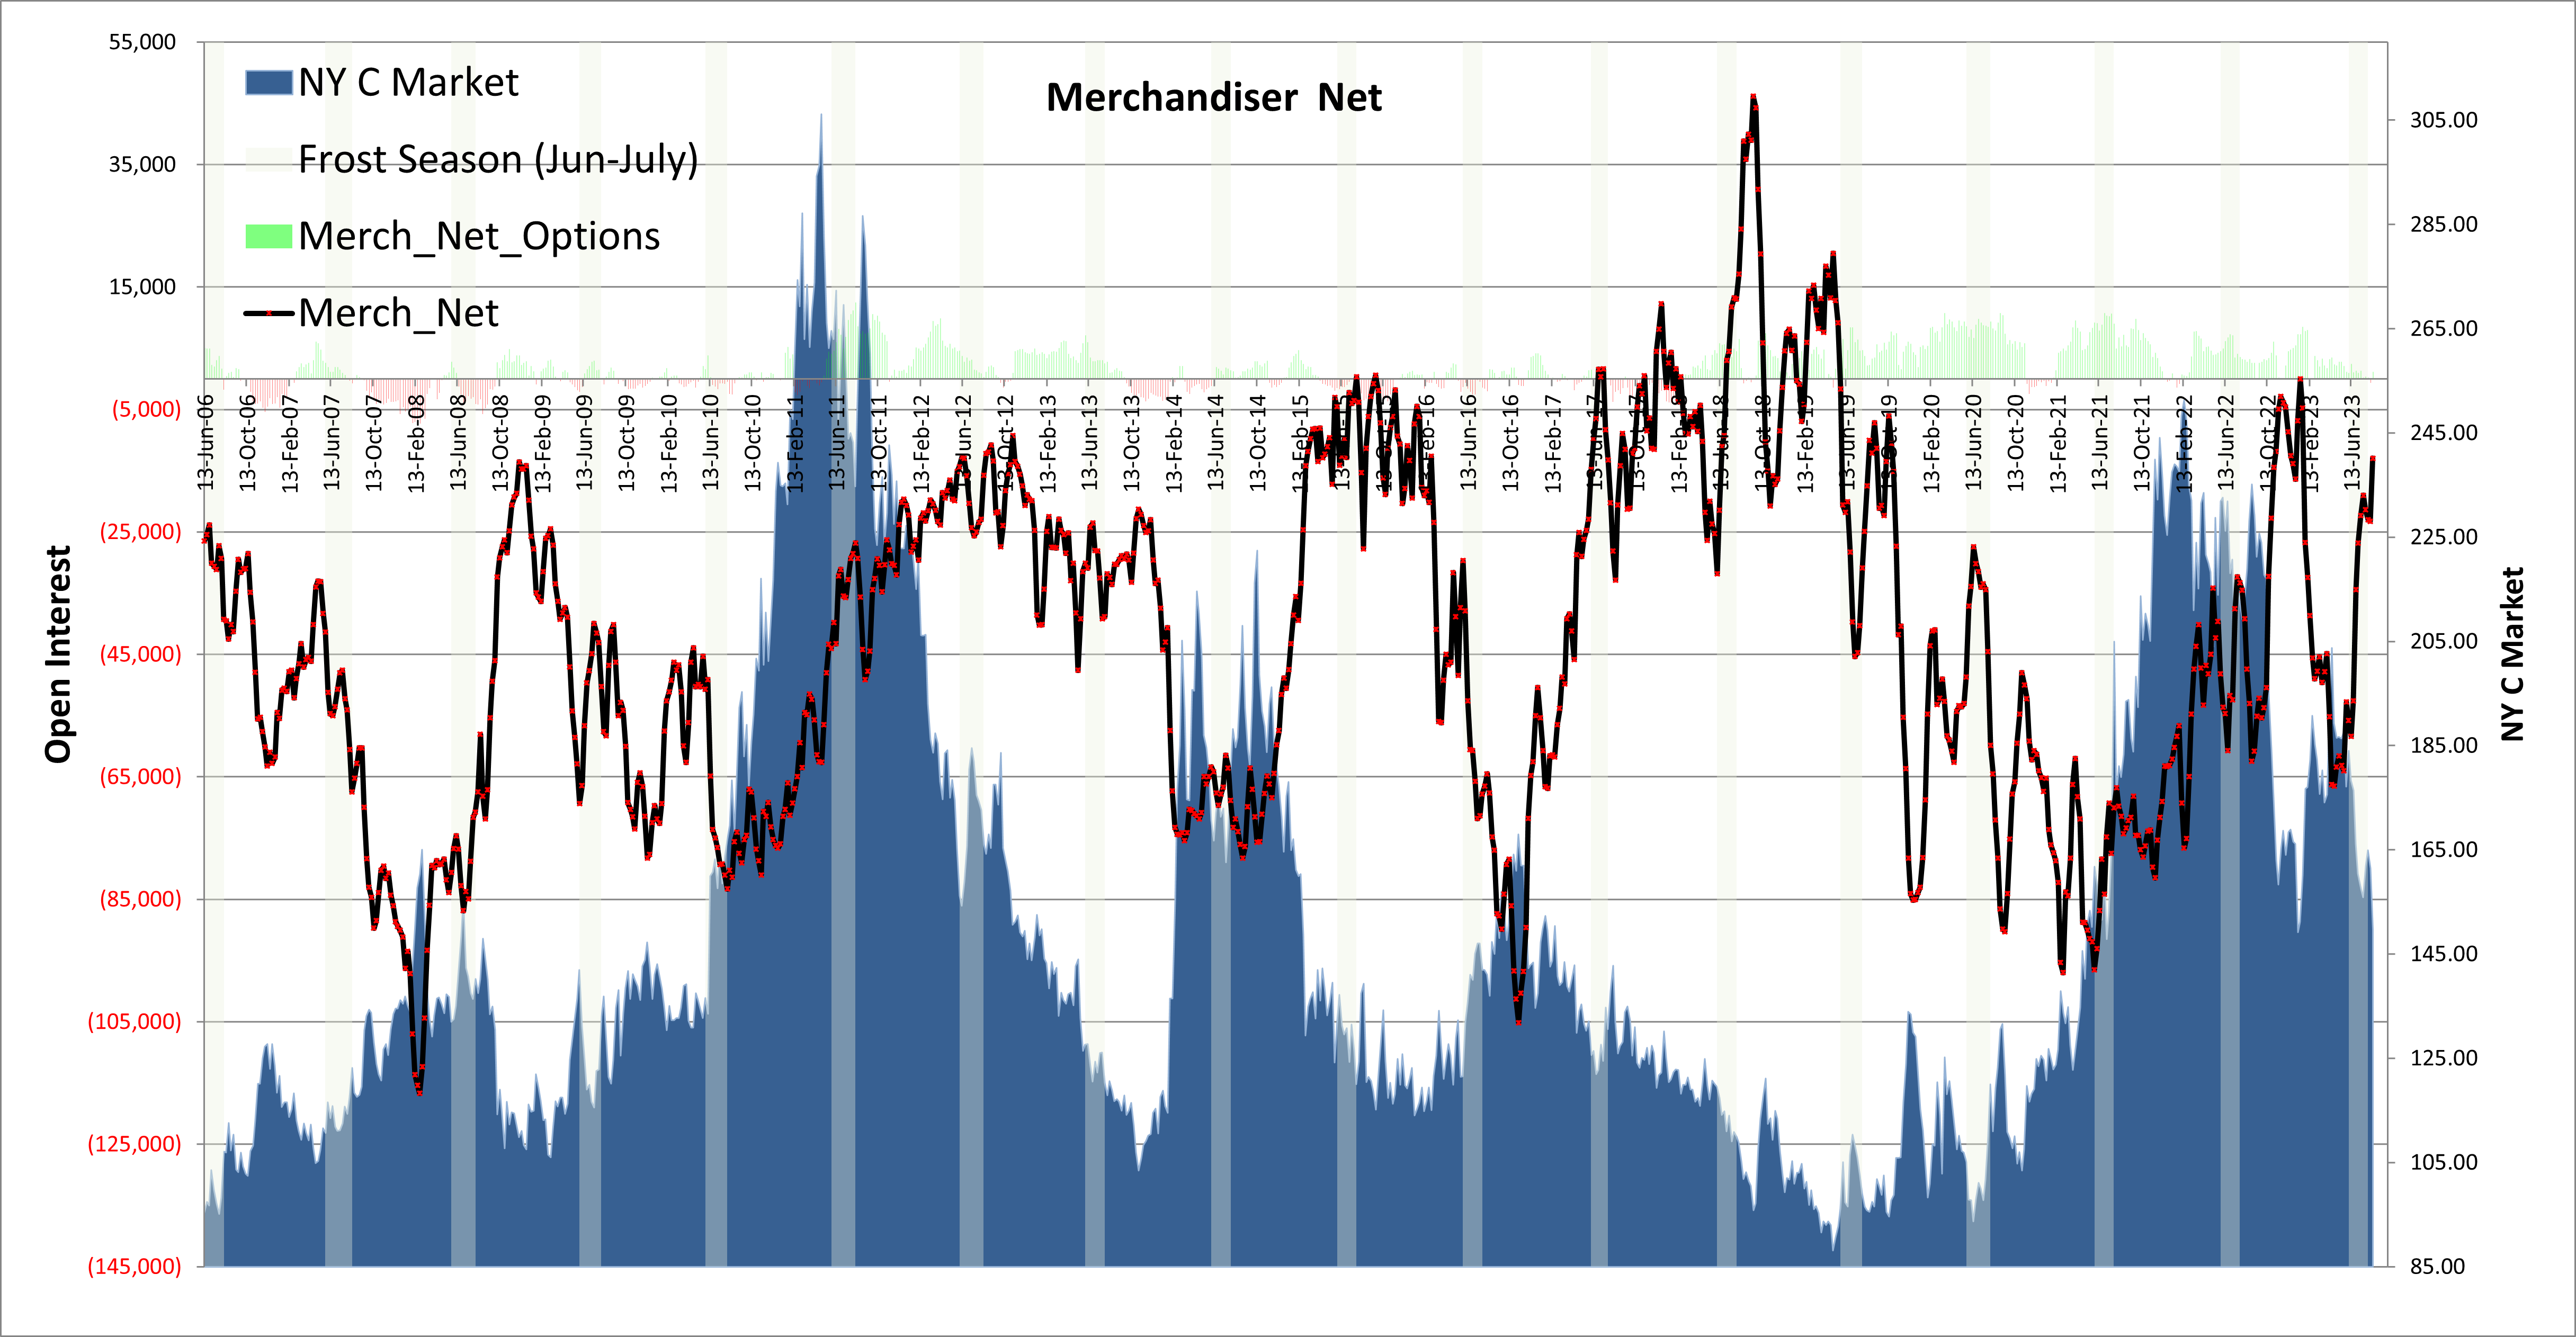
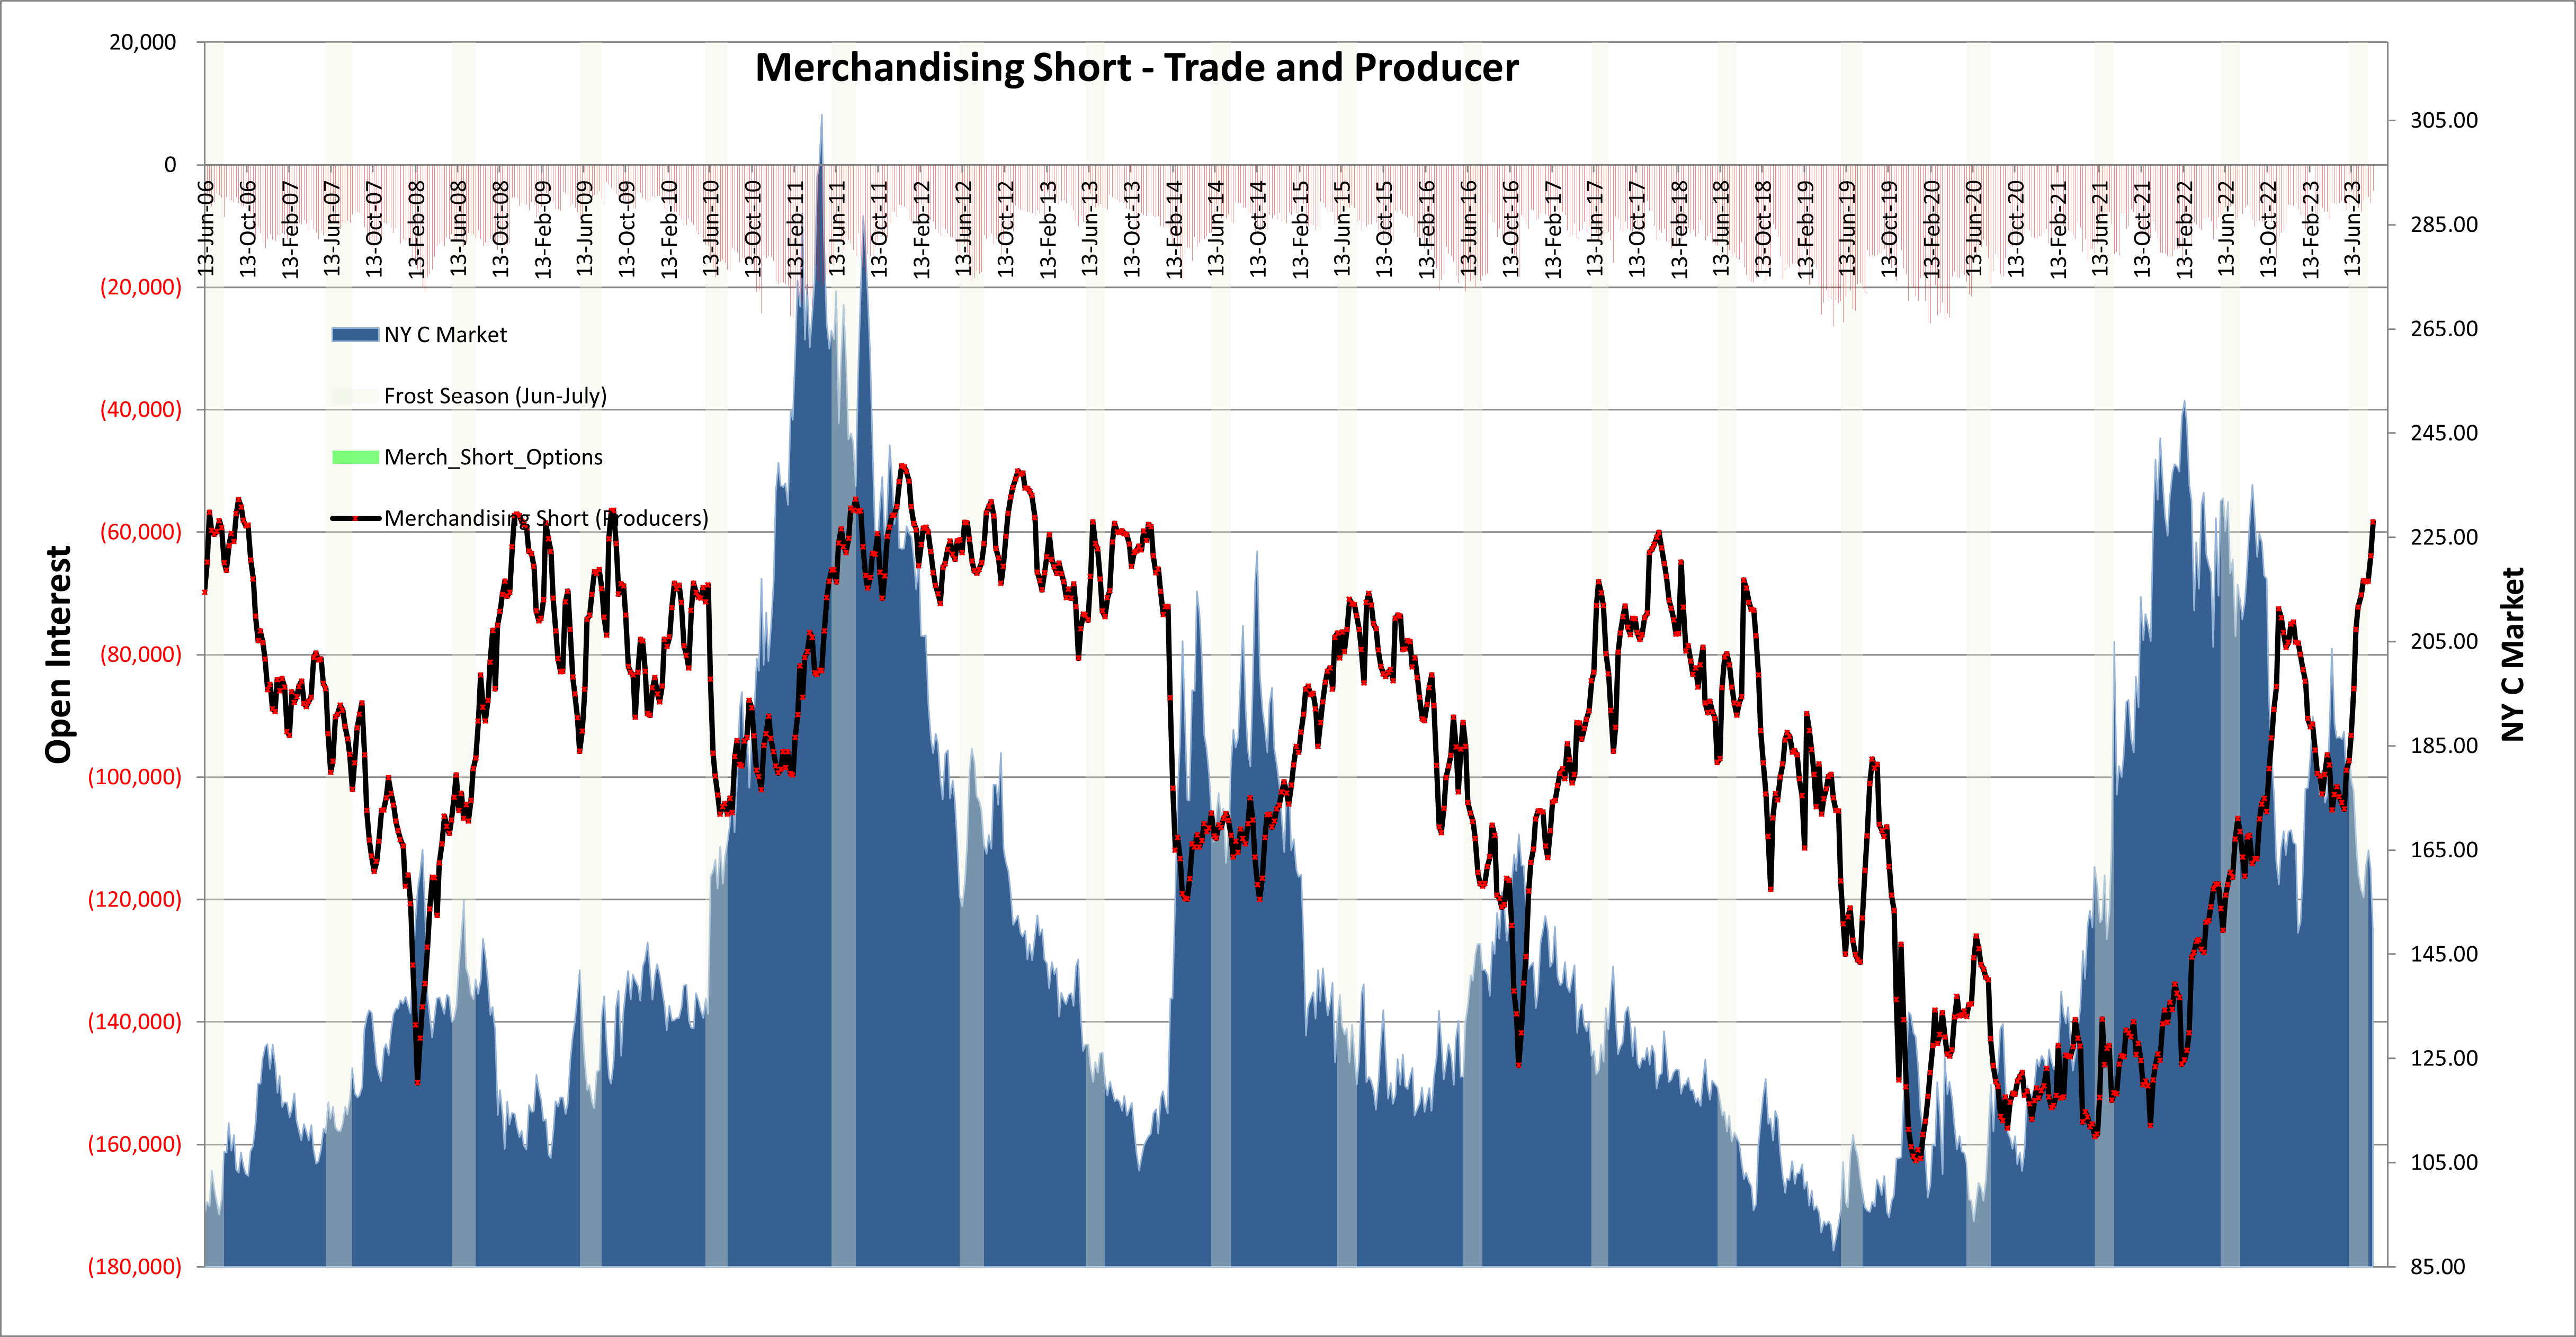
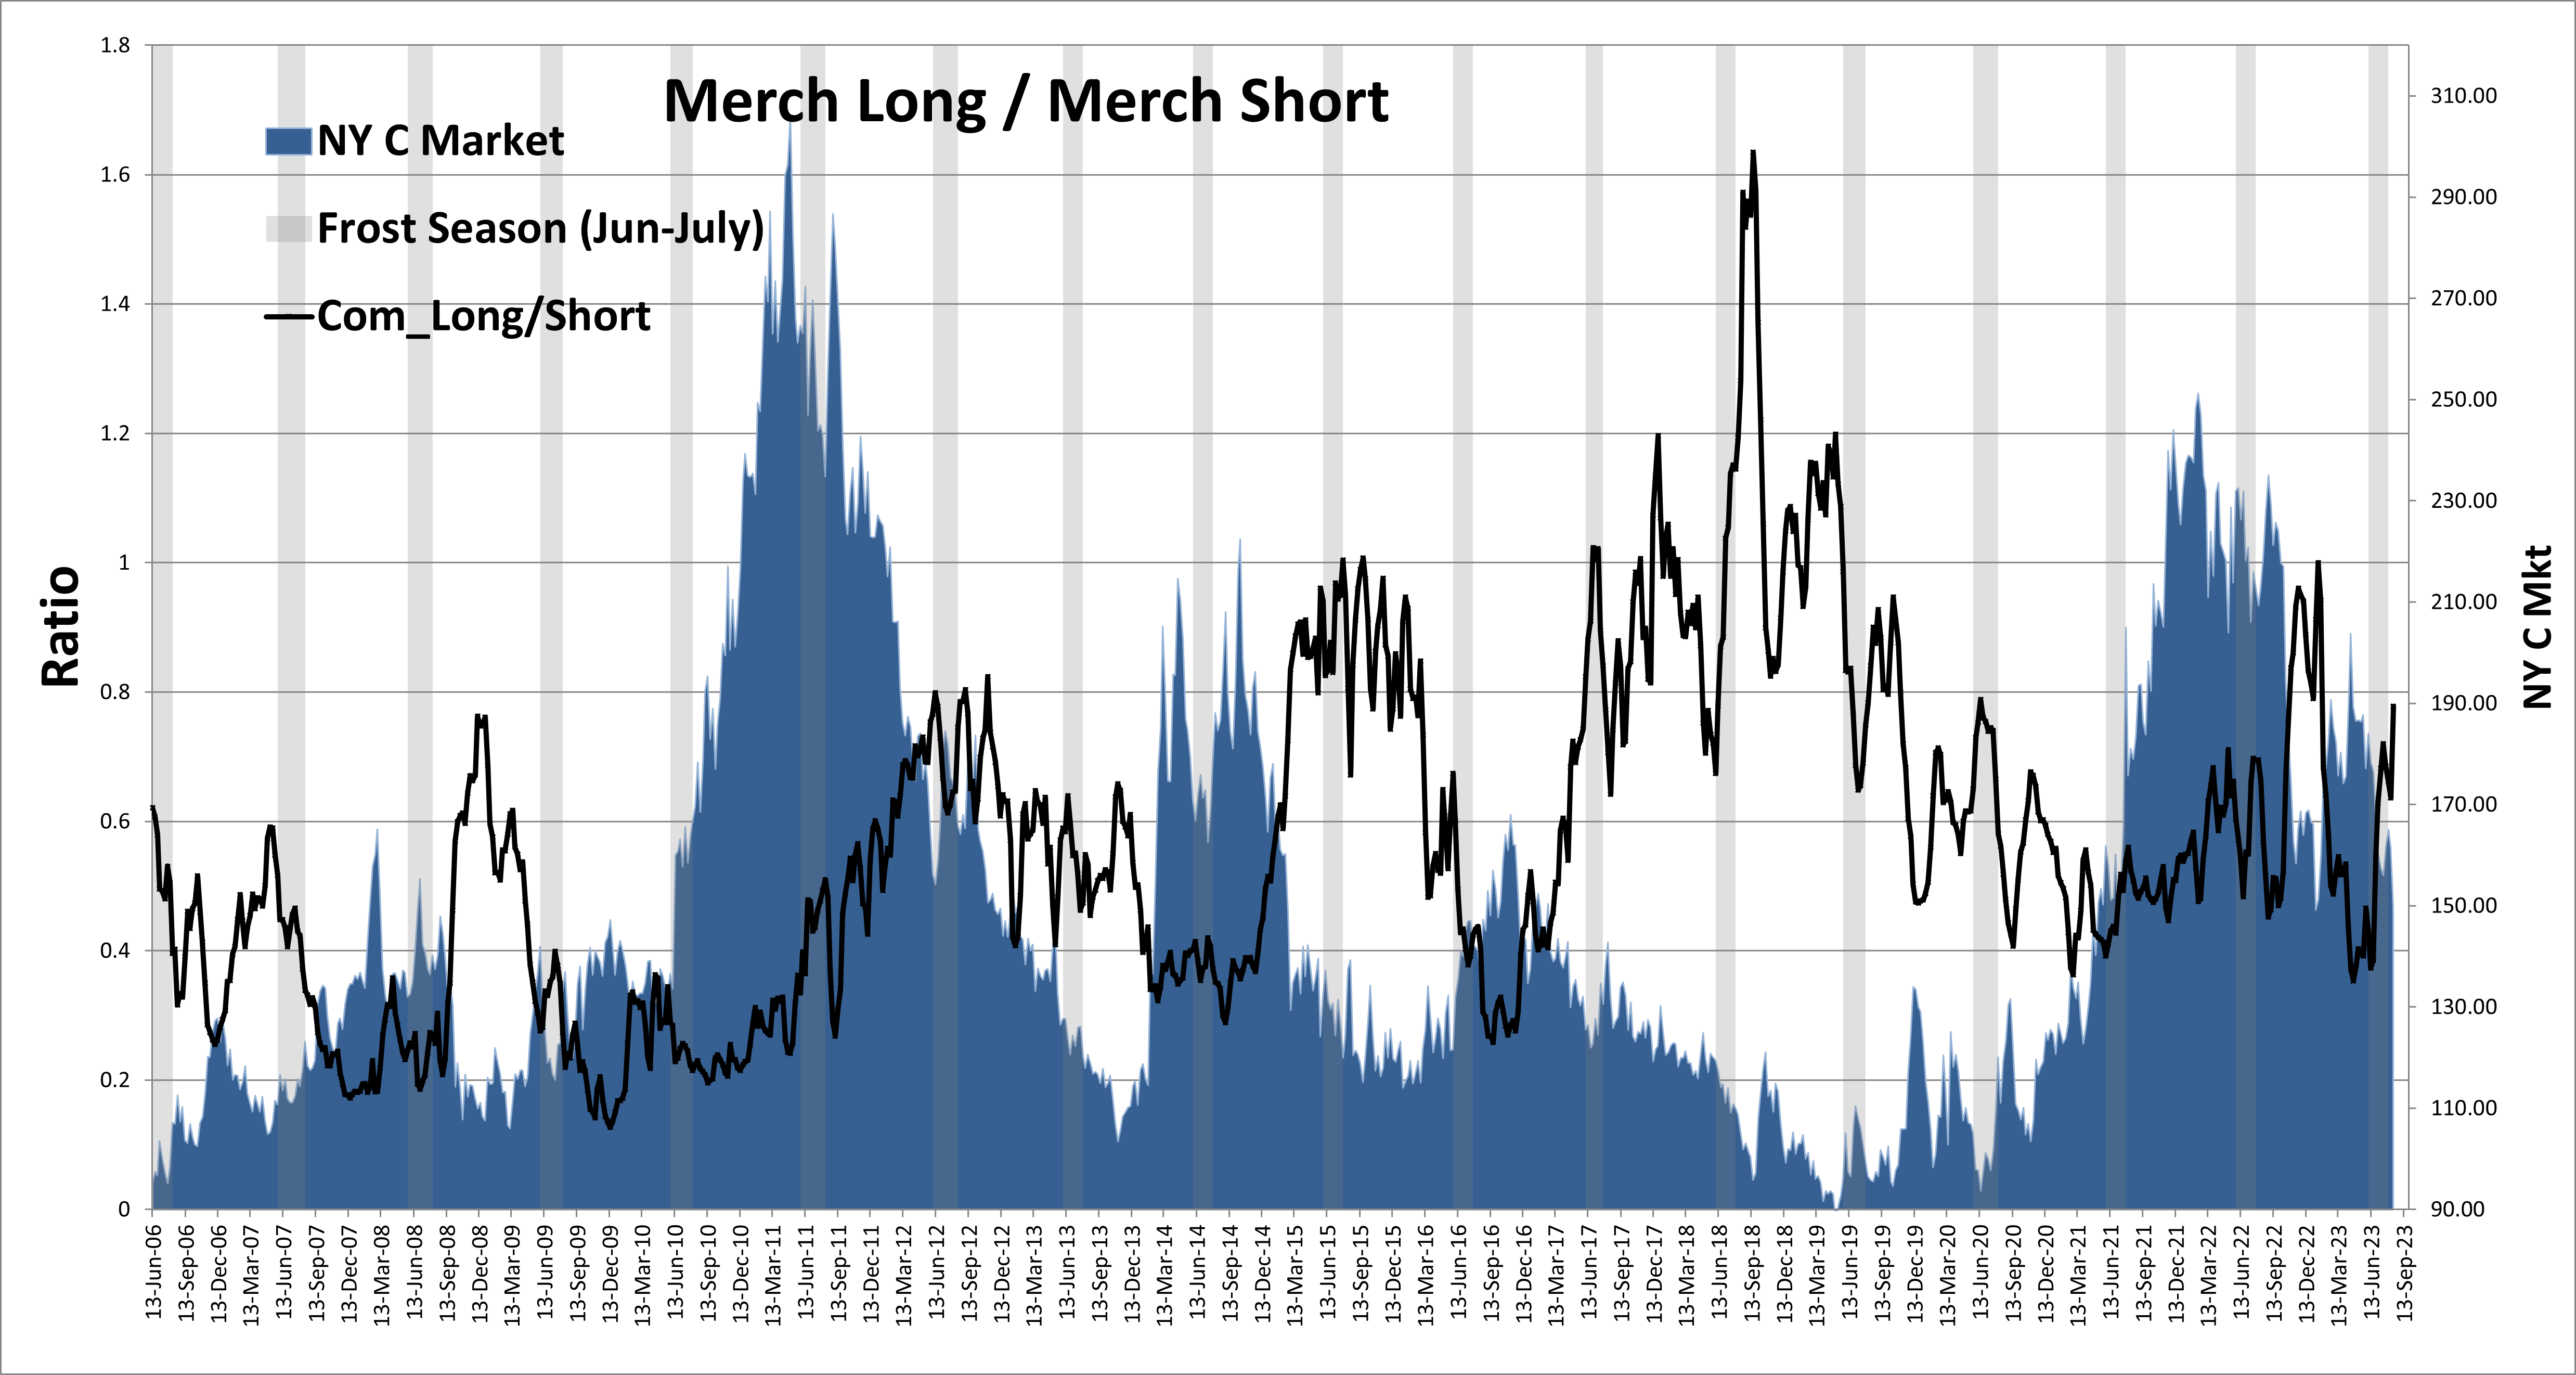
Merchandising
- Merchandising Net suggest producers not happy at all with prices and a near record for smallest gross short position. It also suggest that there out to be resistance should the market rally.
- Gross long shows the Roaster quite exposed, but also patient in their expectation of lower prices.

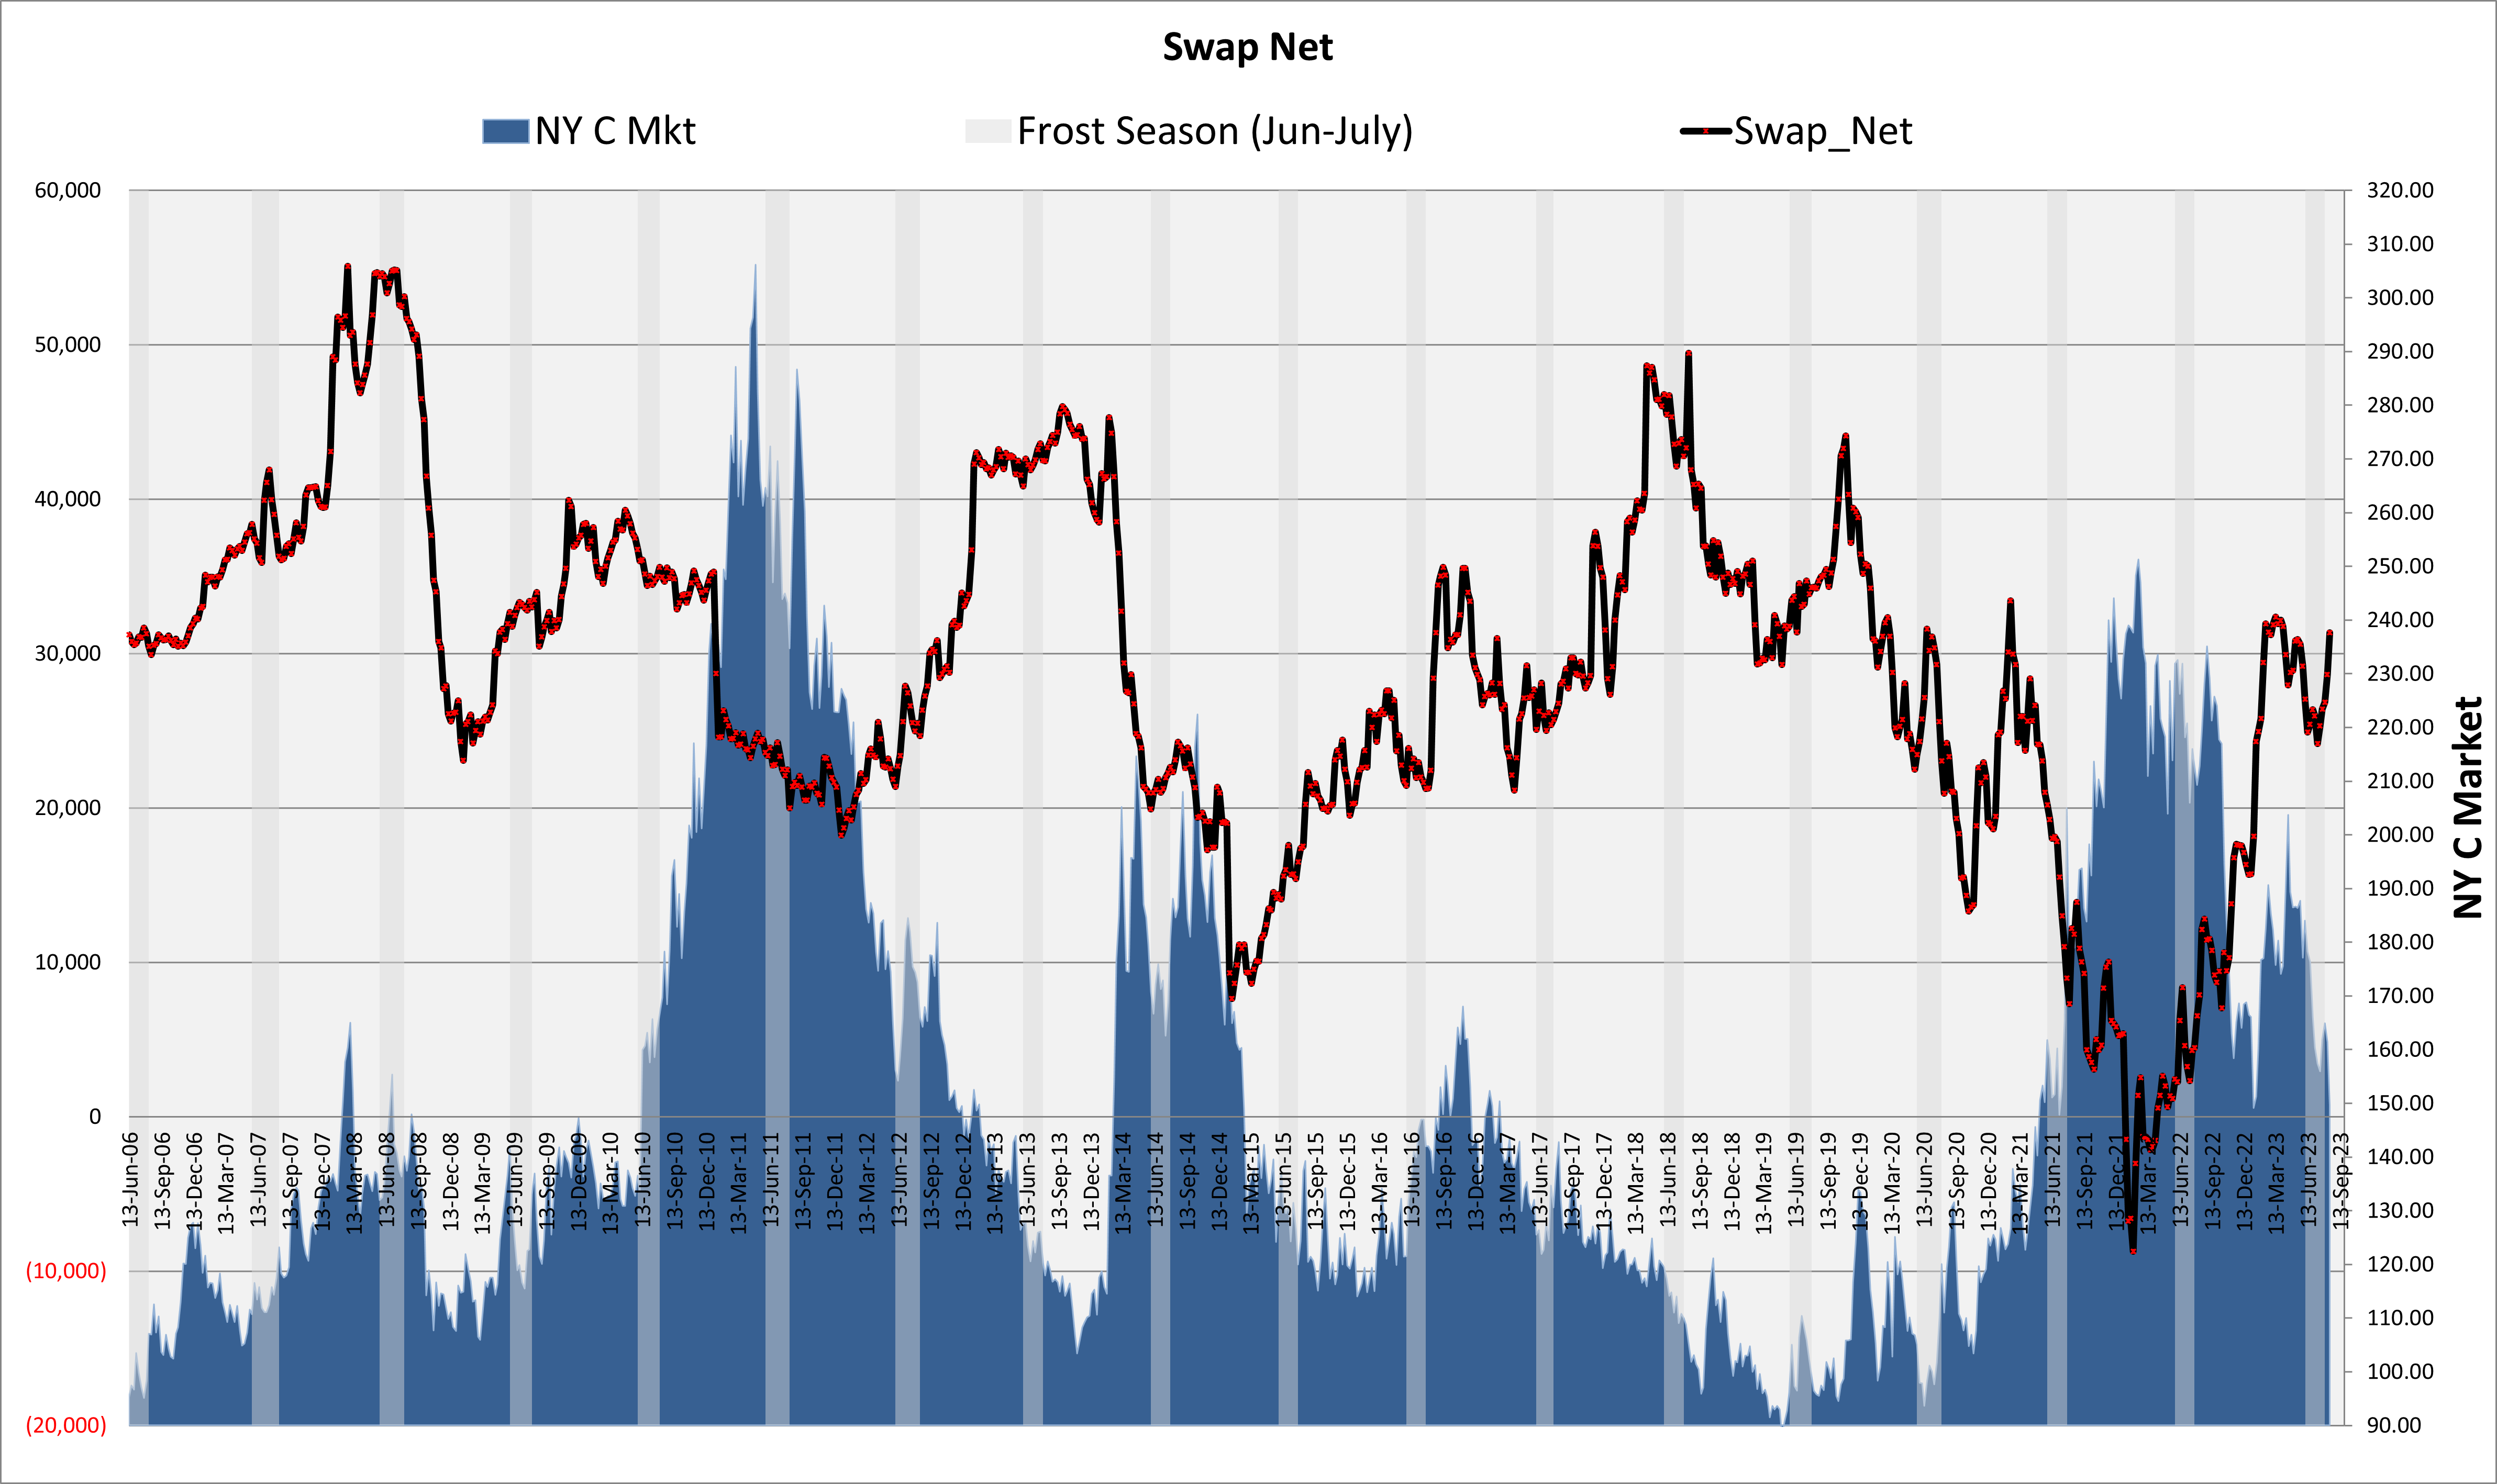
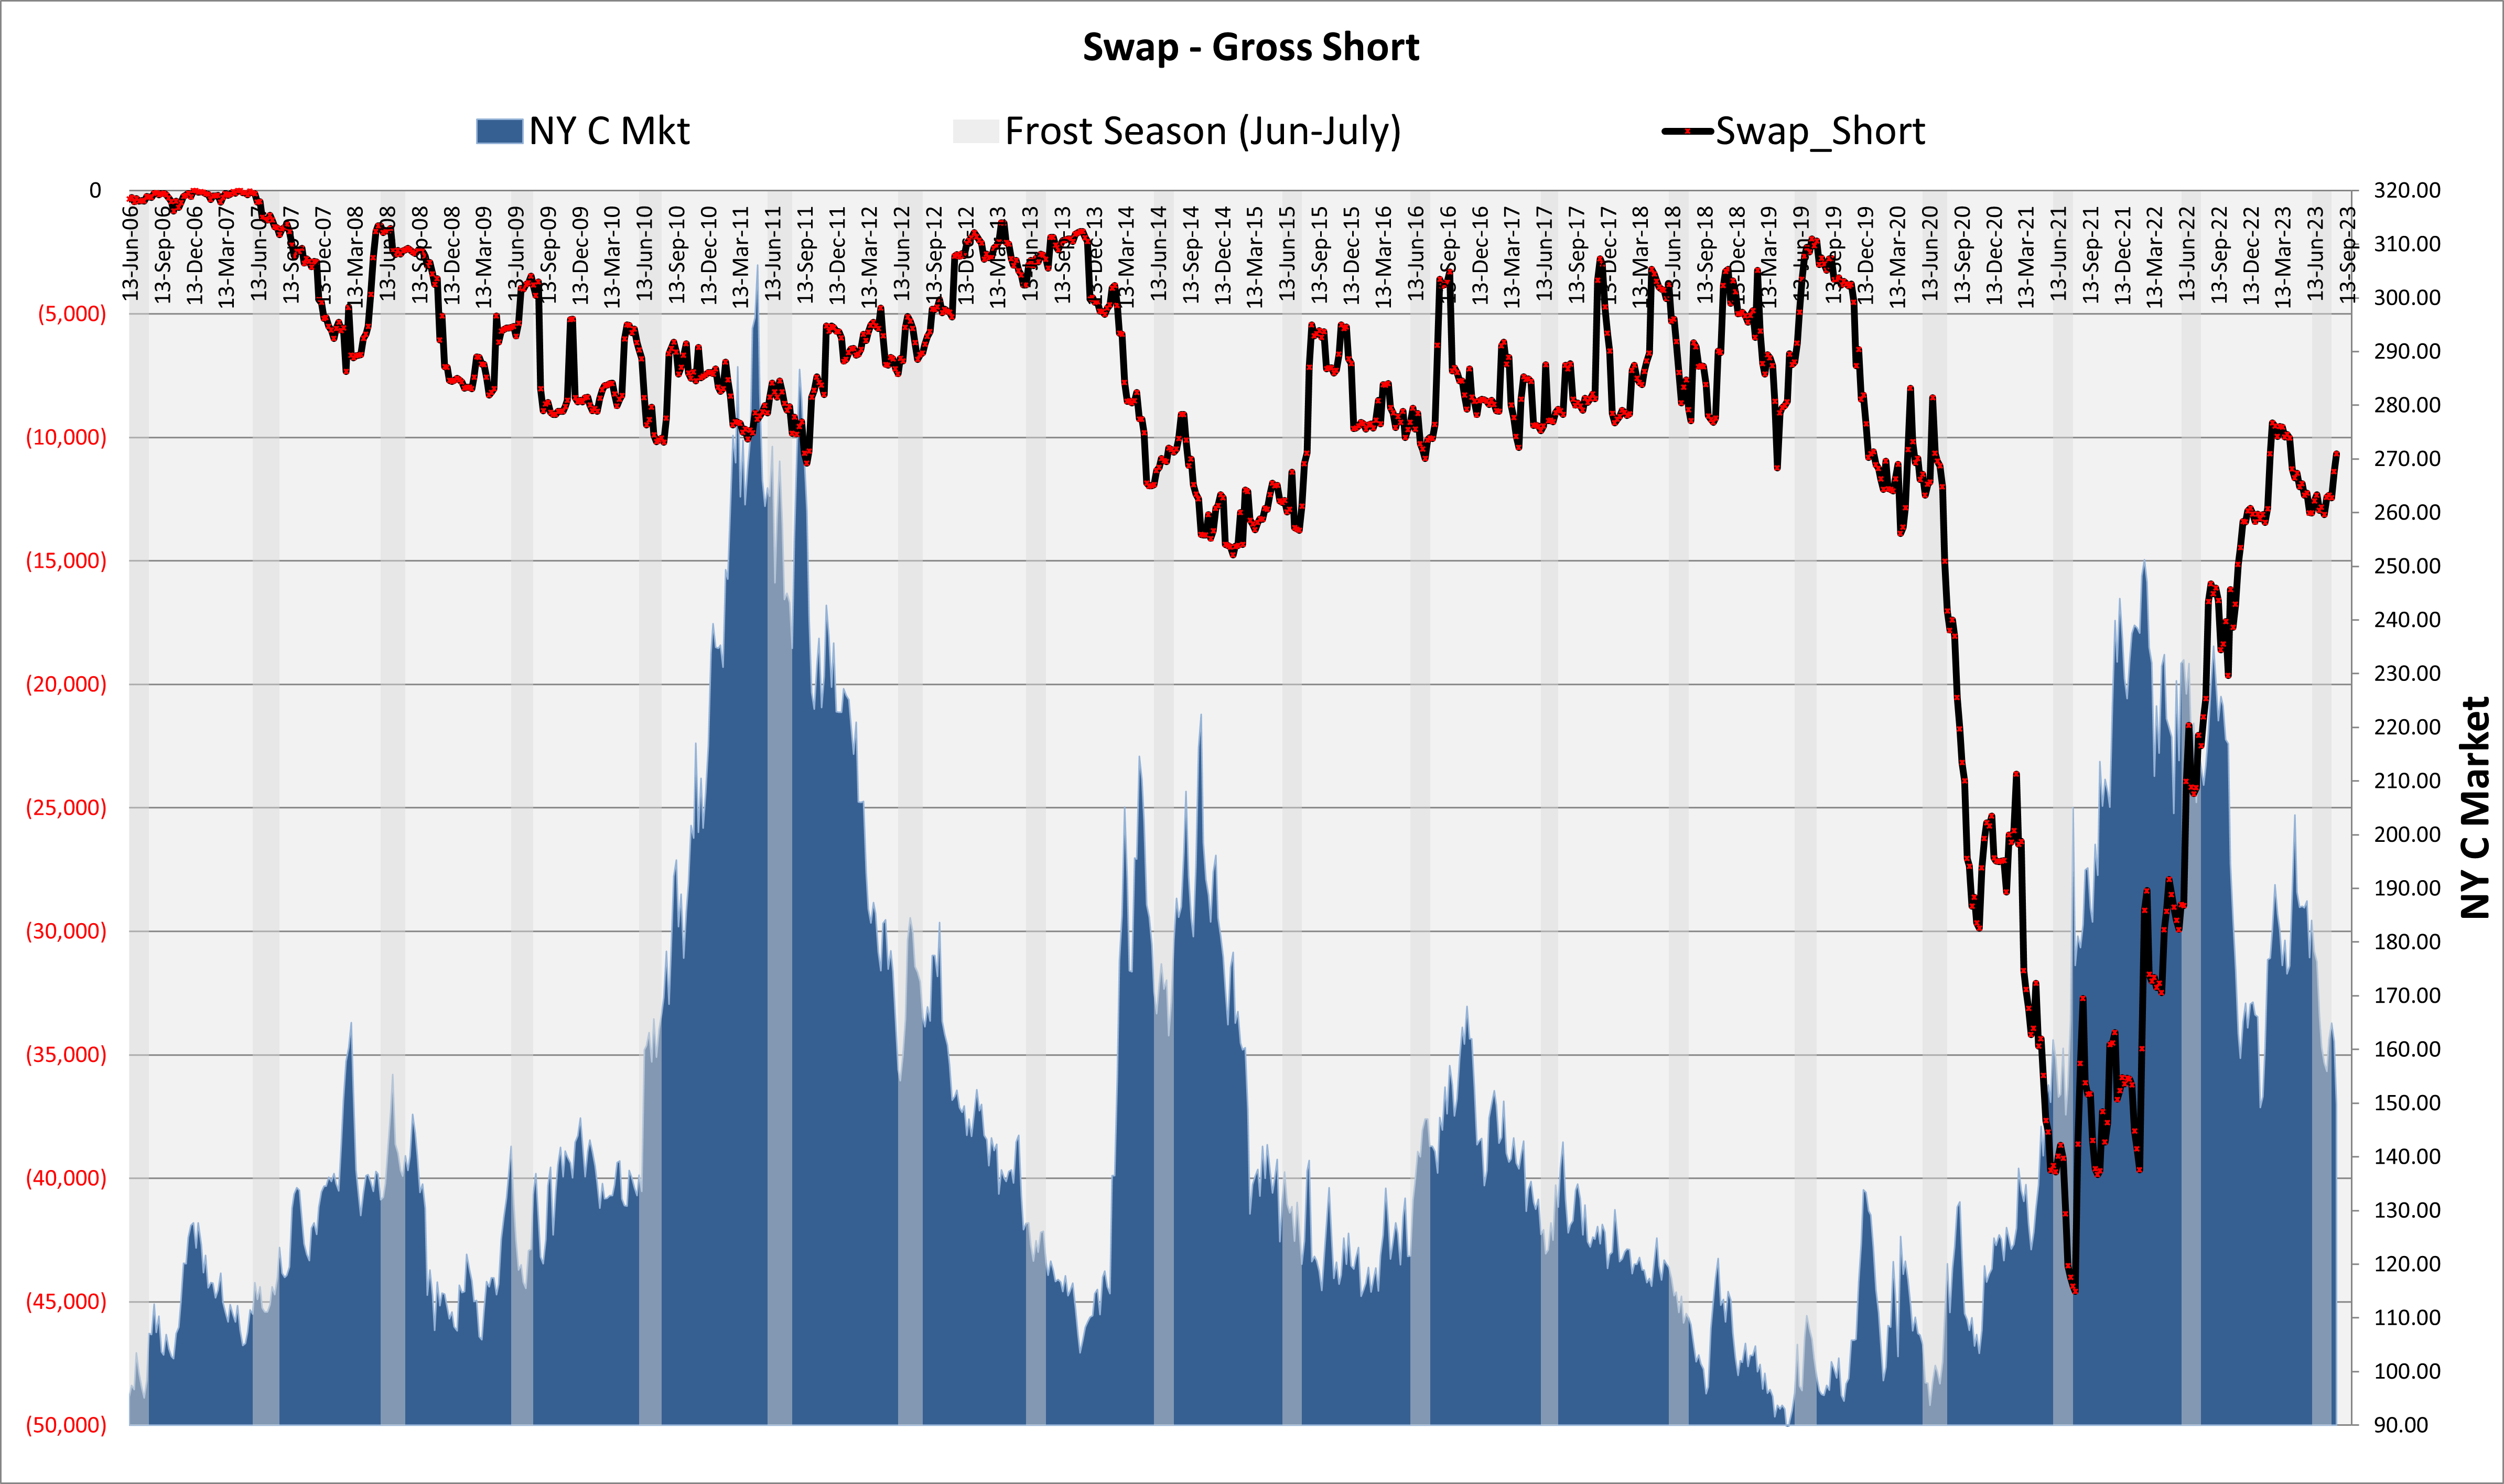
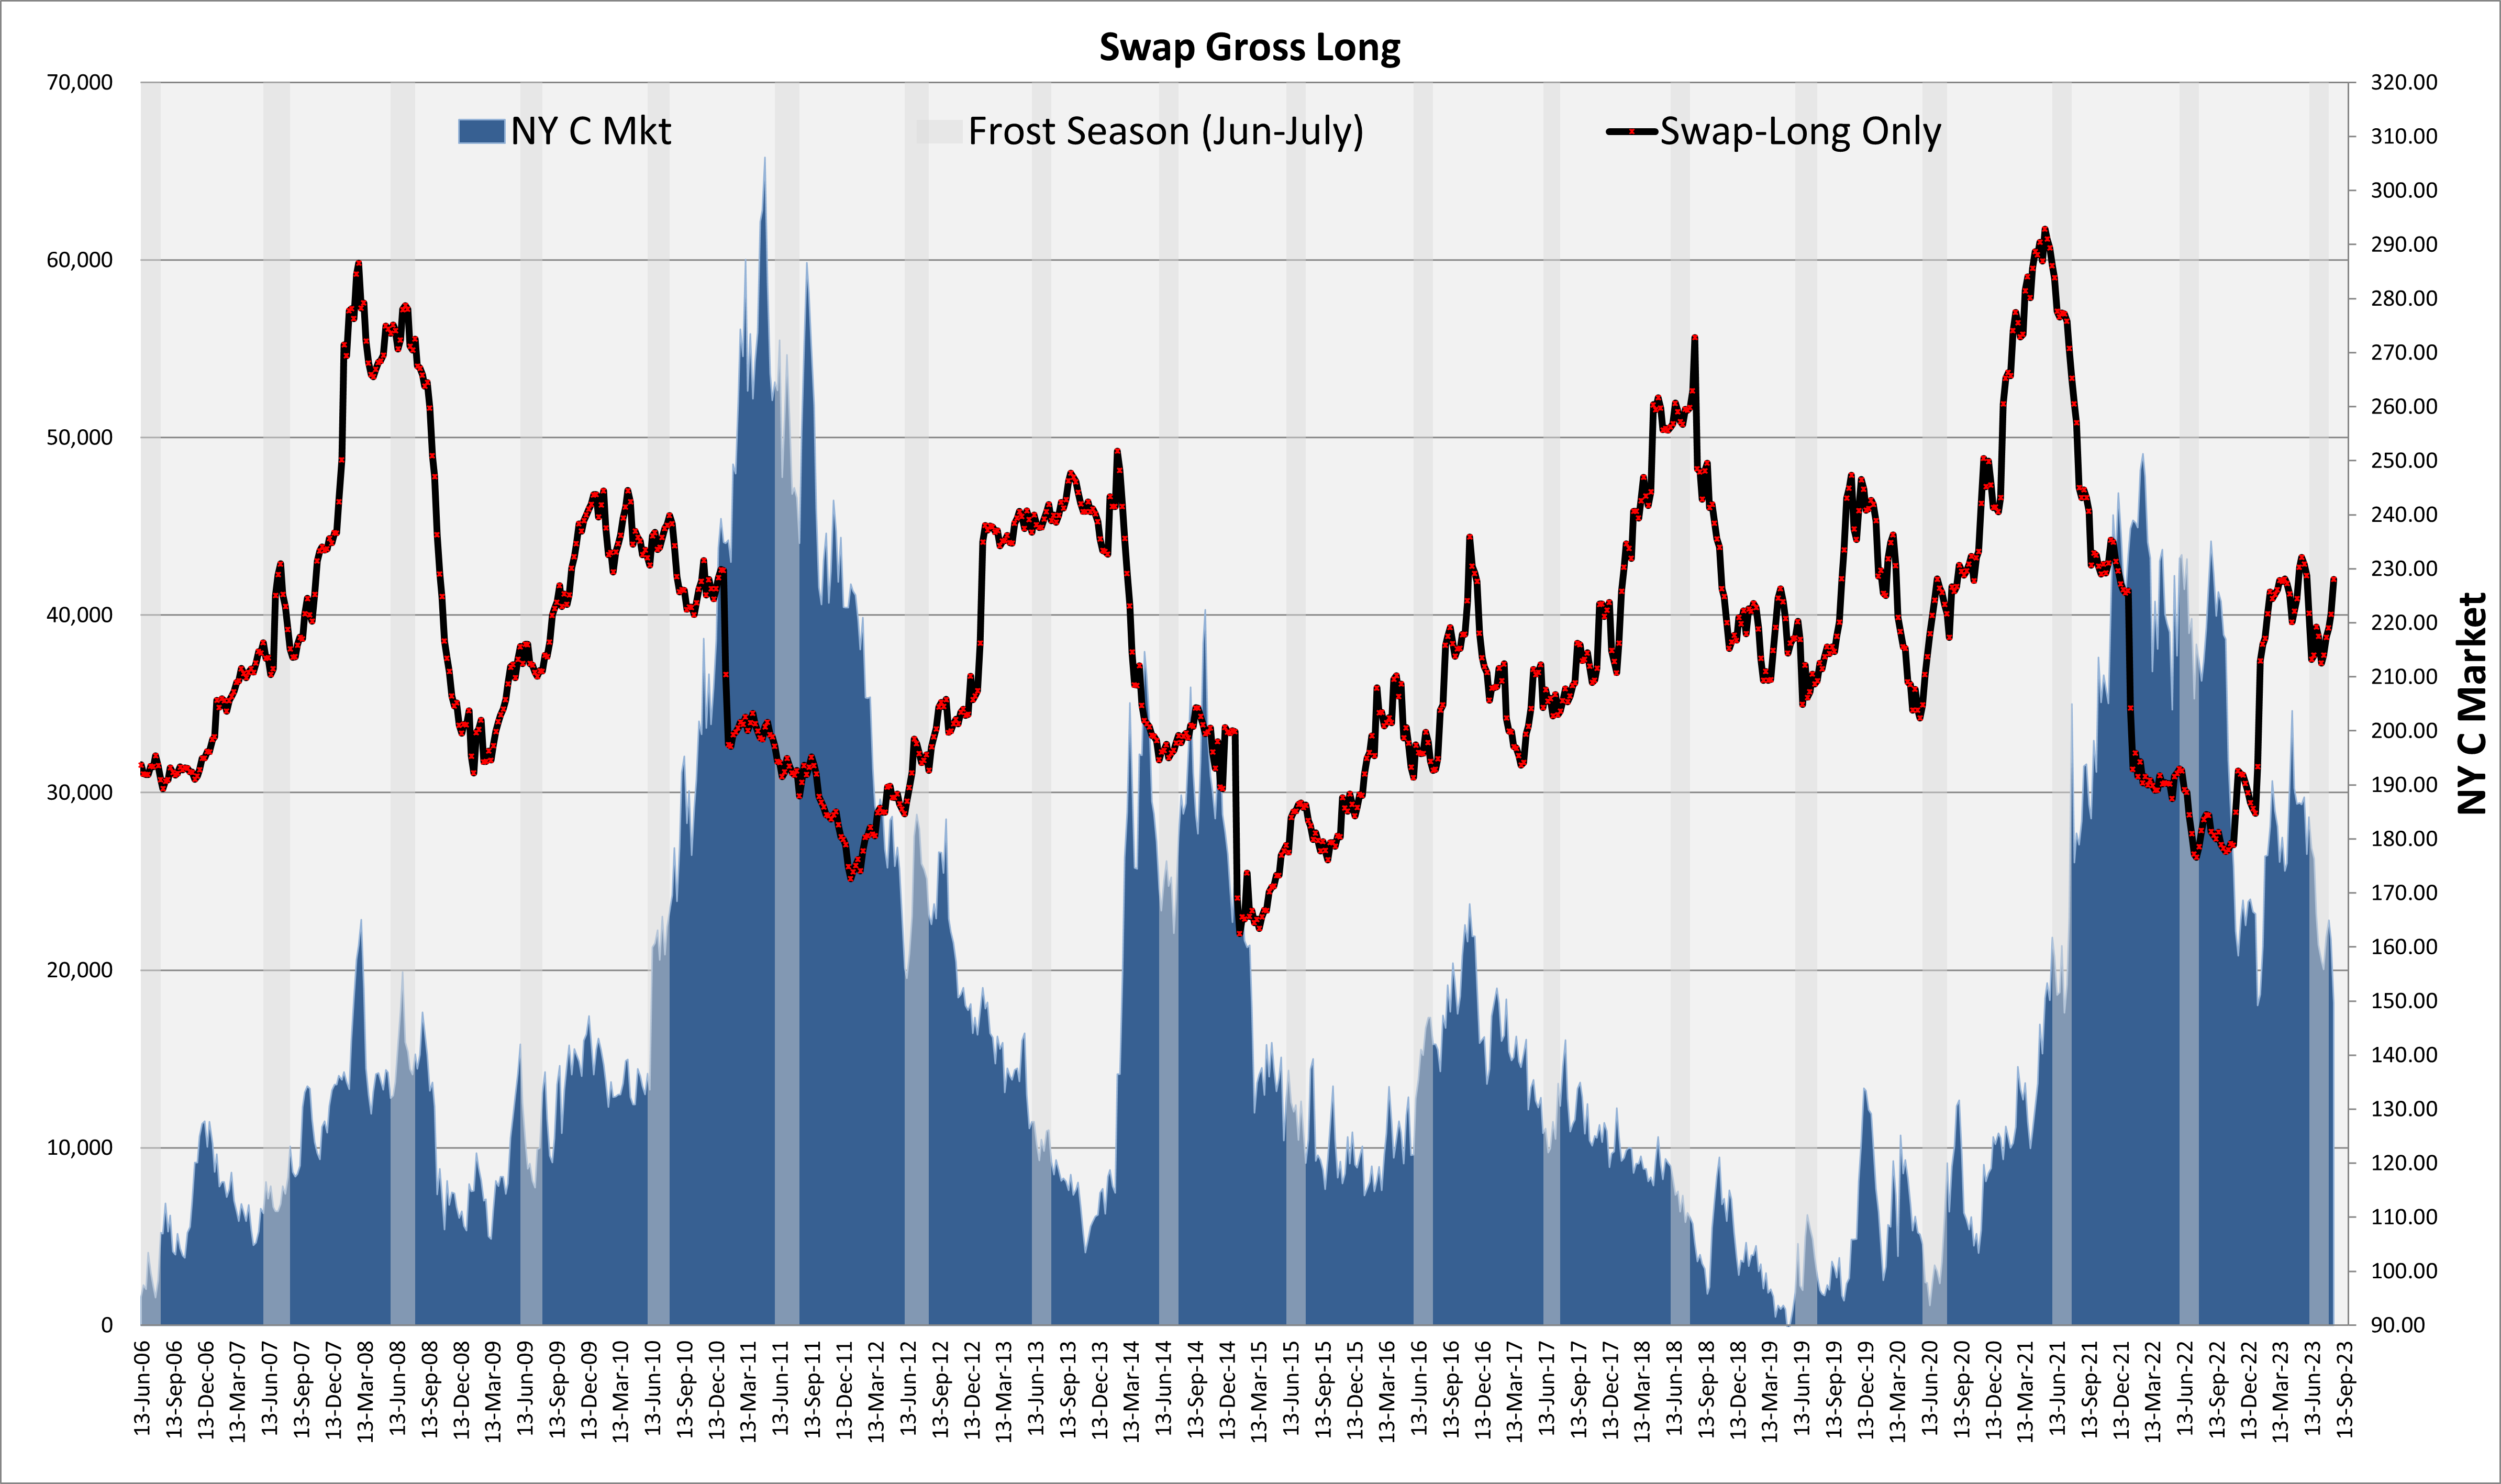
Swap
- Swap Gross Short is finally normalizing and returning to historical short levels.
- I would expect this category to provide support should the market drop.
Dumb Money
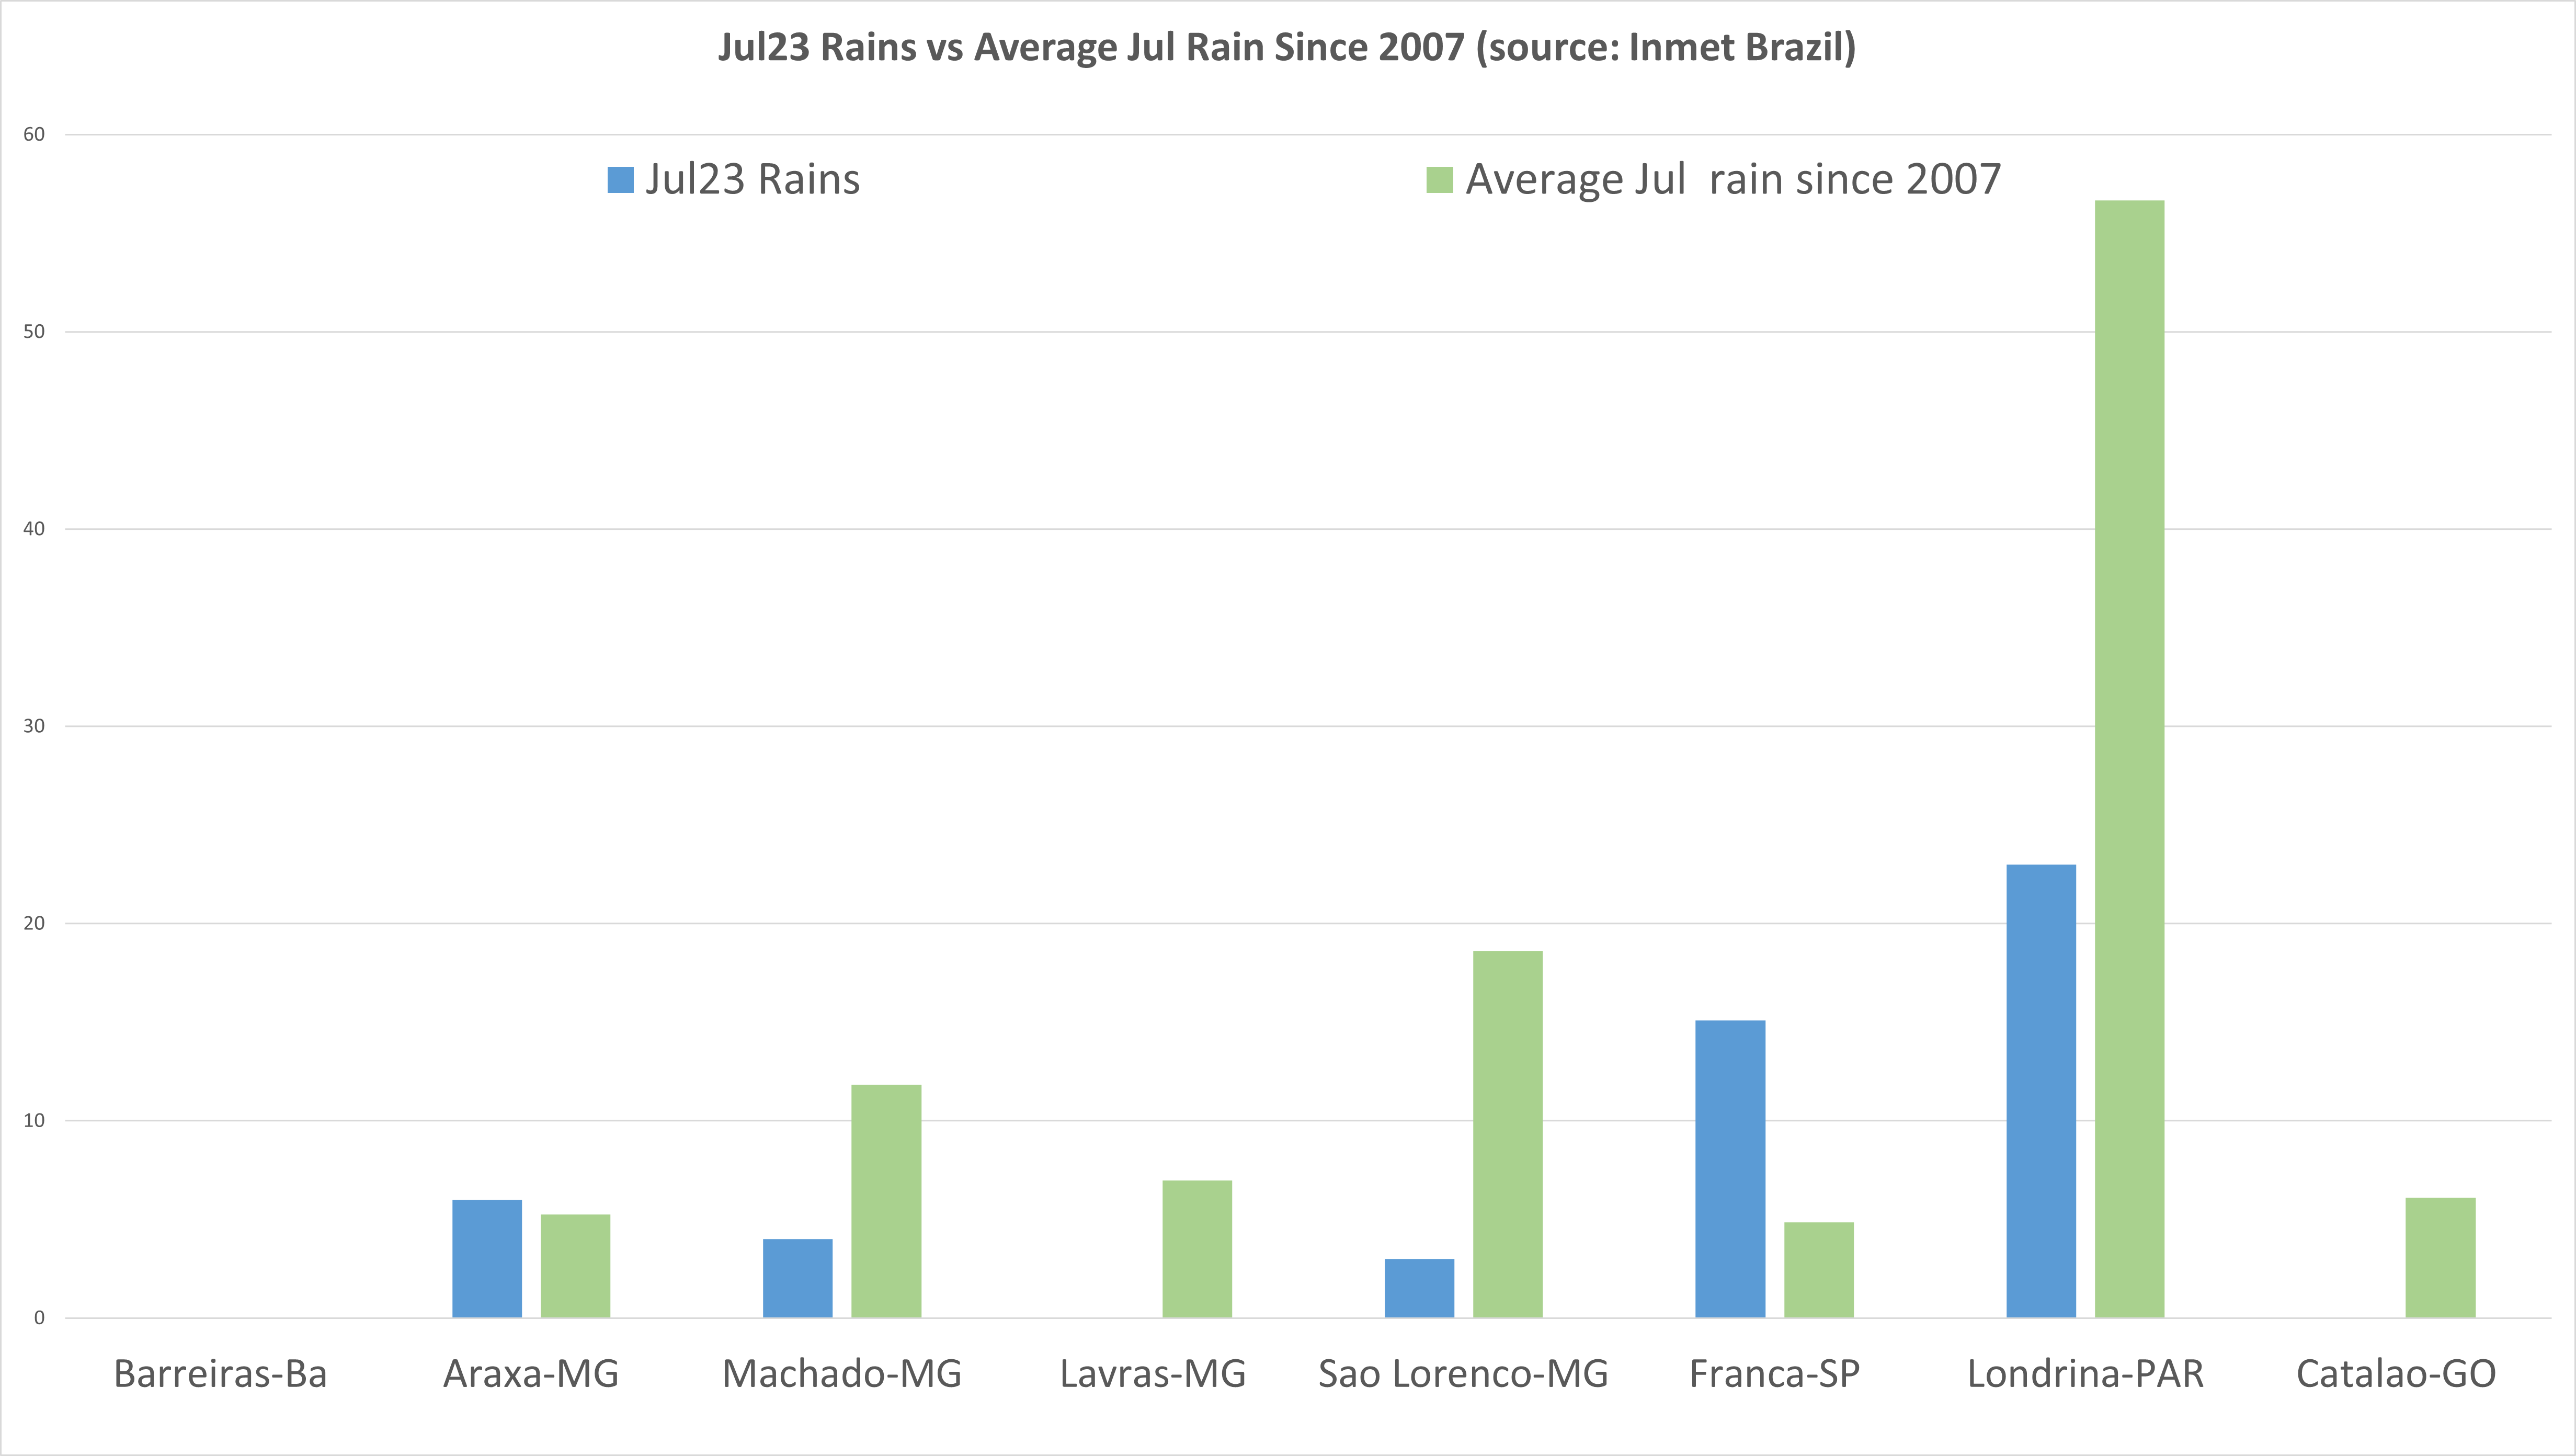
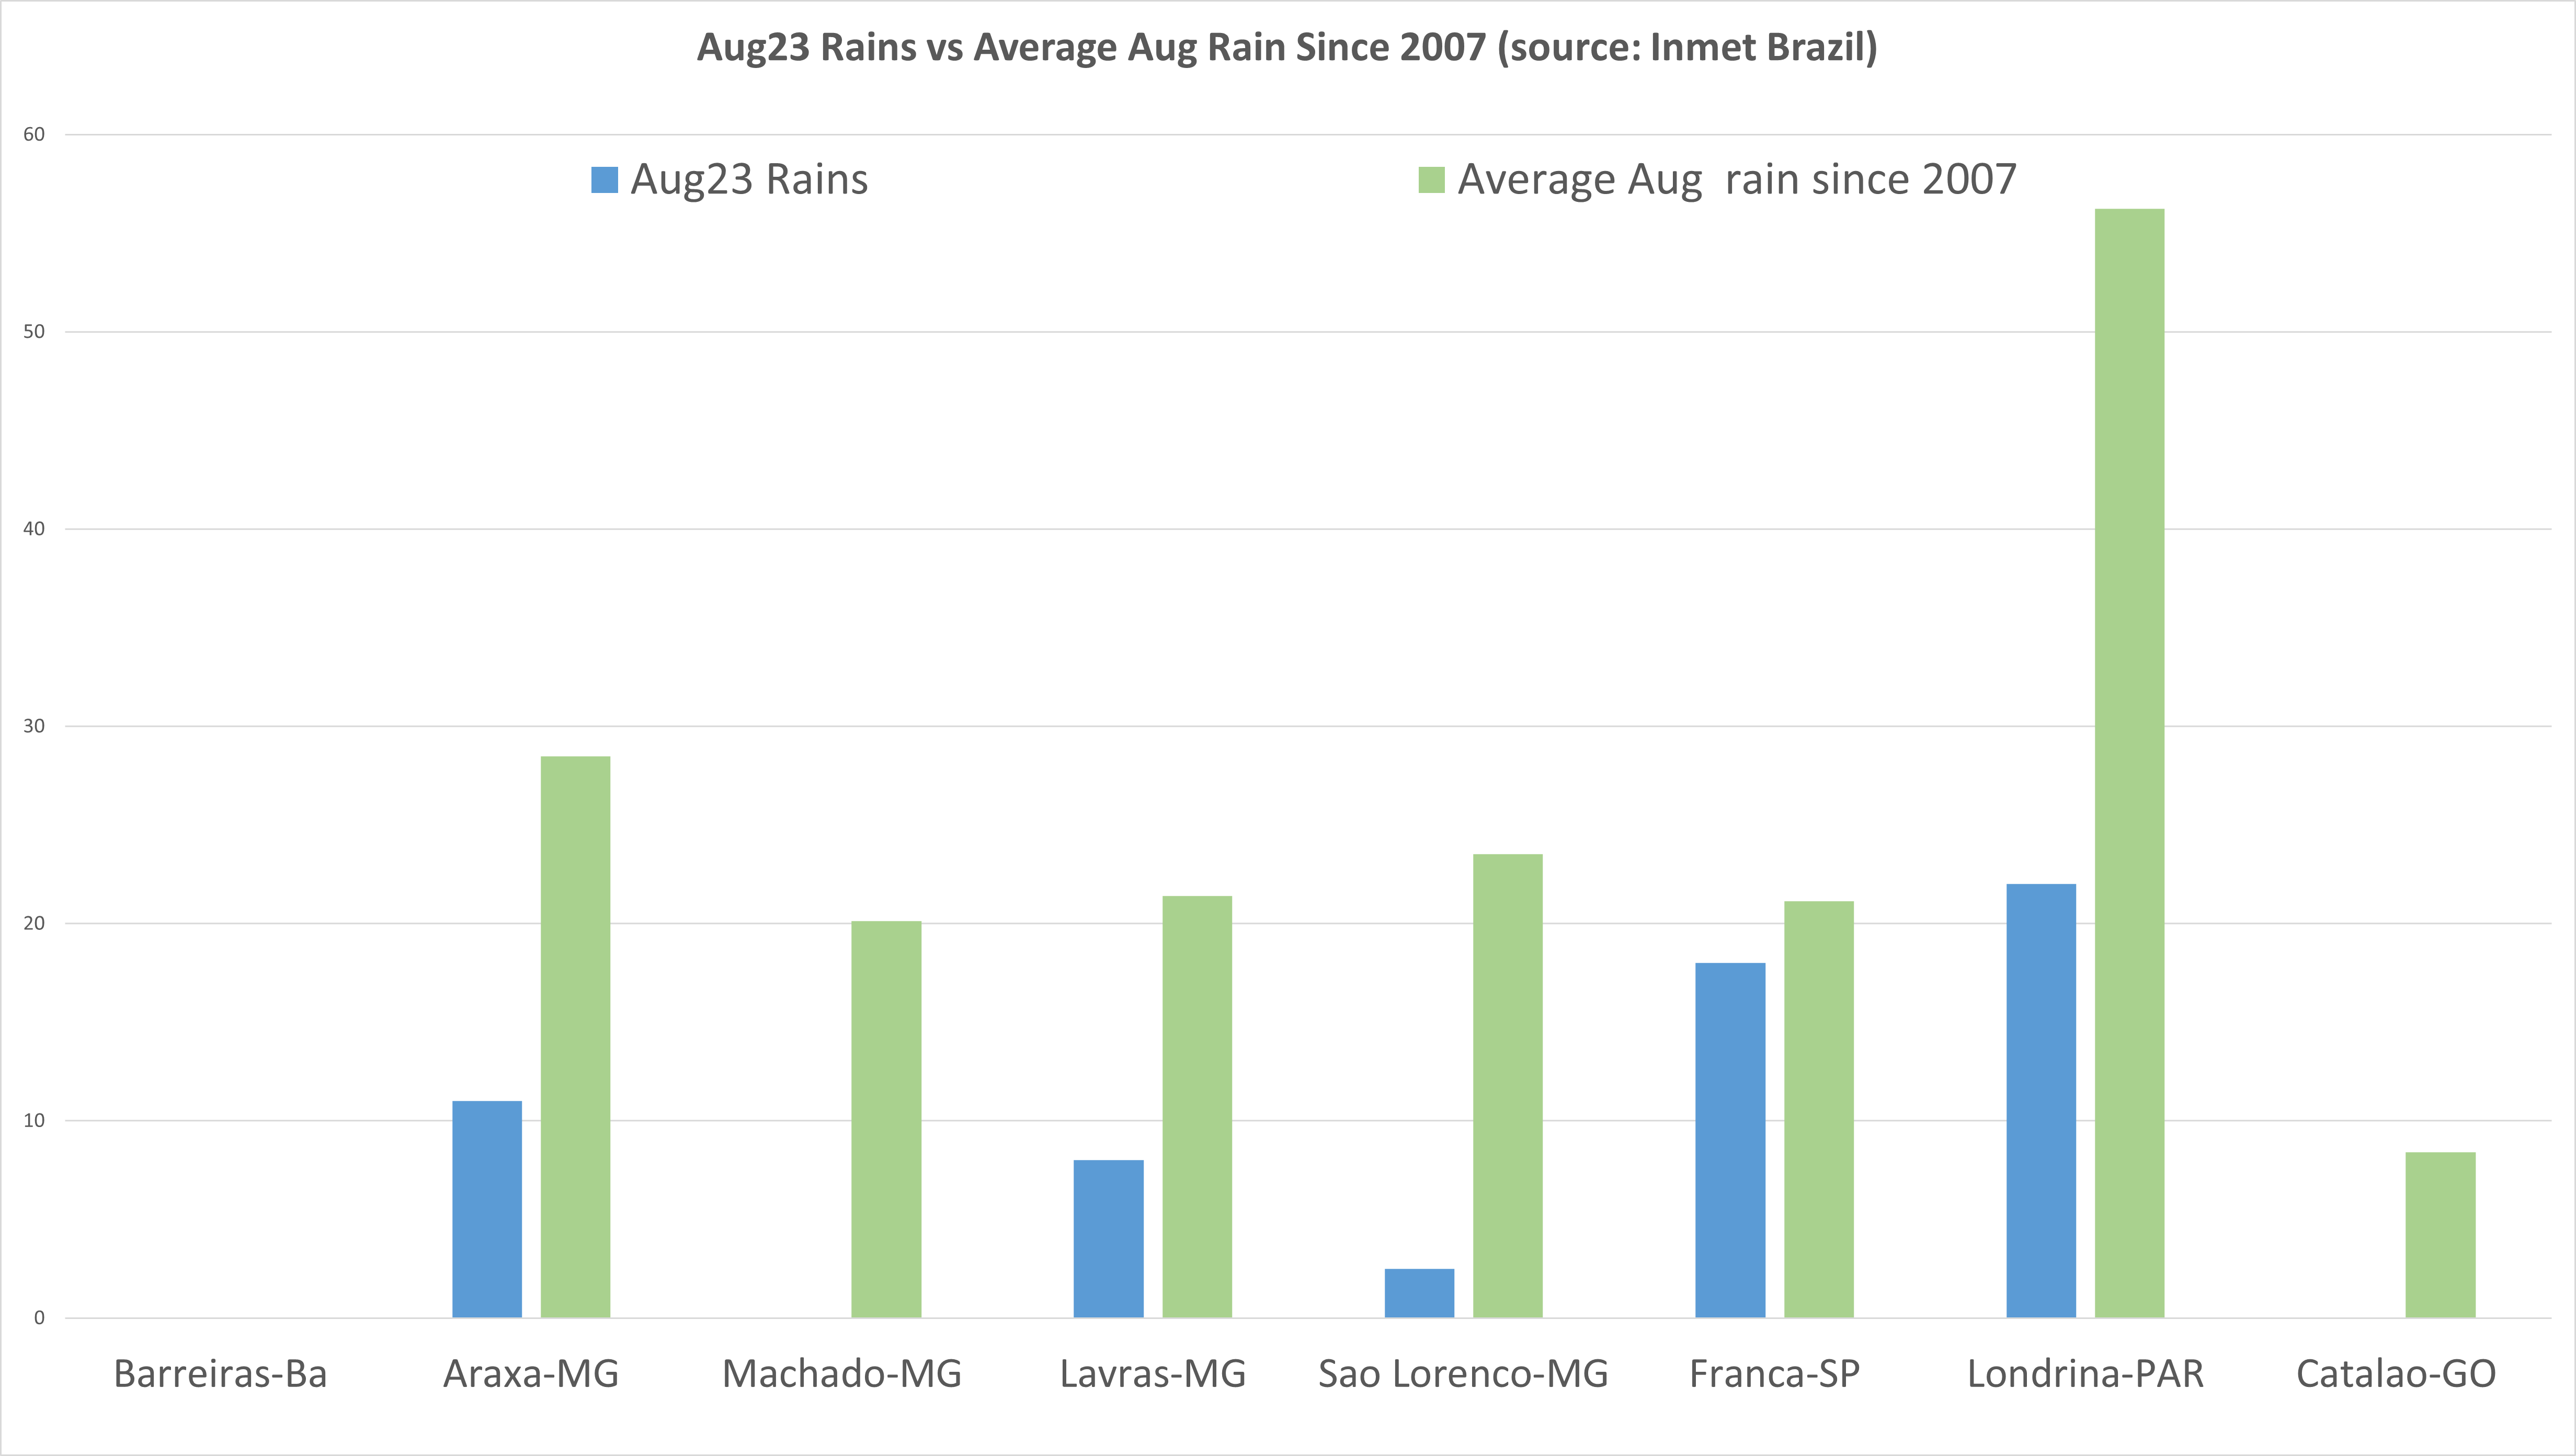
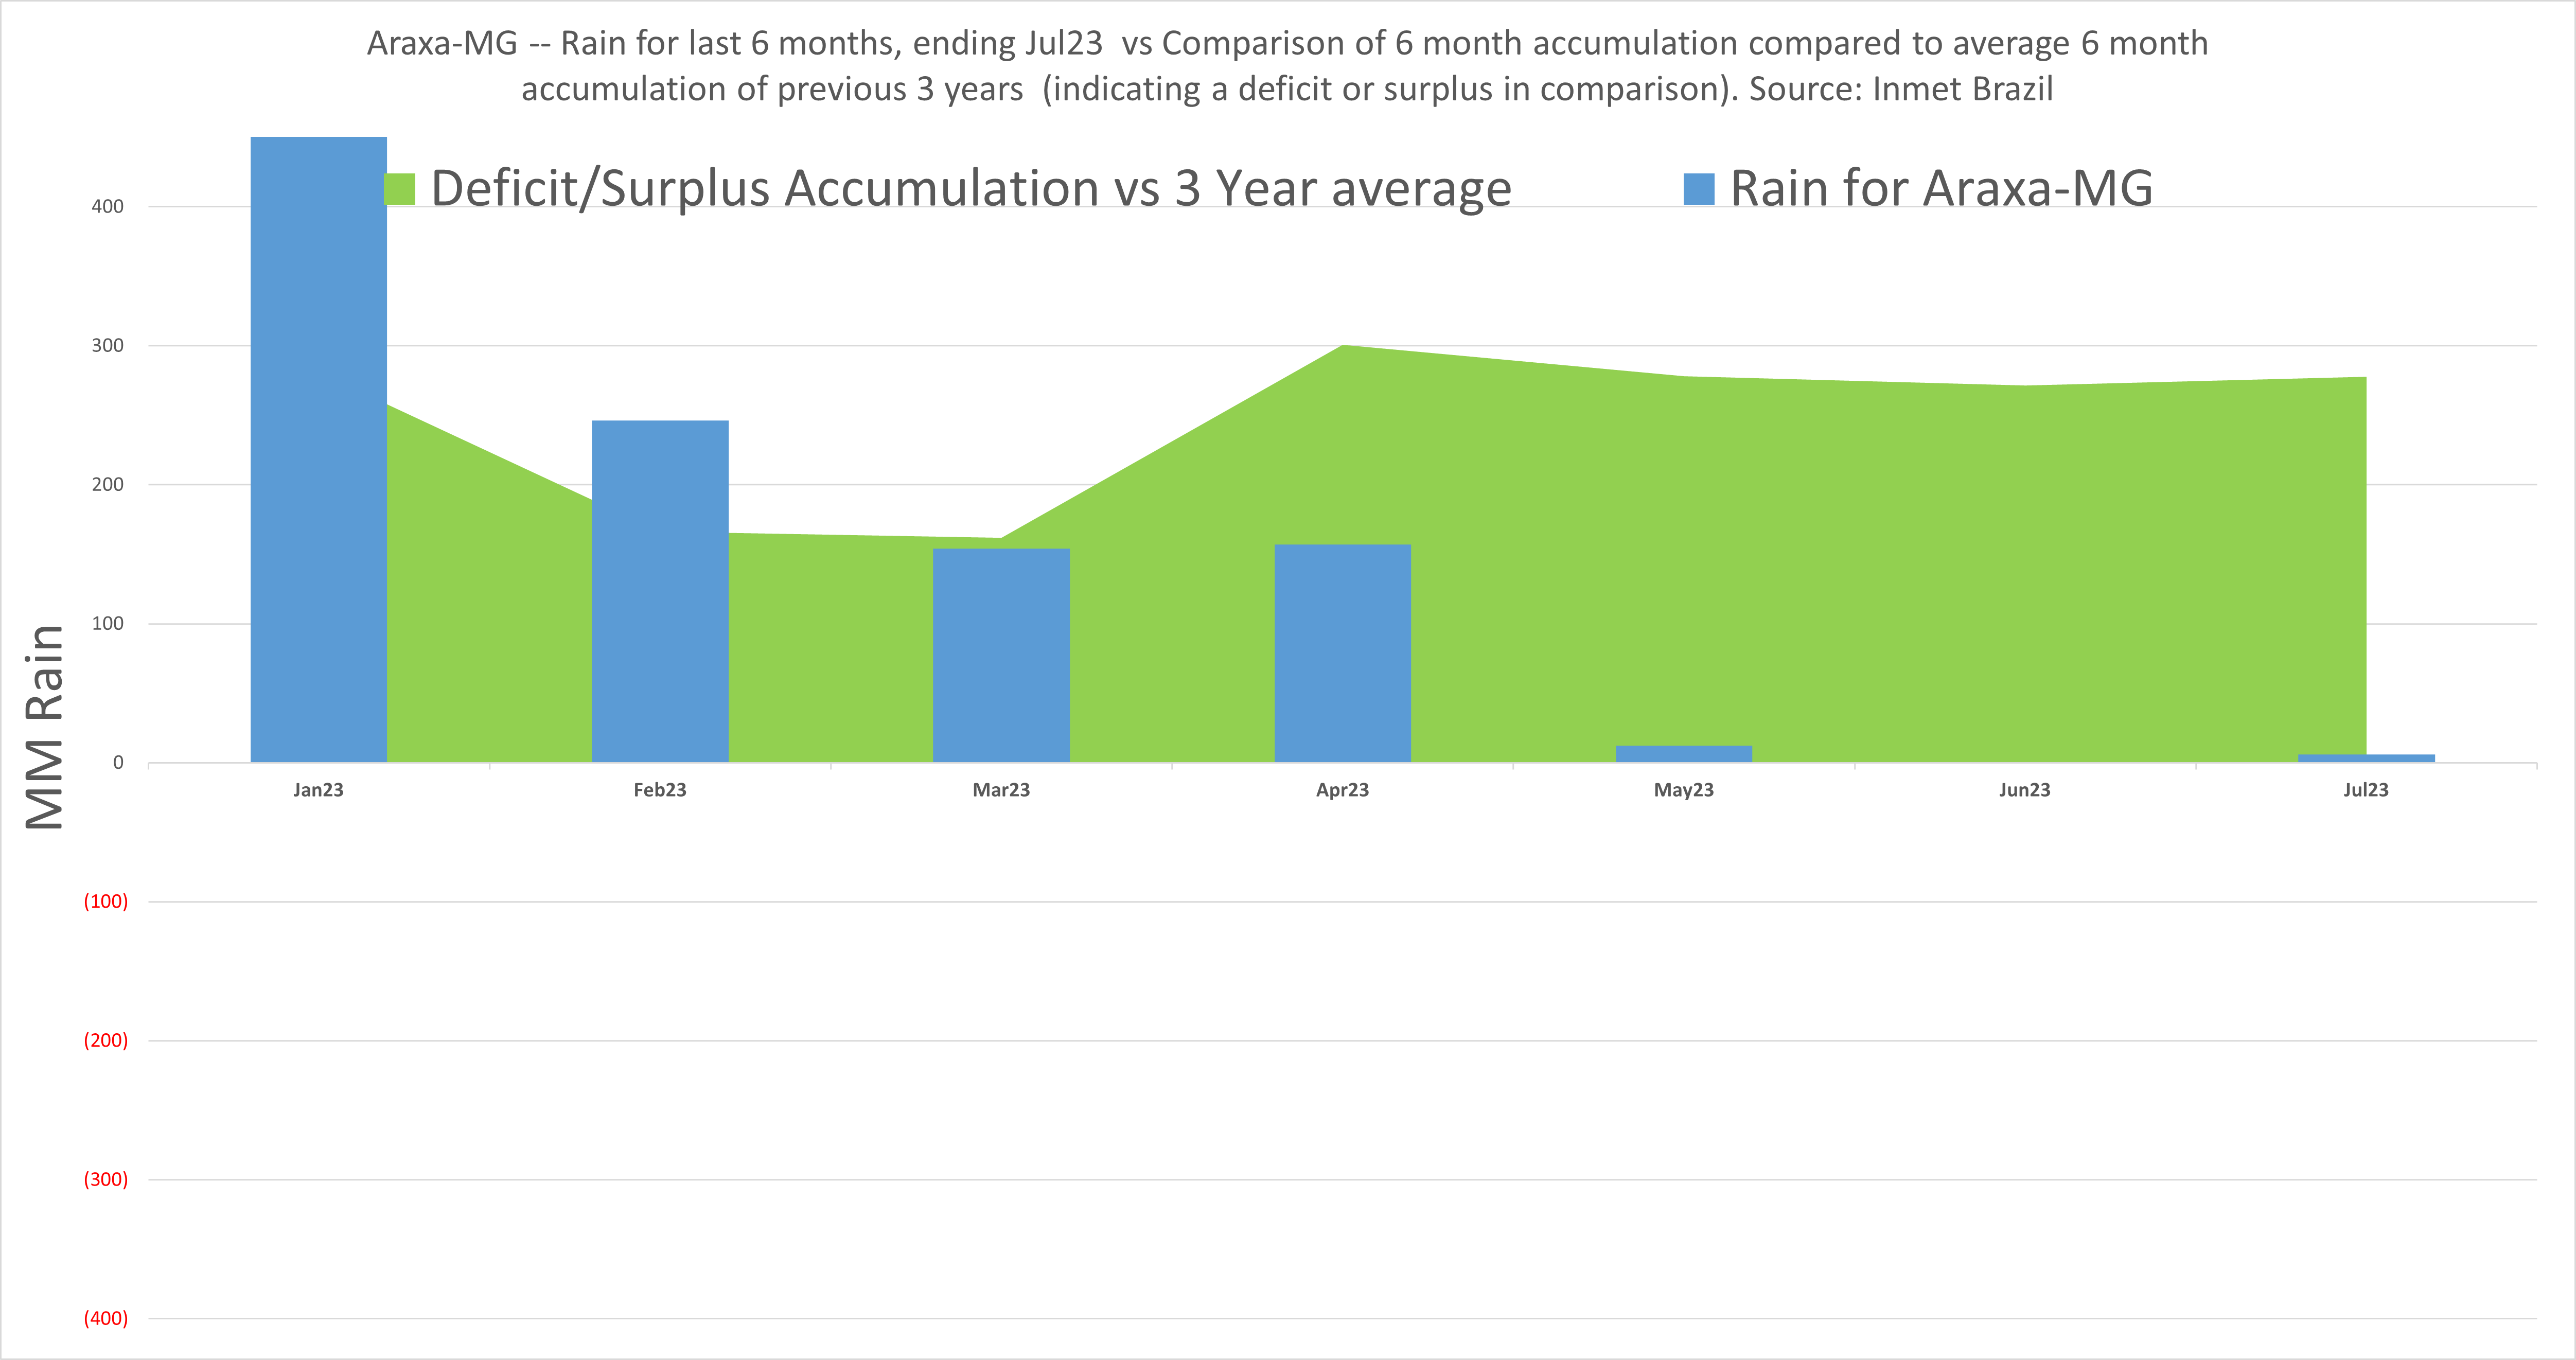
Brazil Rain
- Biggest concern is the rain forecast at the end of the month. Should this initiate flowering this would occur in a historically dry period for Brazil and may result in aborted flowers. Bears watching (pun intended).
- All in all, rain and moisture levels ought to be good going into what was supposed to be the dry period.
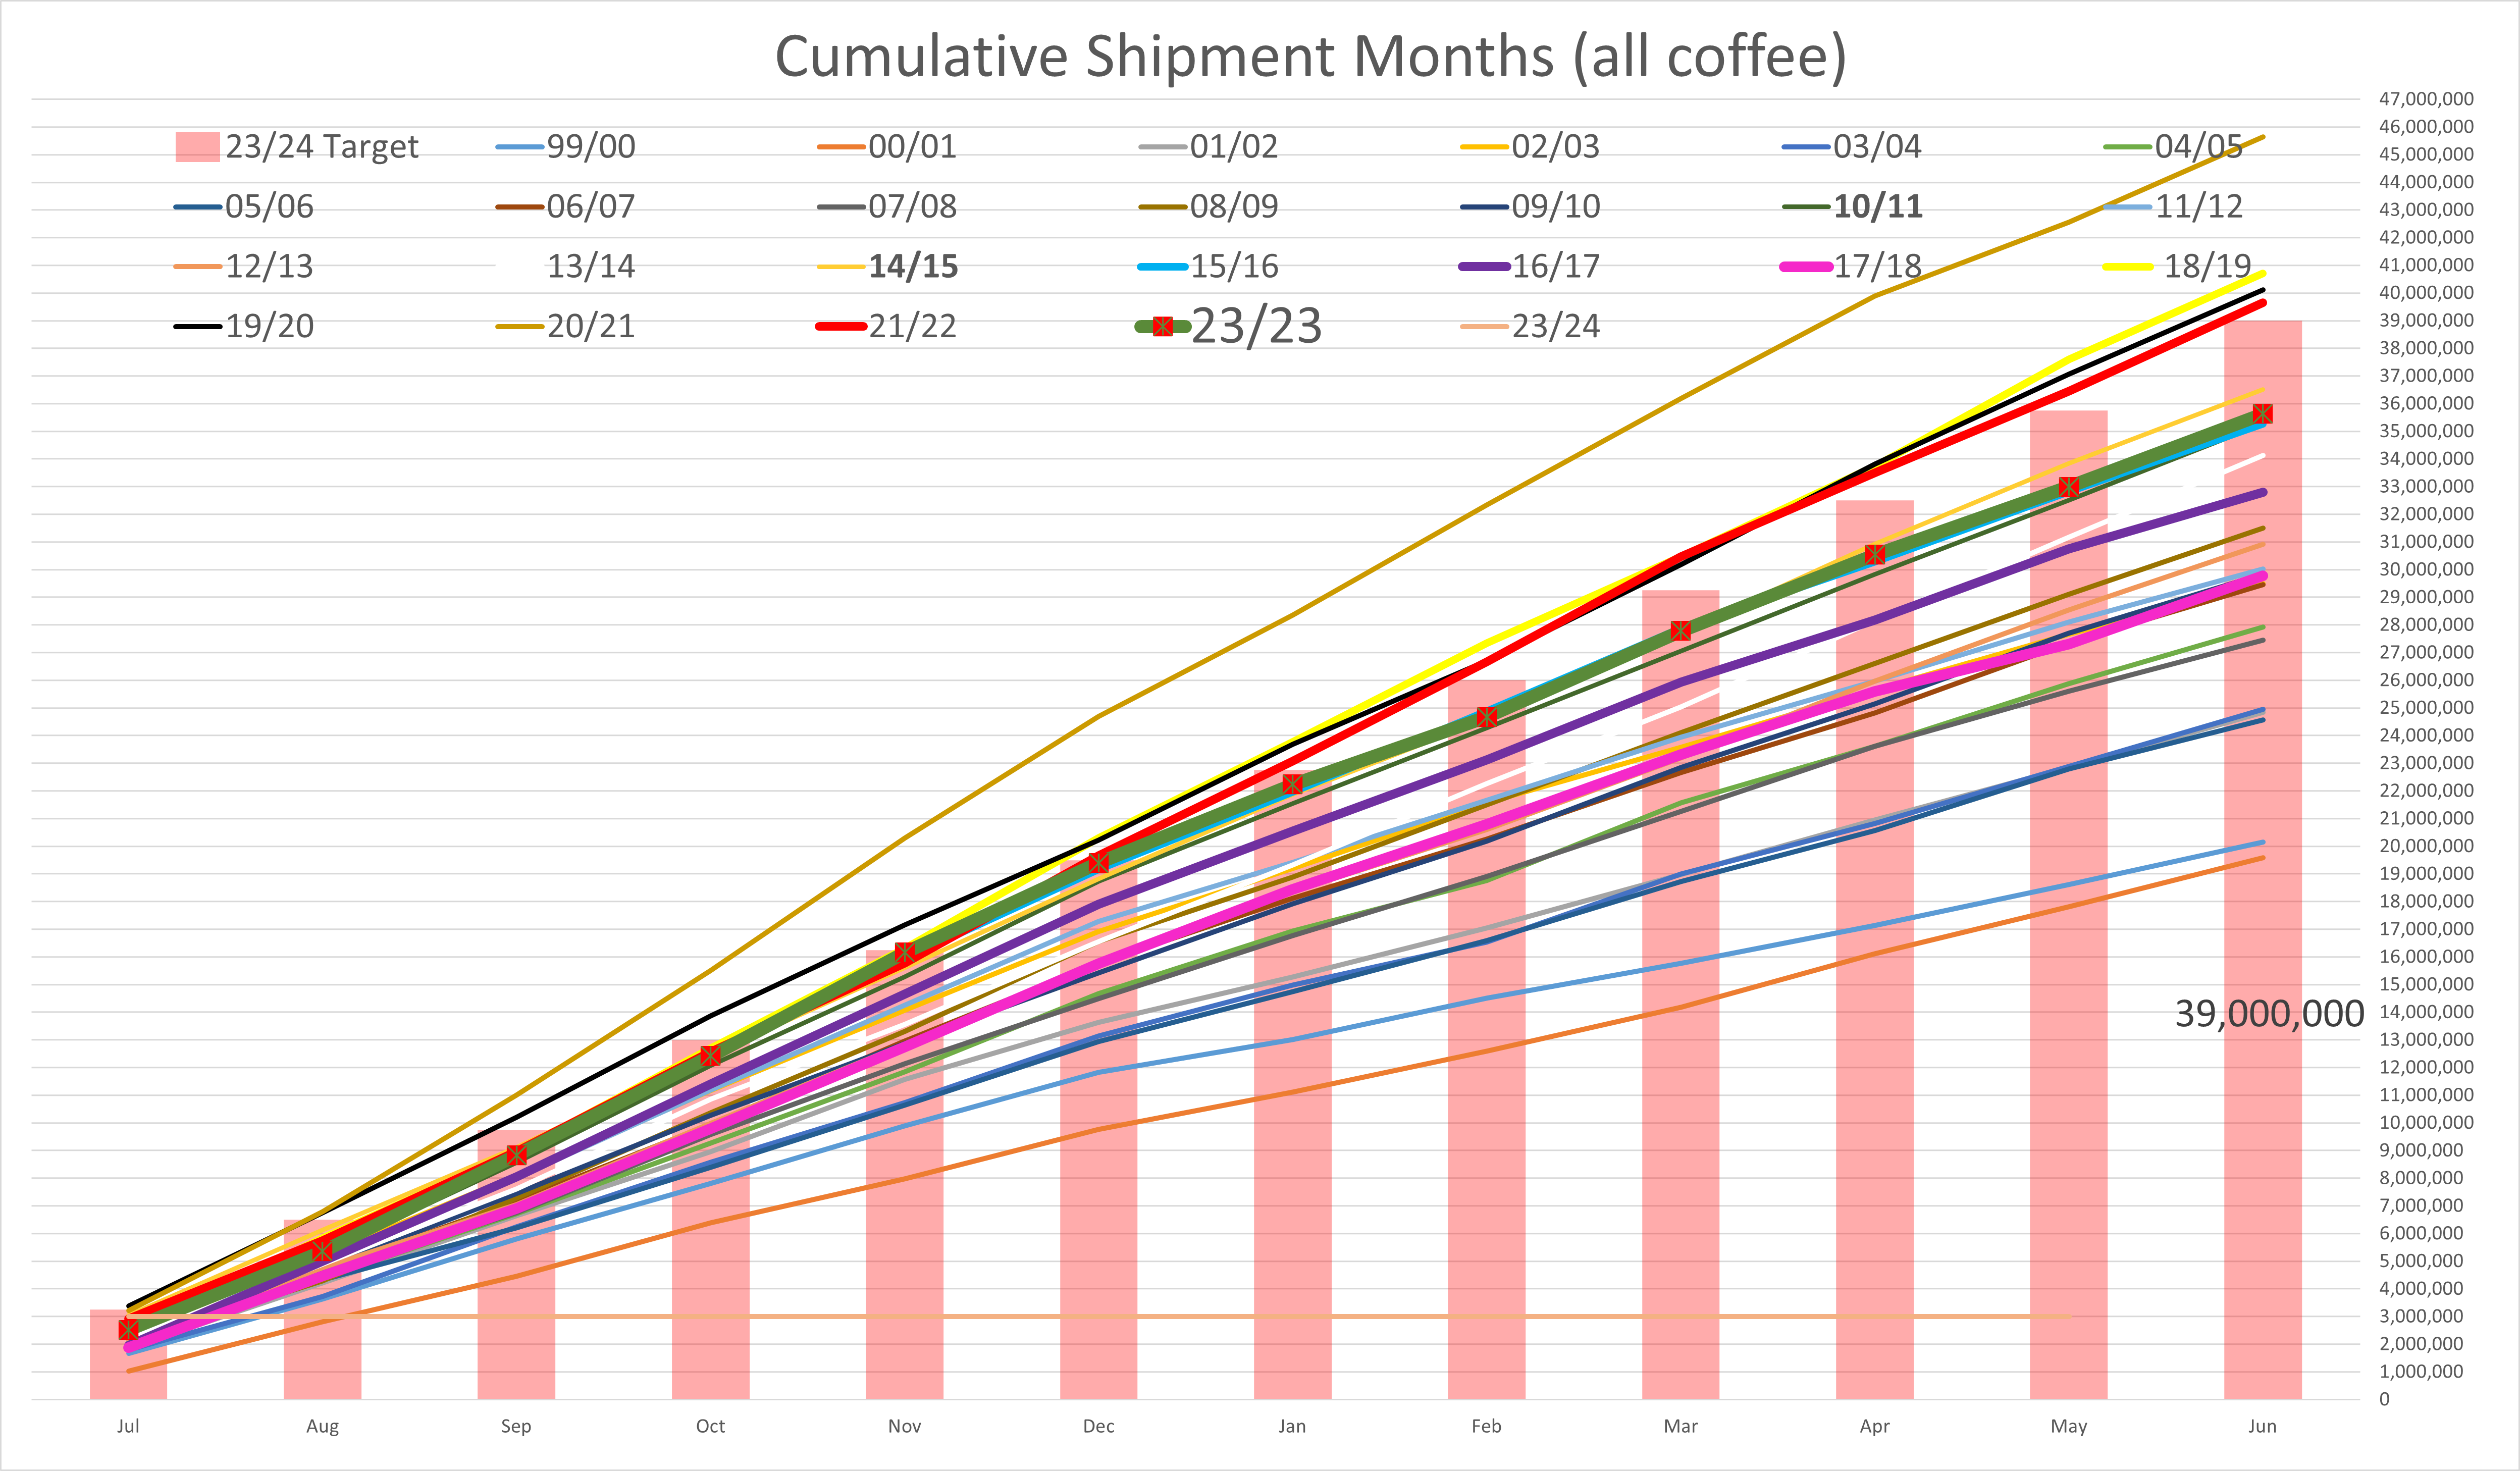
Brazil Export
- Not much to say other than 22/23 hit my original estimates.
- 23/24 will obviously be much larger.
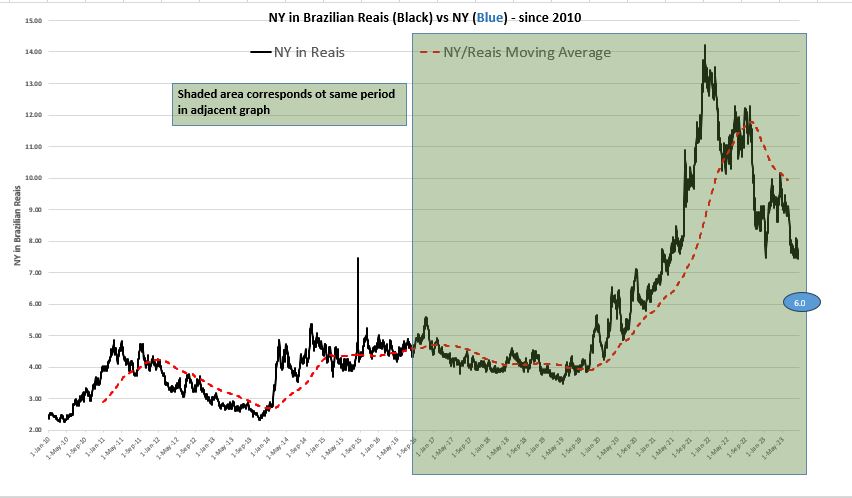
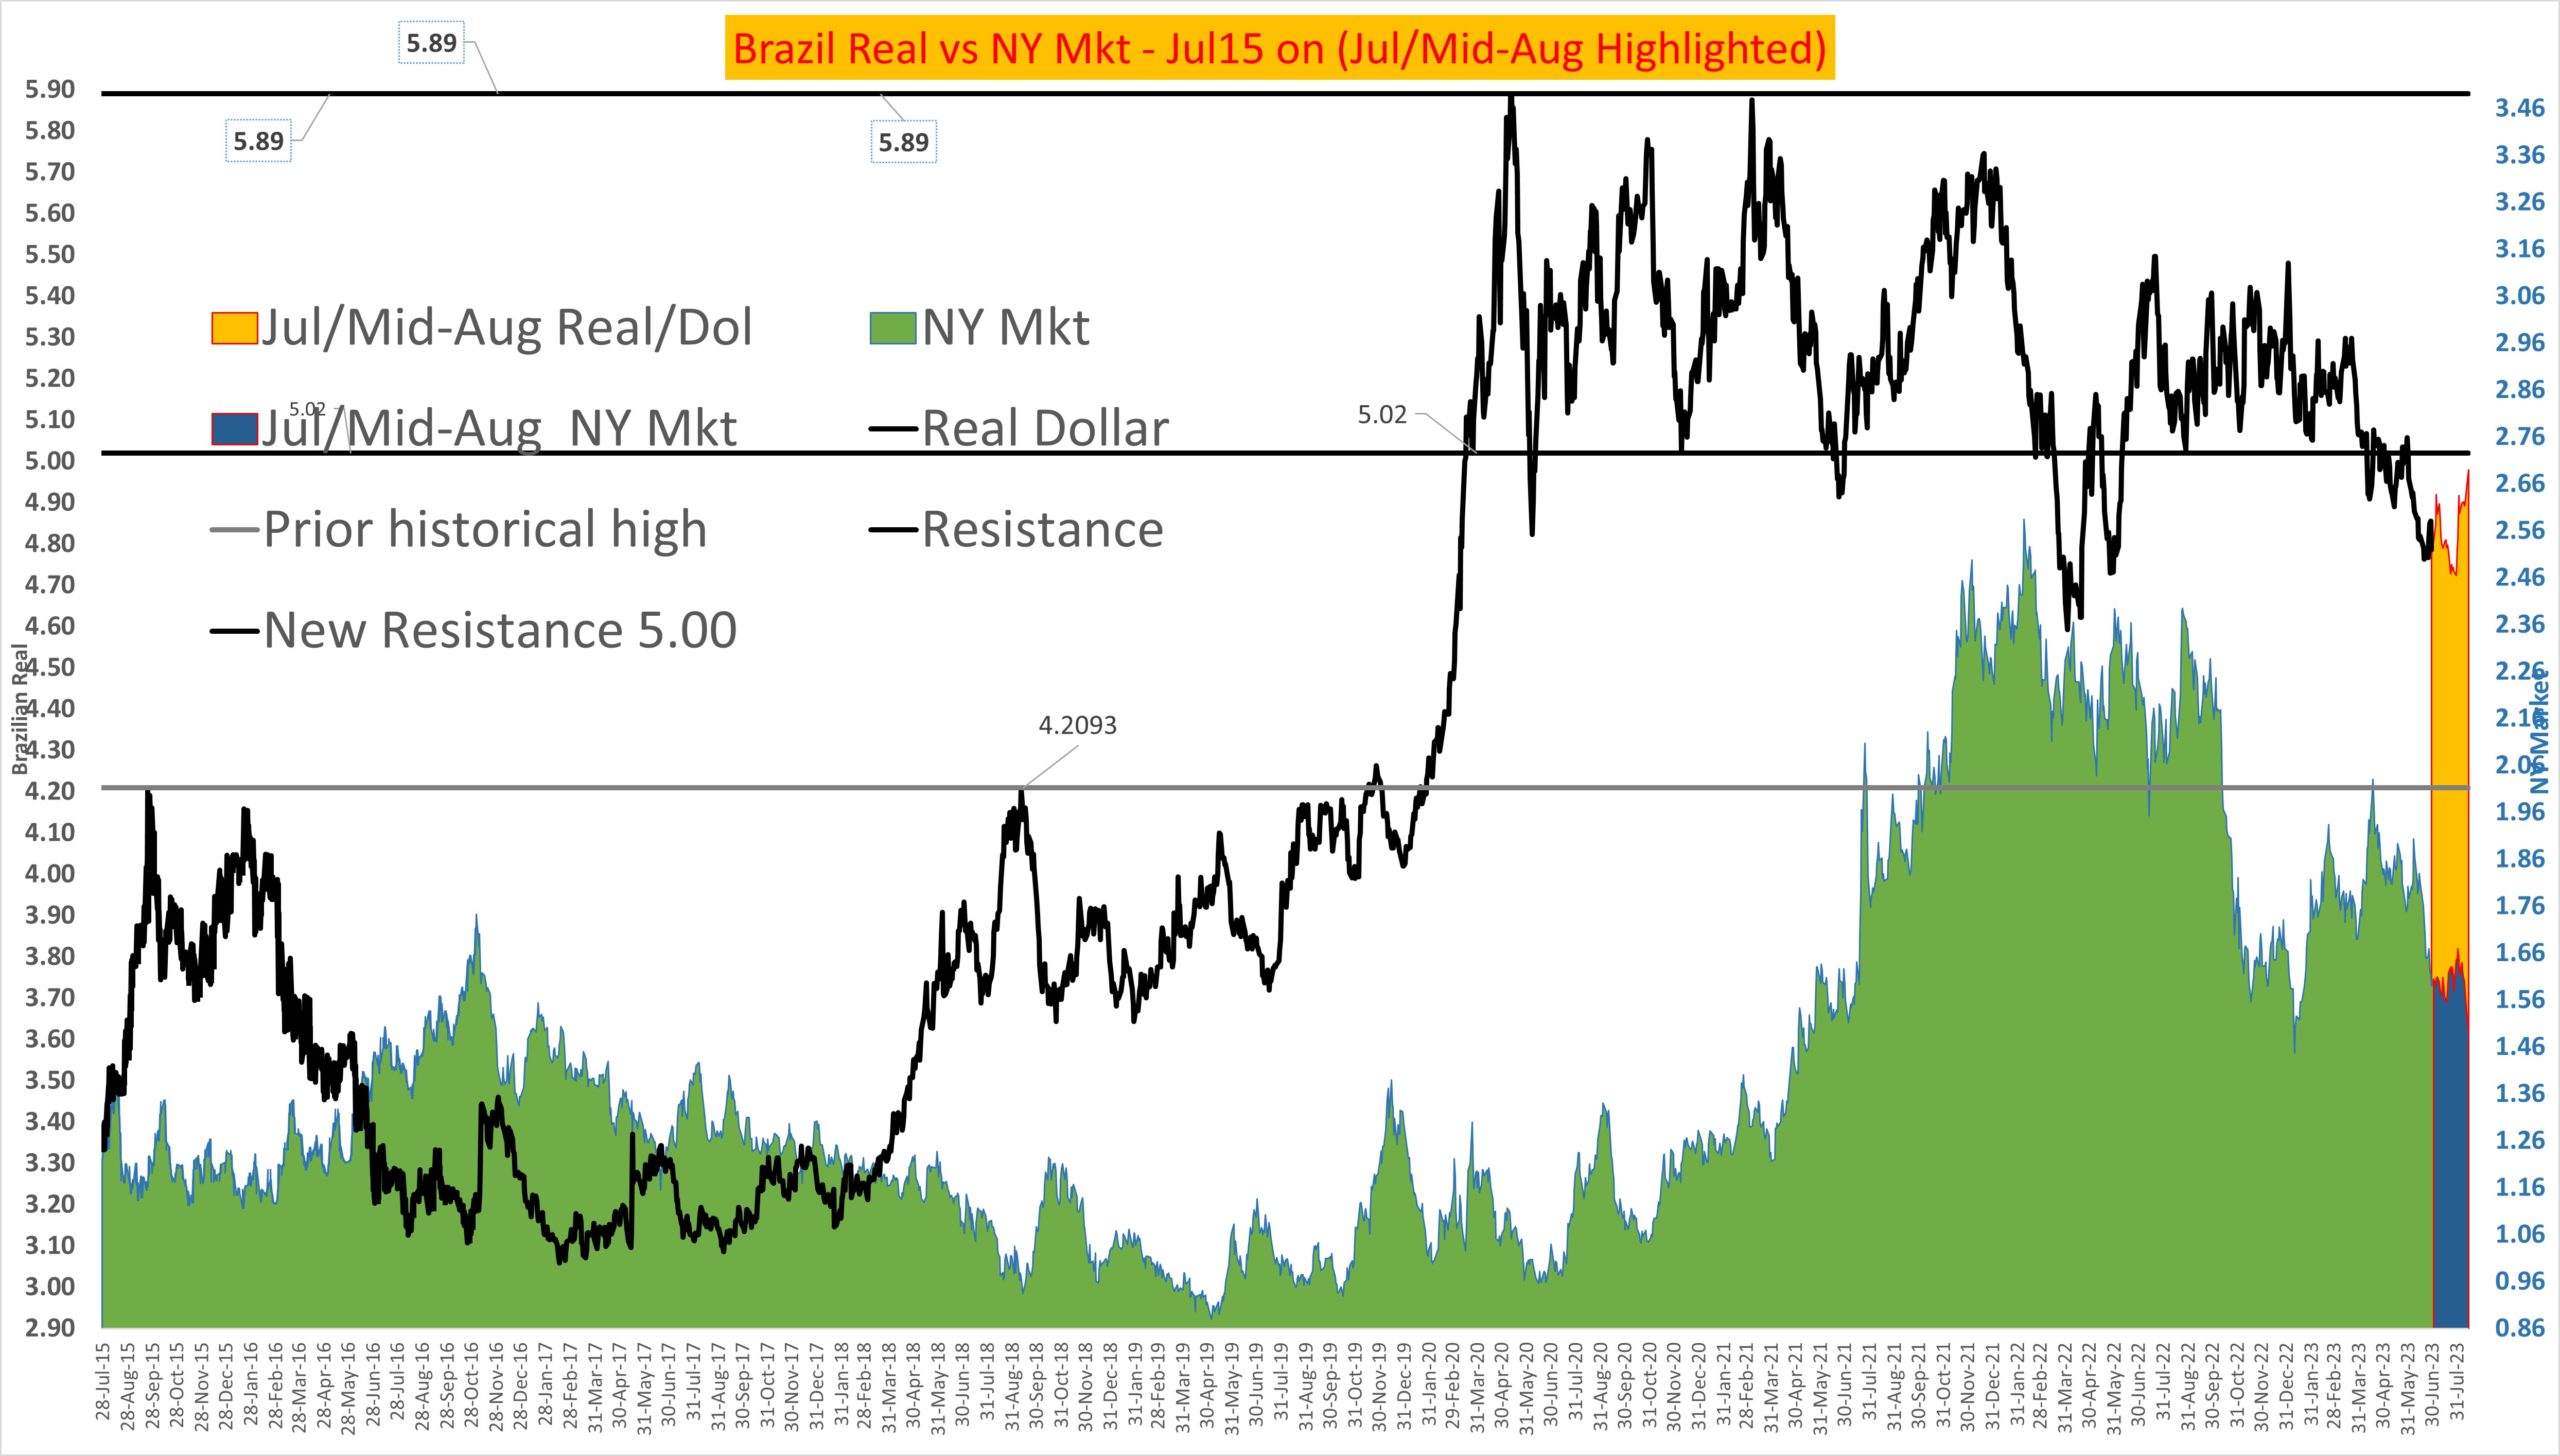
Brazilian Real
- The first graph, NY in Reias, is interesting. This trend looks like its projecting to roughly 6.0 Reais/lb. Assuming Real goes to roughly 4.5, then that would imply a 1.35 market. Very speculative, but interesting none the less. That is only a 5 or 6 % appreciation by Real. I also do expect the dollar to depreciate in general.
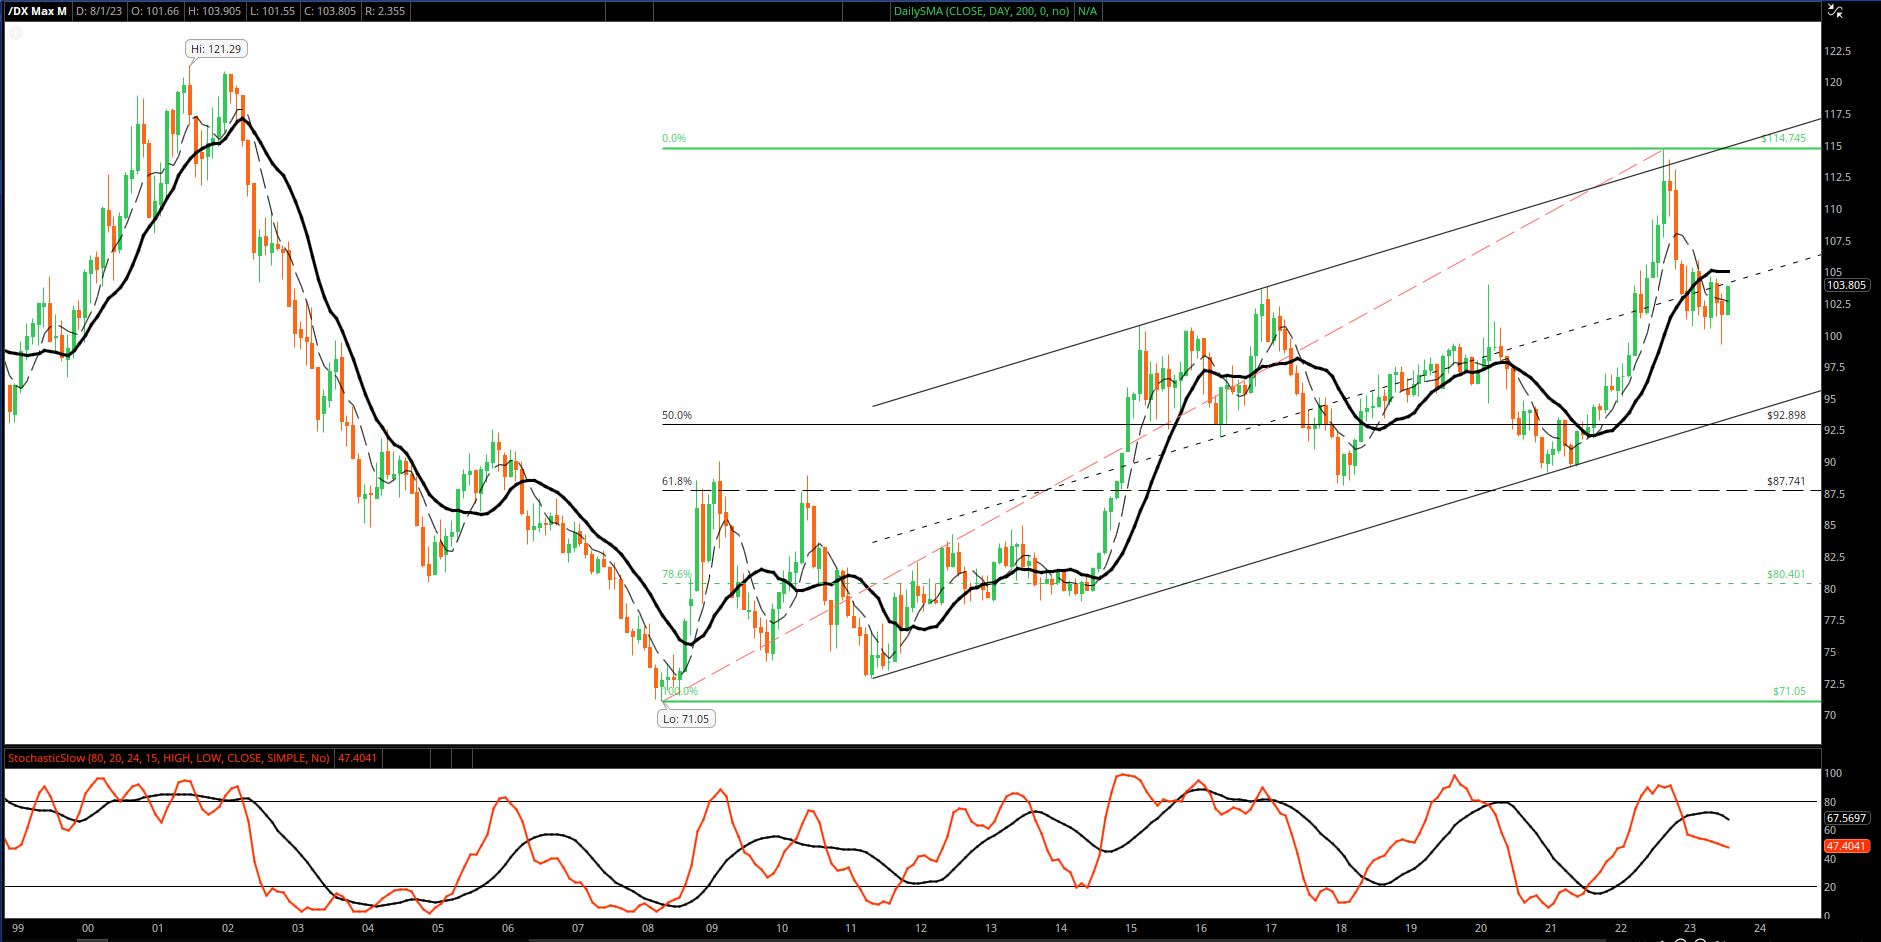
US Dollar
- Dollar seems to be on tract to depreciate further. 5 +/- % seems reasonable. Would put it on its longer term uptrend.
- Below graph is DX monthly chart.
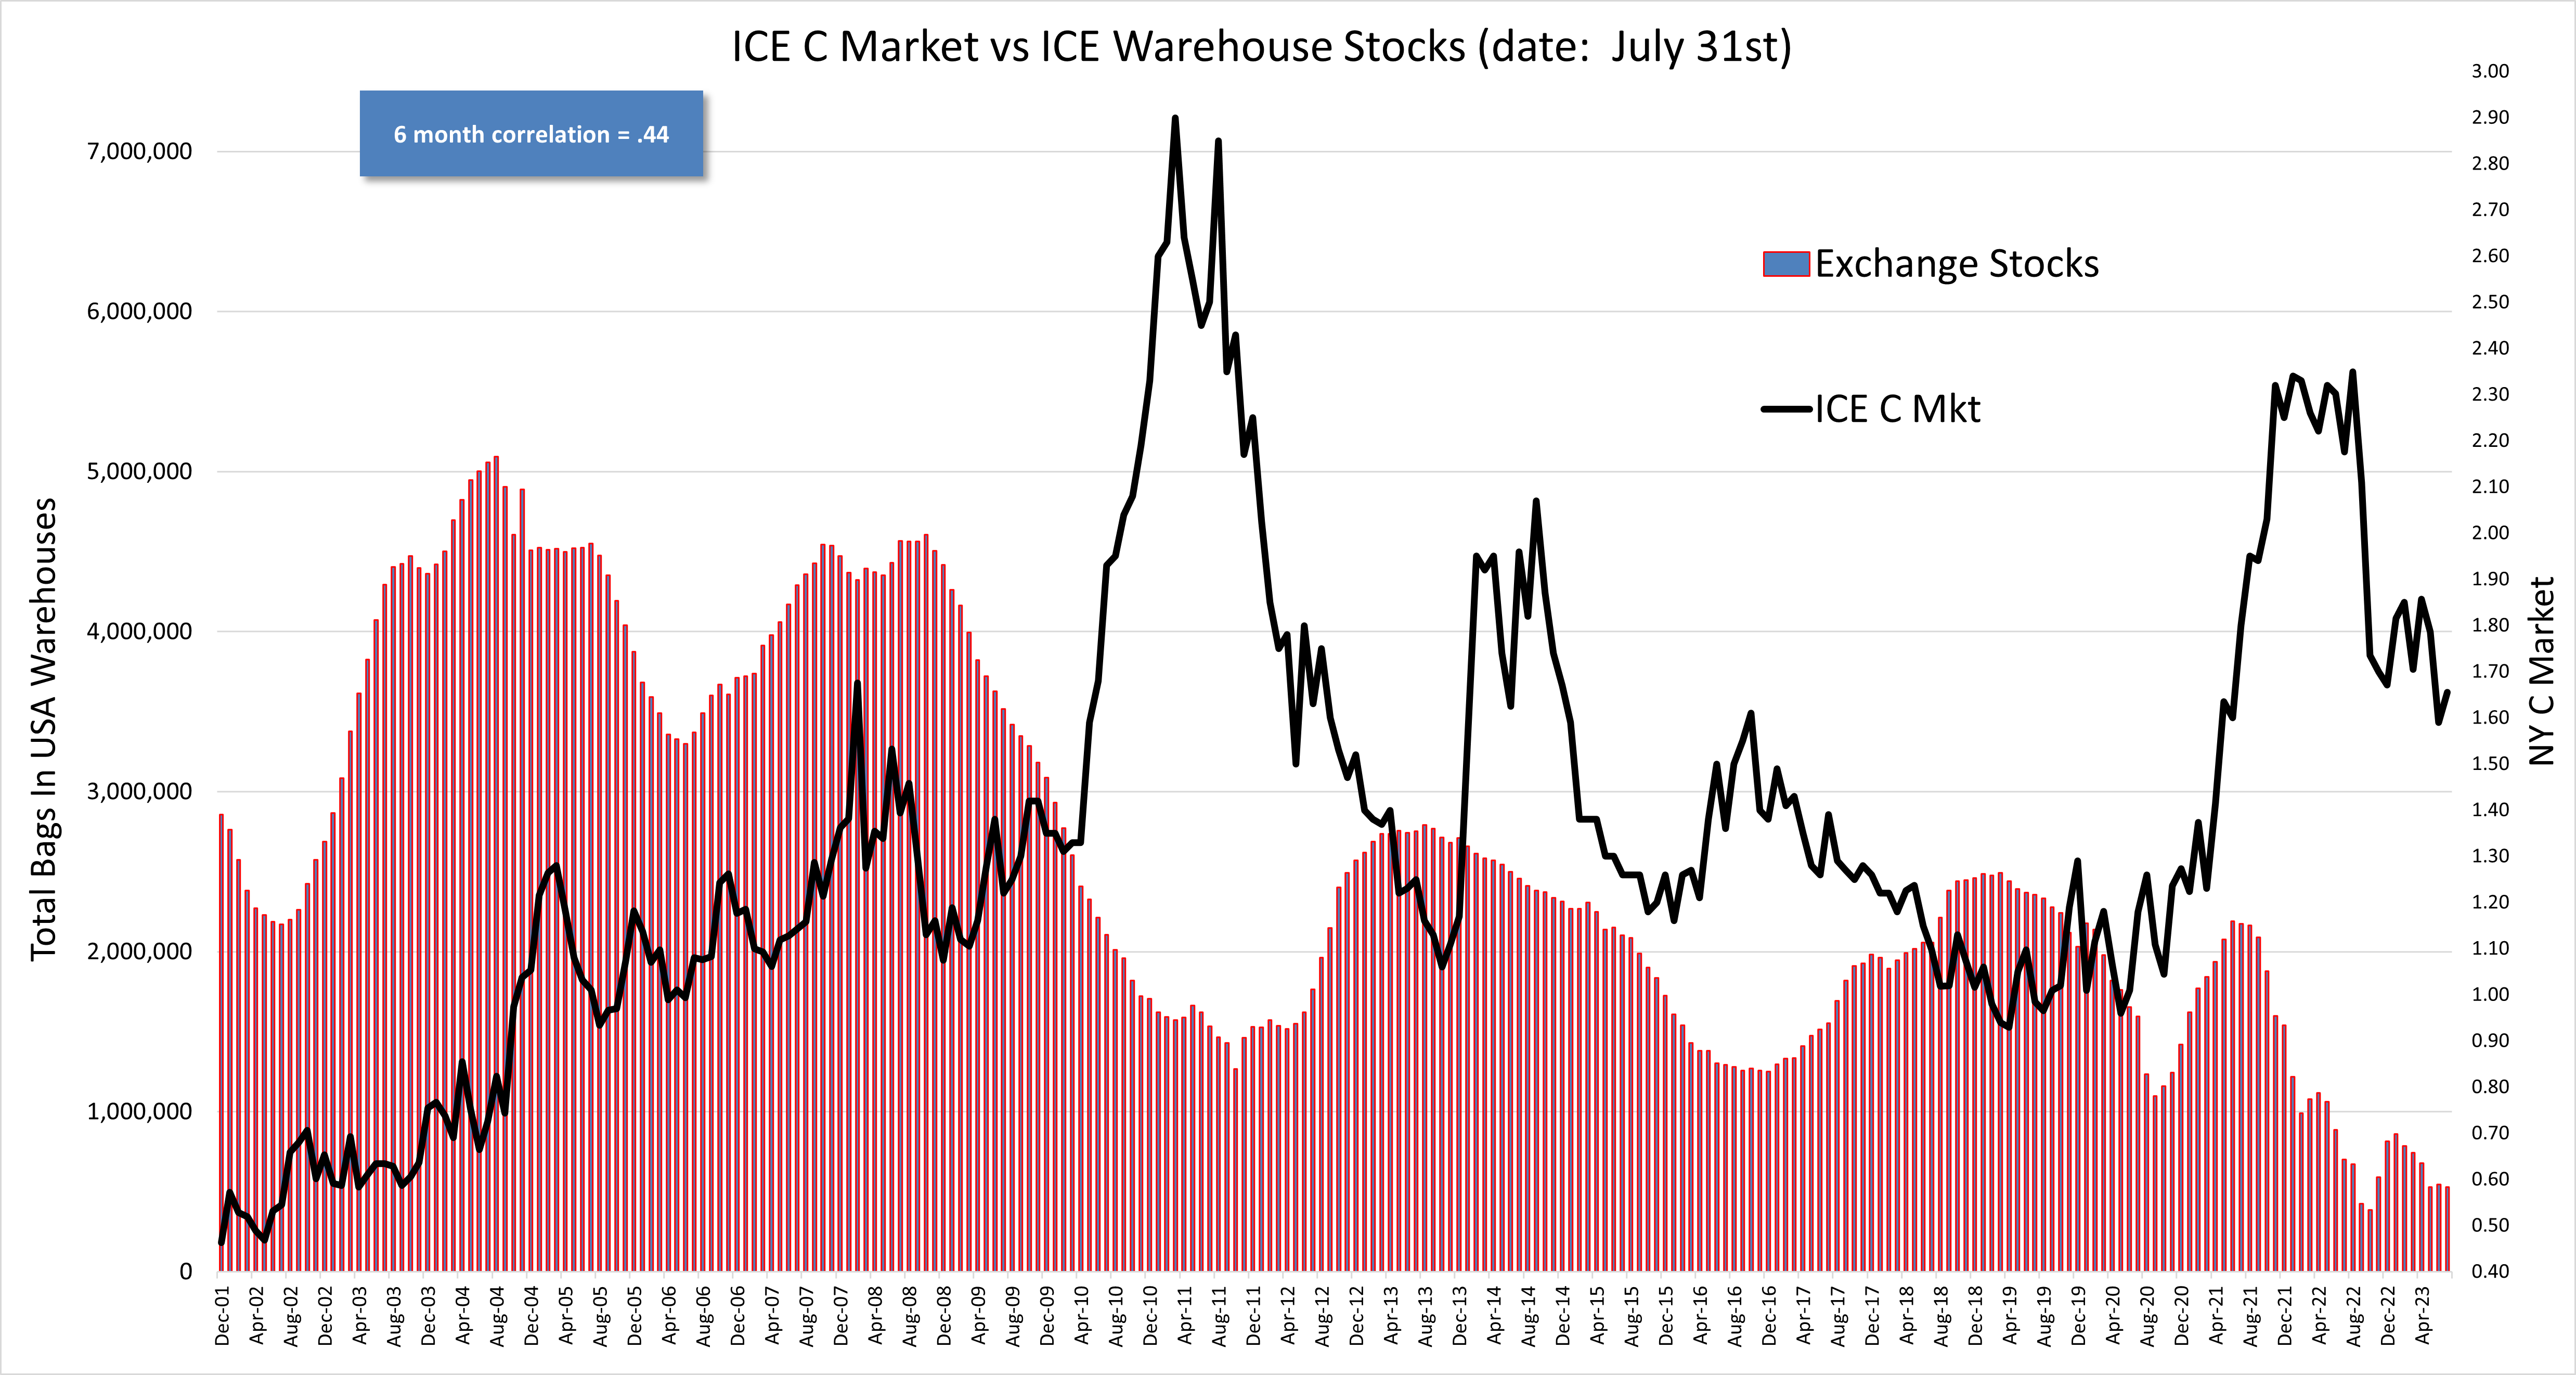
ICE Warehouse Stocks
- ICE warehouse stocks continue to fall slowly.
- However, one ought to expect with a larger Brazil crop and their blending capabilities that we should see this rise. Harvesting conditions have been excellent so there is a much higher likelihood of semi-washed like qualities to be available.