Market Report – May23
5/24/23
Summary
The tone of the last report was more bearish than bullish, but with the expectation that we would likely retest 194 (at the time of the report the market was at 175). We did and then some.
In that report I considered that 194 market level to be the key resistance in deciding whether the market was in a new bear or bull phase. We eventually broke through that resistance and briefly hit 204.90, but have since pulled back substantially. As discussed below that forced me to reassess where the key level of resistance was (if we are in a bear market) and that new level is 210.
I also discussed the possibility that the entire move from 260 to 142 was just a major correction against a much larger bull market. That is still possible, but seems less and less likely and would require a major climatic event to cause that to happen. We might get a frost, but it would have to be a similarly large one like we had in recent years. El Niño could also cause much larger issues world wide, but right now those are truly unknowns.
The other possibility — the one that I haver favored — is that the we are in a bear market that still needs to at least test the 142 lows. Assuming the bear market scenario, price targets are in the range of 125 to 142. A clean Fibonacci target would be 138 and that could unfold over many months if not a full year. From a supply and demand perspective, I think we will be in at least a small surplus for coming years and a current market of 190 is quite high and should inspire investment at the farm level. I do not see huge demand issues, but have heard it from many others which strengthens the bear argument. Furthermore, differentials have come off rather sharply.
Despite that, the following facts keep the bear thesis in check. ICE stocks continue to drop. Real continues to appreciate. Market structure (switch) is still very inverted. Robusta market has been on a tear. El Niño might exacerbate some of the current supply issues.
So, expectation is that we will see the market lower sooner than later.
Recommendations
As always, with so much uncertainty I favor using options to protect against any upside move. With key breakout point moved to 210, I would be more likely to buy the Sep 210/240 call spread vs selling 150 Put. That would cost some money, so I would wait to trade that with a market dip at even money. Bar any weather event, I would expect both option legs to expire worthless. However, from a roaster perspective you ought to be in a position to buy coffee at a lower market level. Call Cardiff Coffee Trading to discuss which levels would work best for your purchasing needs.
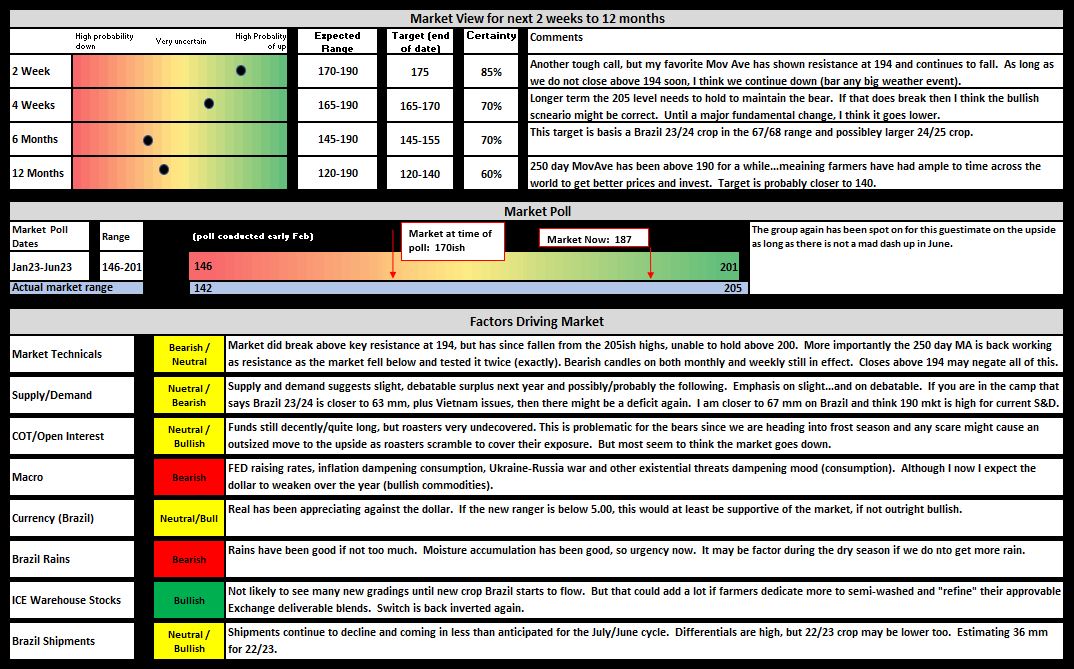
Market Poll – Jan23-Jun23
- Reminder that the market poll conducted in February predicted a range of 142 to 201 (market traded to 204.90)
Summary Graphic
- 2 week target is 175
- 4 week target is 165-170
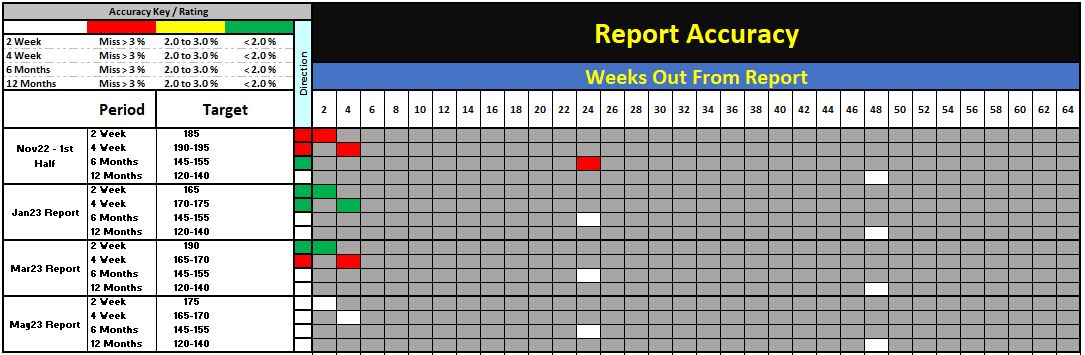
Market Prediction Accuracy
- As always, I am updating my predictions vs. what actually happened.
- Holding myself to a high standard, but at least you can see how useful my predictions have been.
Supporting Graphs
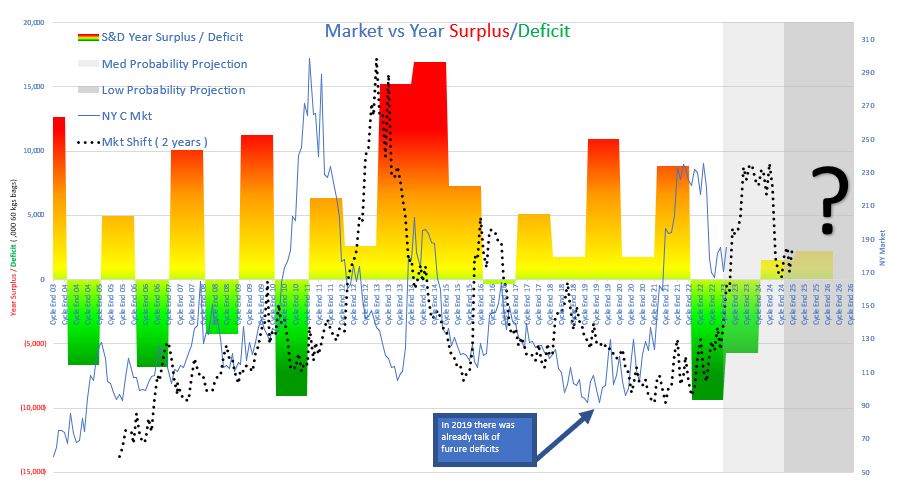
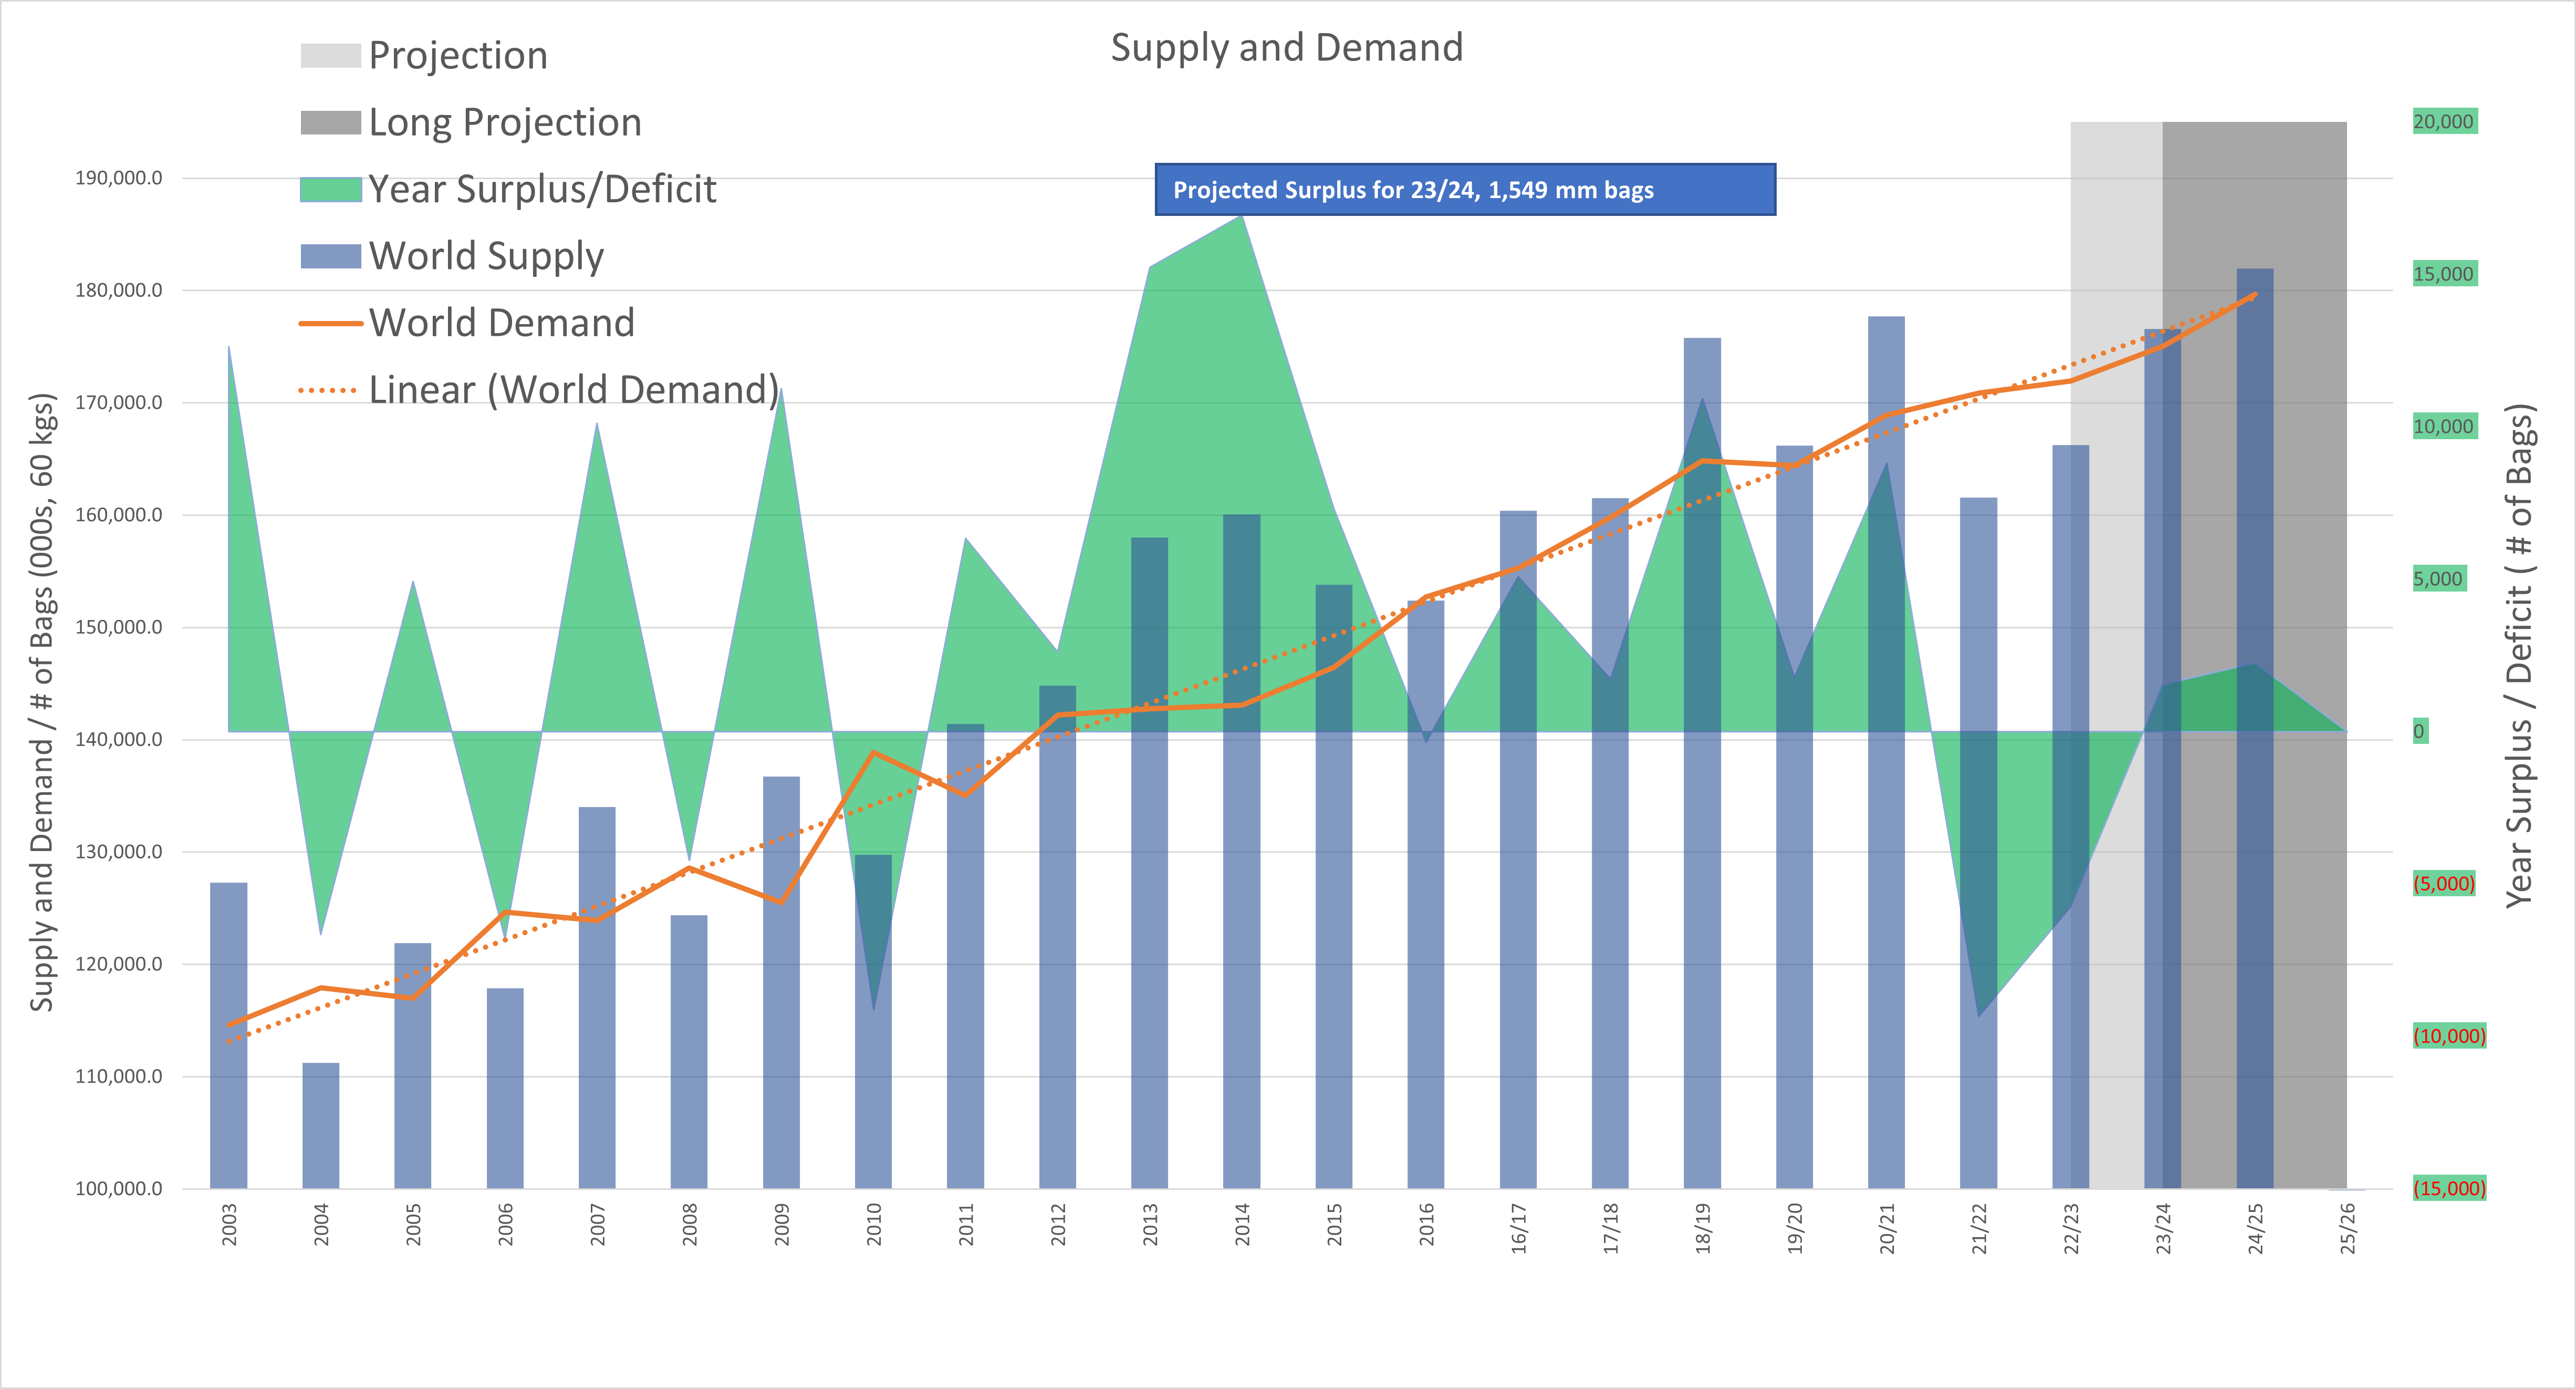
Supply and Demand
- The first graph superimposes the market that is shifted 2 years forward (dotted black line) over the yearly Surplus/Deficits. The 2 year shift tends to line up bull markets with deficits (green area) and bear markets with surpluses (red/yellow area). Forward guestimates right now suggest slight surplus. However, there are some who are suggesting a 3rd year of deficit for 23/24.
- It is interesting how the actual market oscillations align with the current prediction of a very small surplus. Given the high degree of uncertainty looking 1 to 2 years out, that makes sense.
- As my graphs suggest it’s not very bullish or bearish, but the market is also at 190 which is high. Even with balanced supply and demand, market should creep lower.
- Big unknows are Brazil 23/24 crop (and 24/25). what effect El Niño will have on crops, particularly in Indonesia and Vietnam and talk of overall weak consumption.
Market Graphs
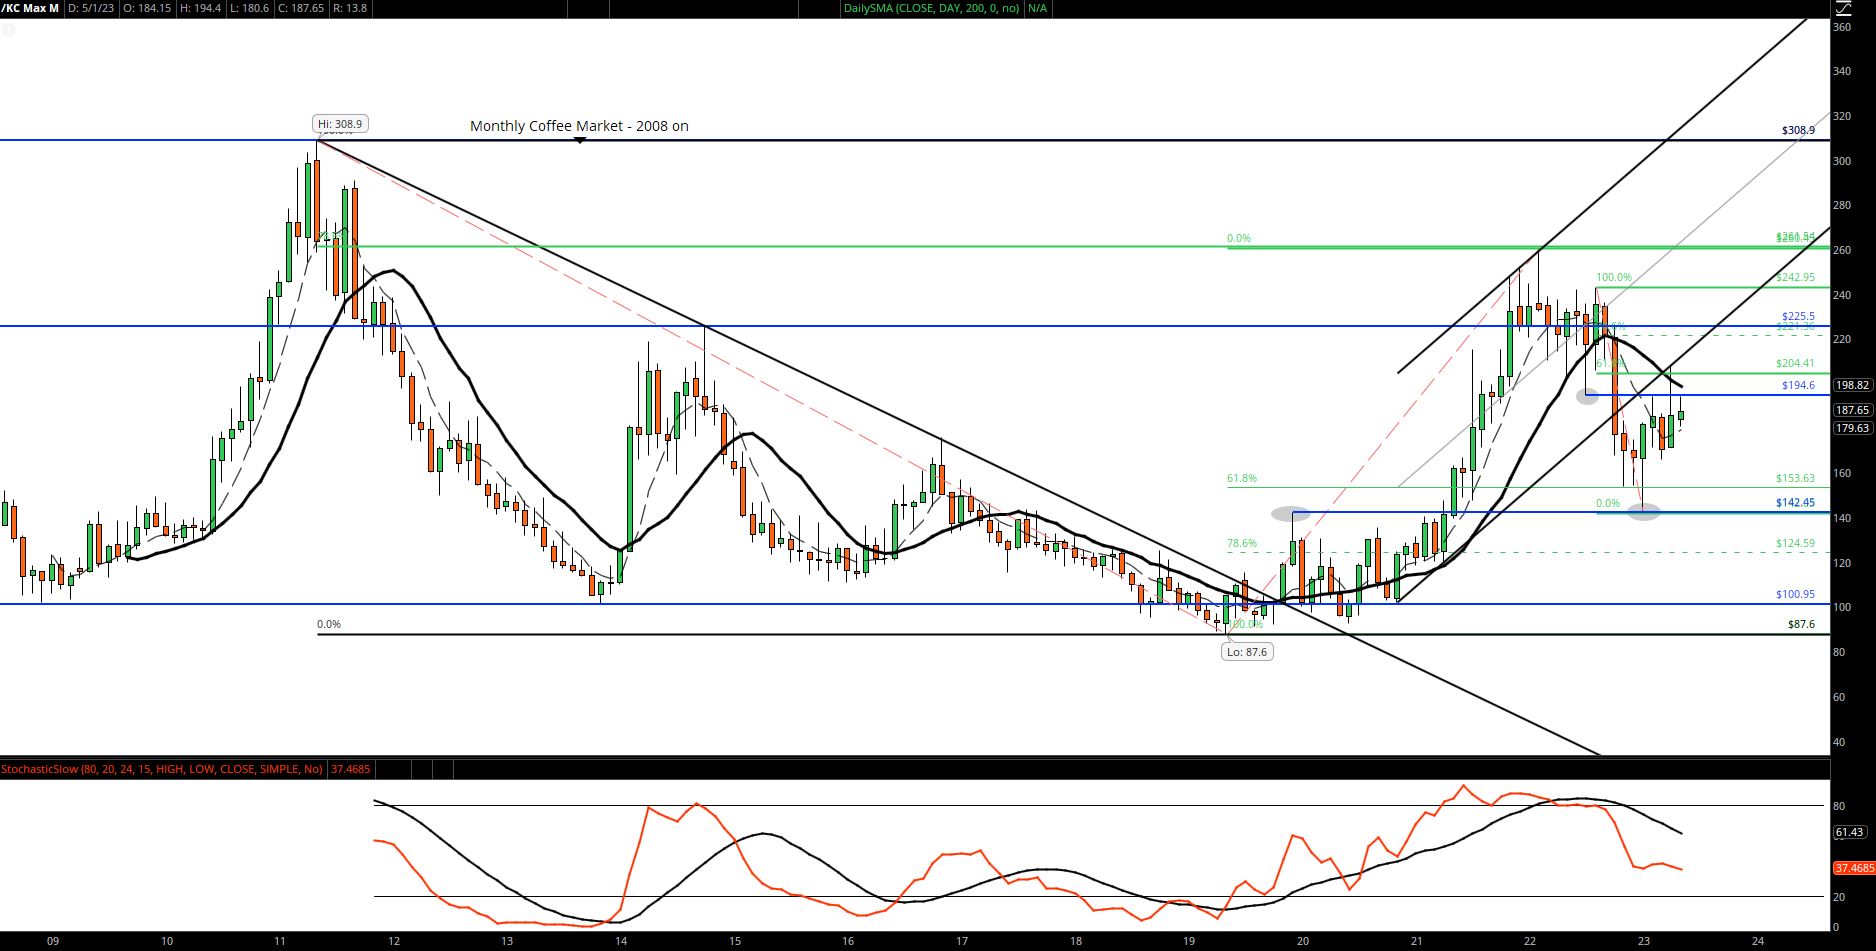
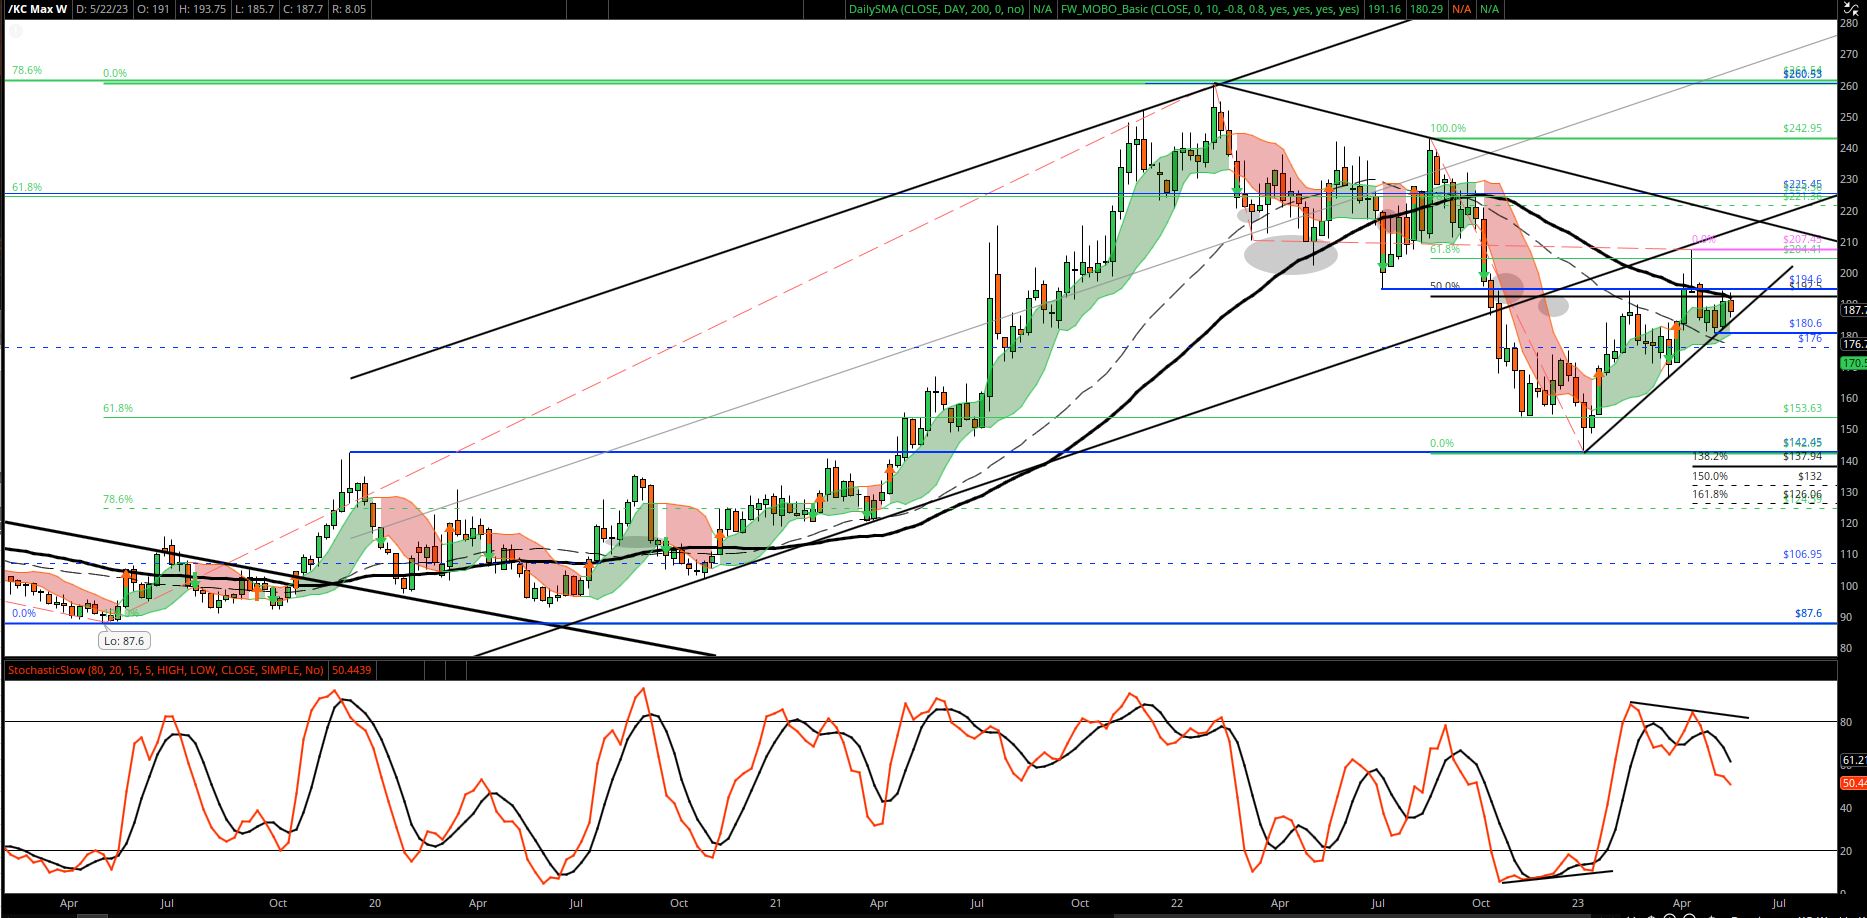
- In the last report in Mar23 the “Line in the sand” was 194.60. While an important level (since it did serve as substantial resistance), the “true line in the sand” may have actually been roughly 210. Part of my bear thesis is that the move down from 260 was the beginning of a larger move down (which it did, getting to 142). The next expectation was that the market would rally against that down trend, maybe to 194 (which it did initially). However, and as you can see in the NY Priced in Reais graph, the better resistance point may have actually been higher. So, that 210 level now becomes the key level.
- Confusion about what was the true level comes from the way the market chopped, violently up and down from Mar22 to Aug22 (7 months). It may be that that was the true correction from the move from 260 to 210 that precipitated the huge move down to 142. If so and we are in a bear market, the technicals start lining up neatly for another larger move down to and through 142. Again, you have to believe we are in a bear market and that the fundamentals are bearish. Neither of which are 100 % obvious.
- As mentioned in last report, the bull thesis is that actual supply and demand is much tighter and likely to be in deficit again this year and that previous market highs really did nothing to inspire investment in more production. If that were the case, then the bounce off of 142 (which was the previous breakout point to 260) was just that, a bounce, and that we are now in the next leg up. That target, using Fibonacci ratios could be around 245.
- Again, I tend to favor the bear scenario since I think there are more market technicals pointing lower than higher. And that matches my belief that Supply and Demand is going to be slighly in surplus for 23/24 and maybe, likely, for 24/25.
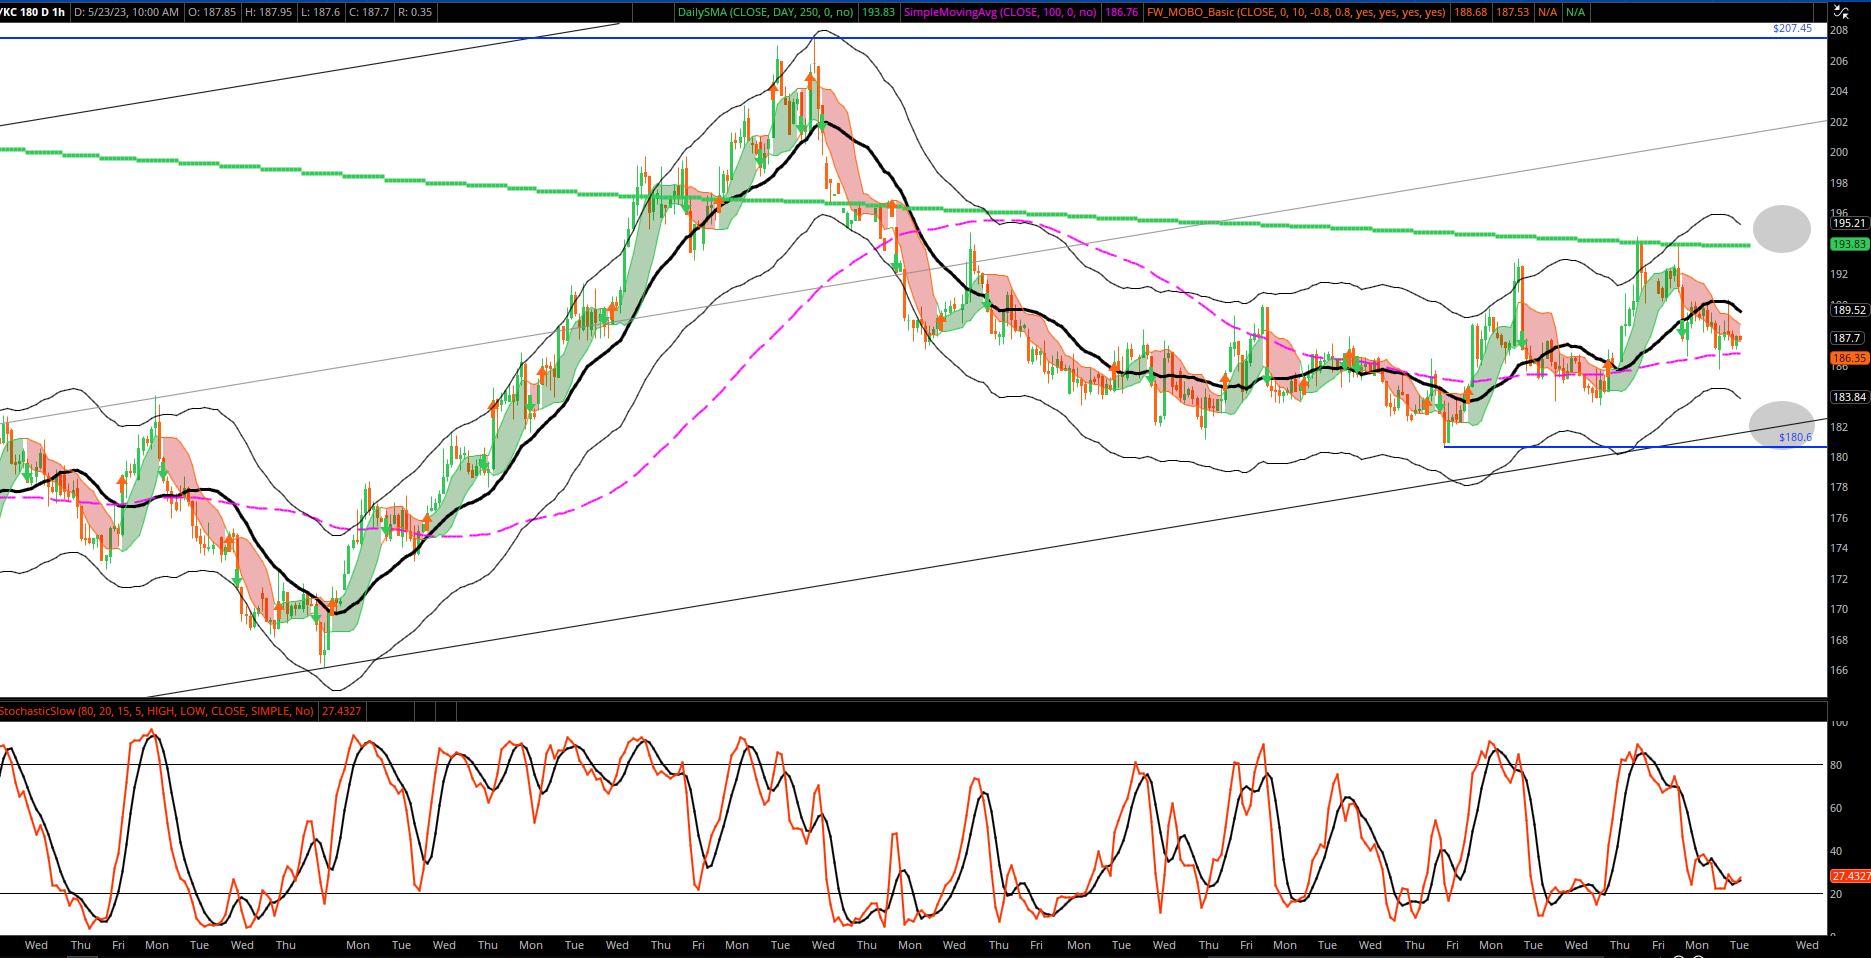
- Market is trading under my favorite Moving Average and that tends to hold for many, many months.
- A break below 180 would be significant.
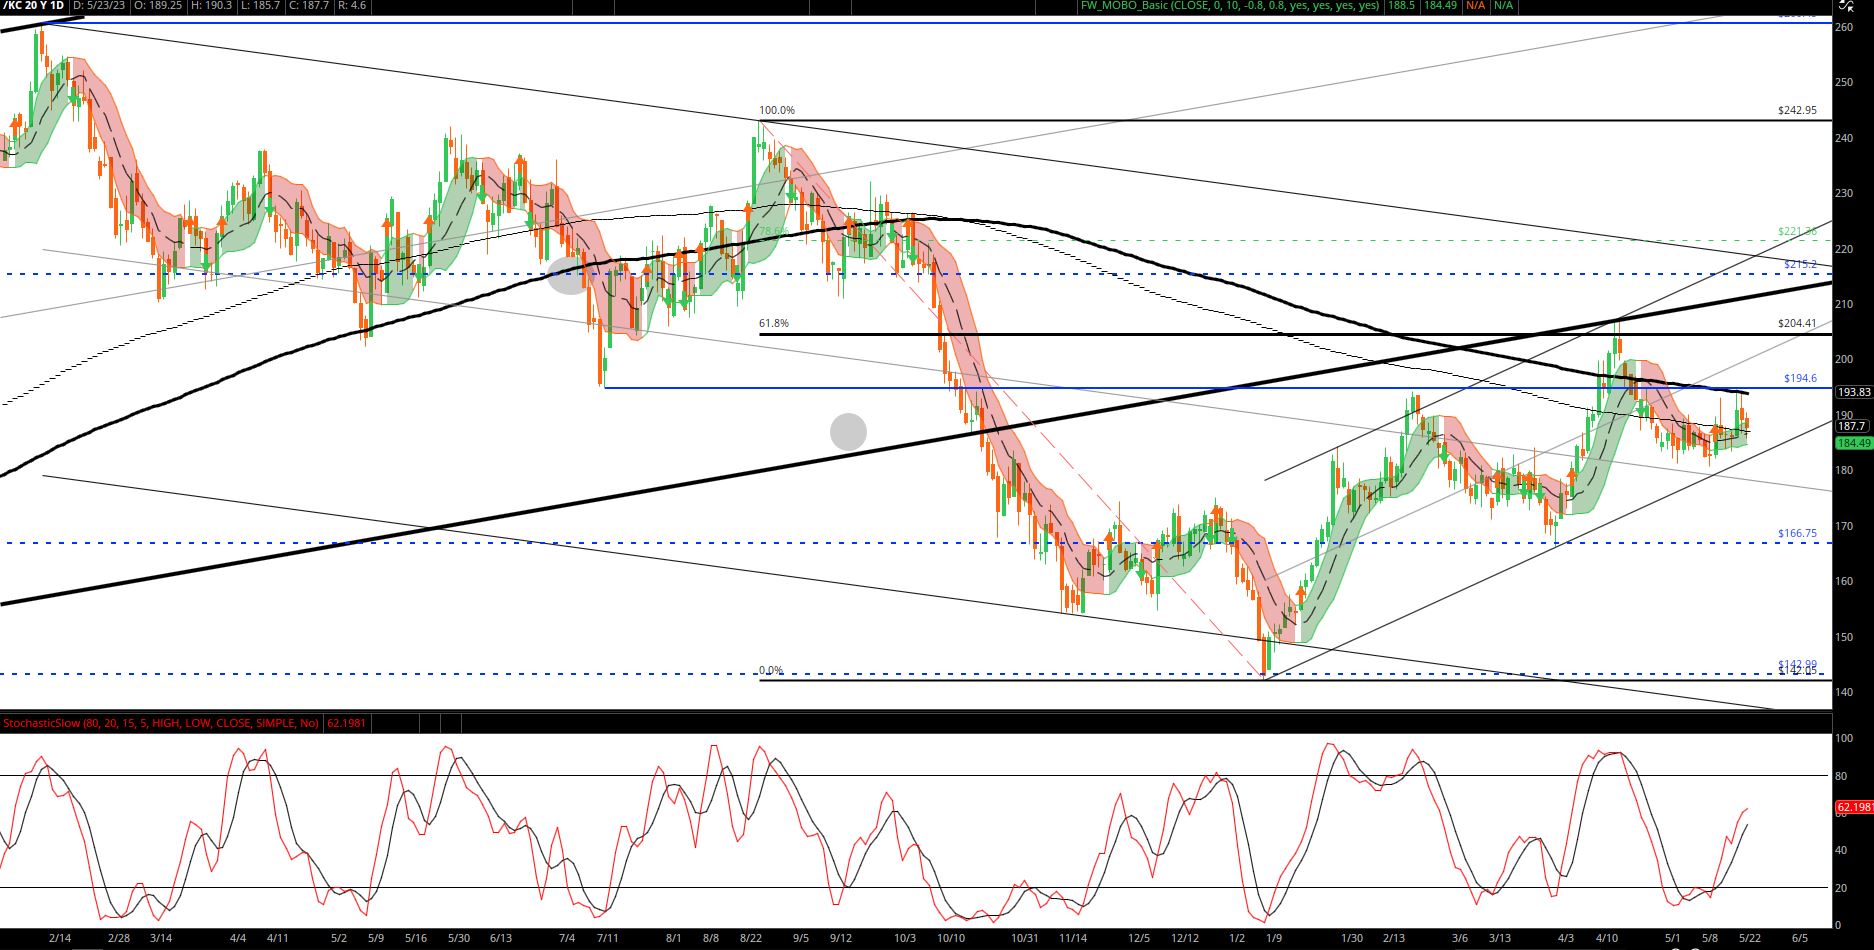
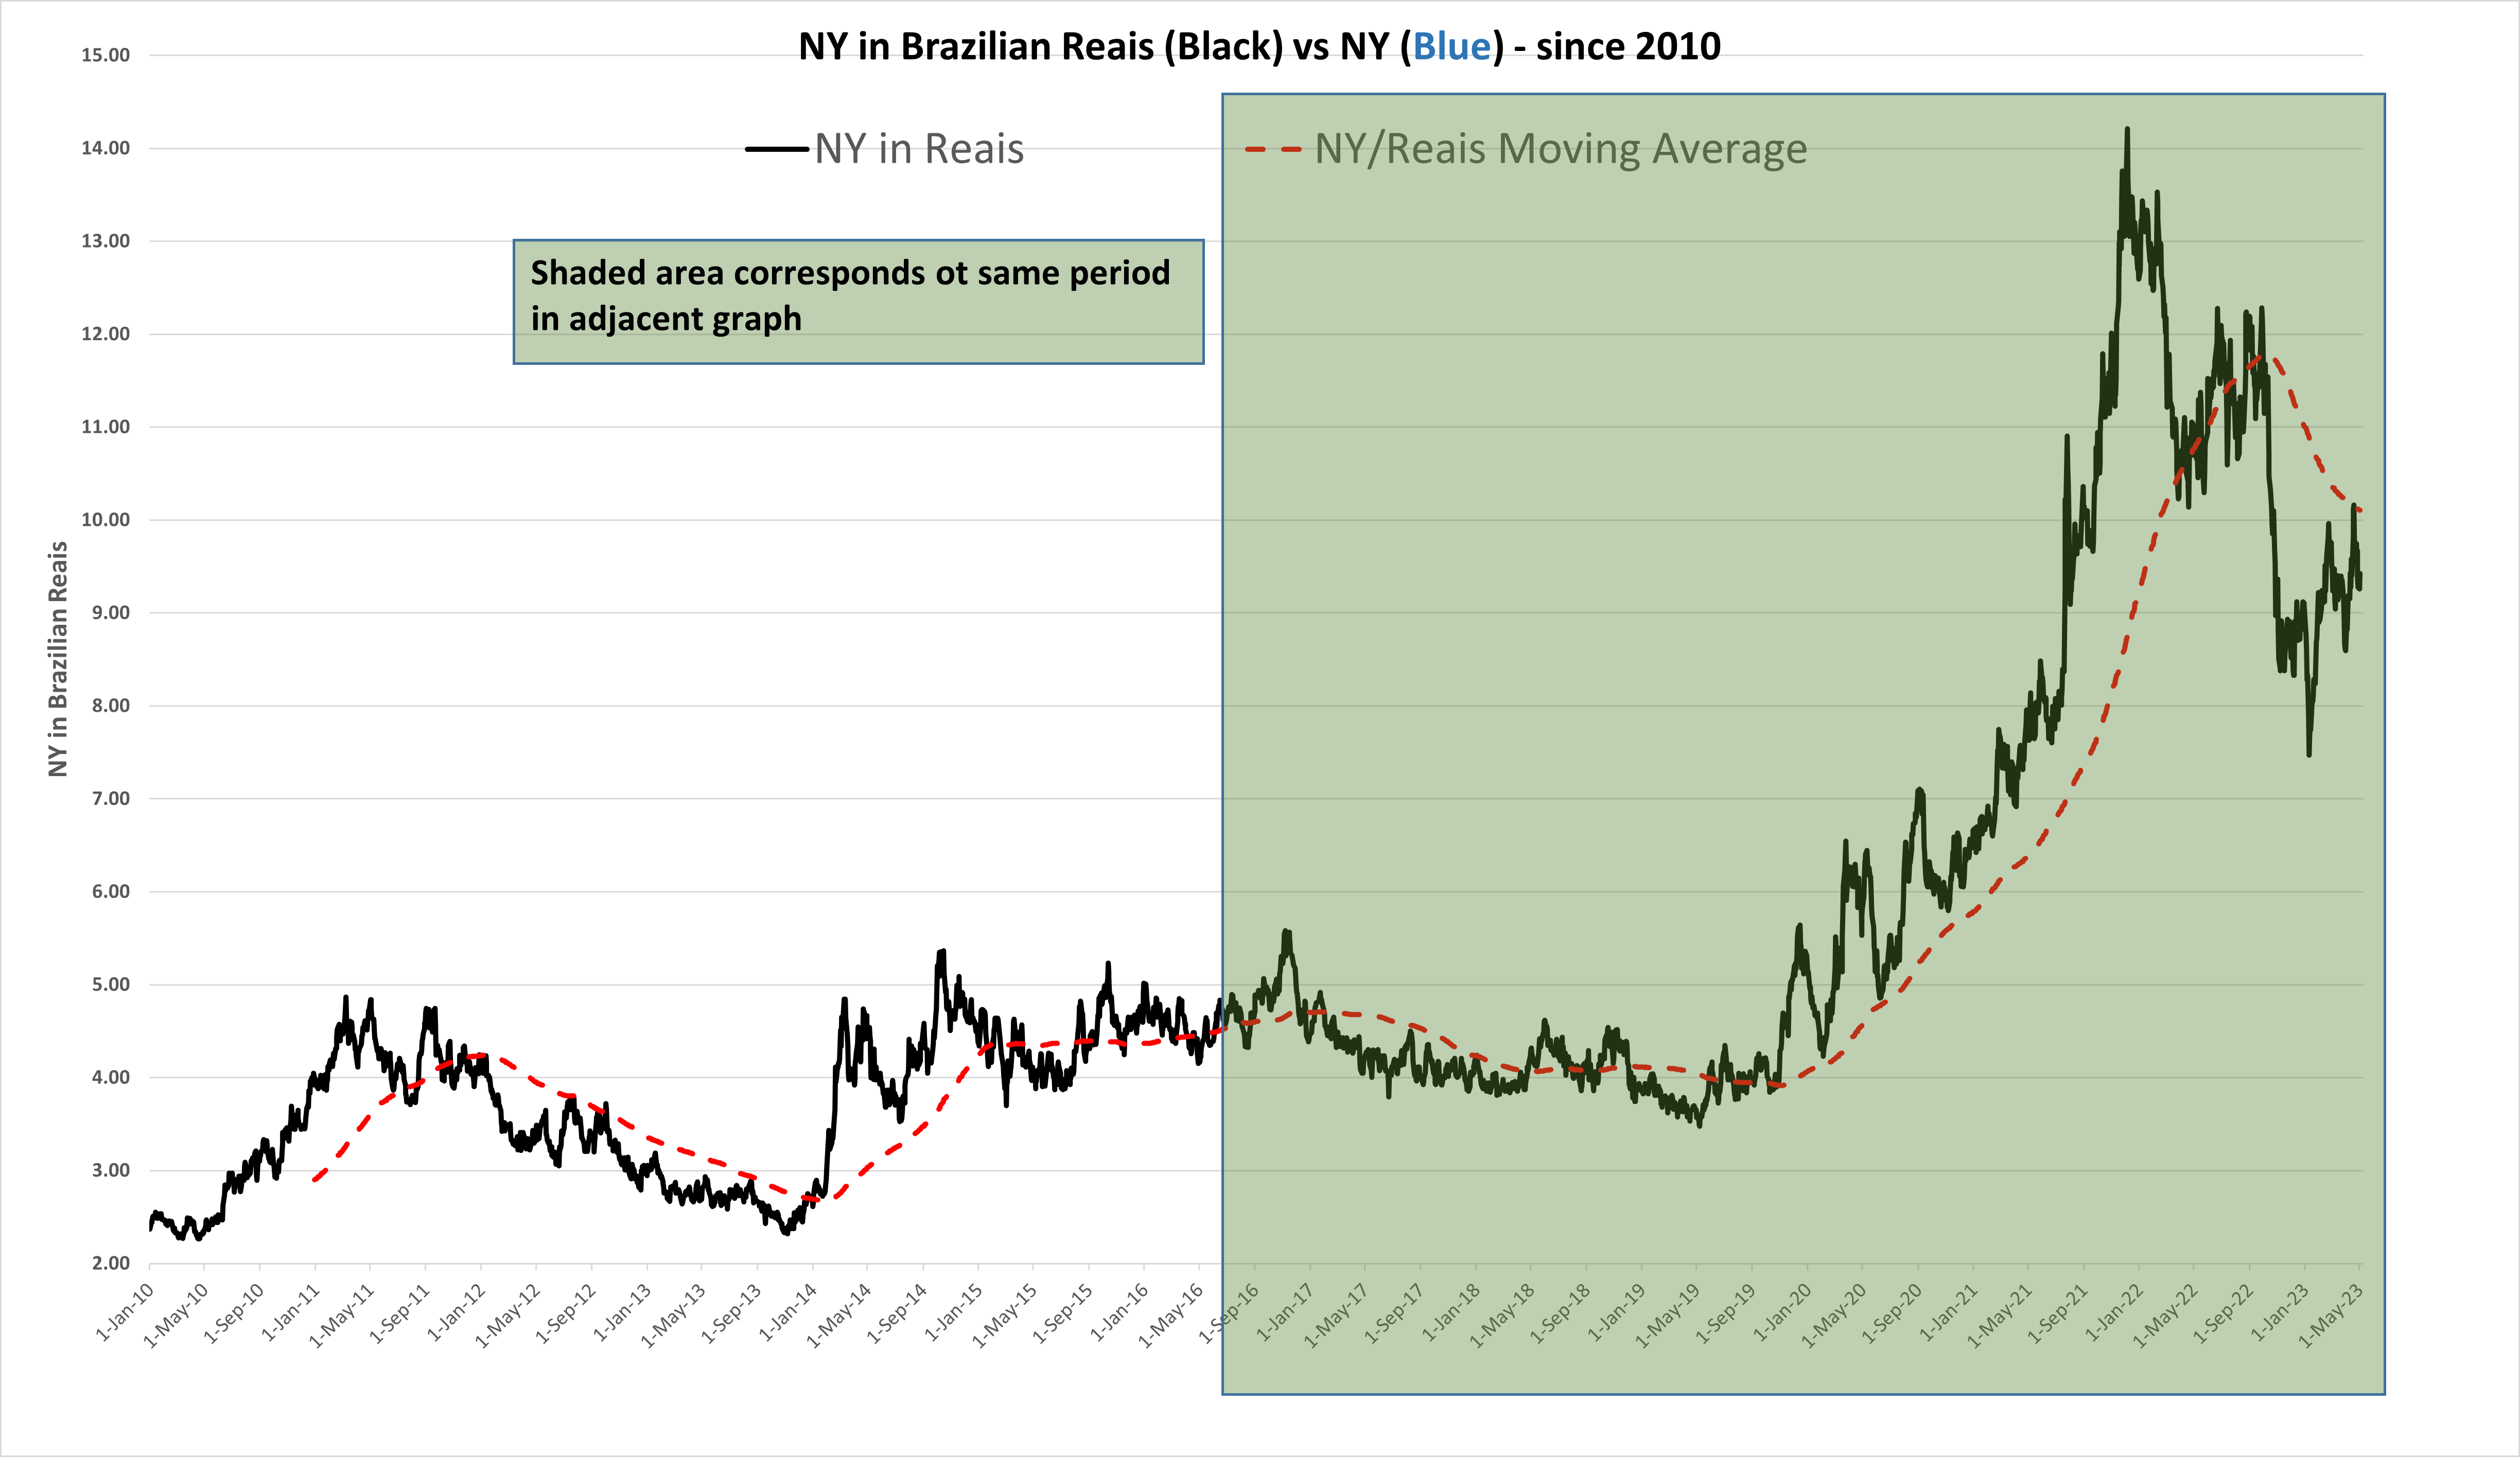
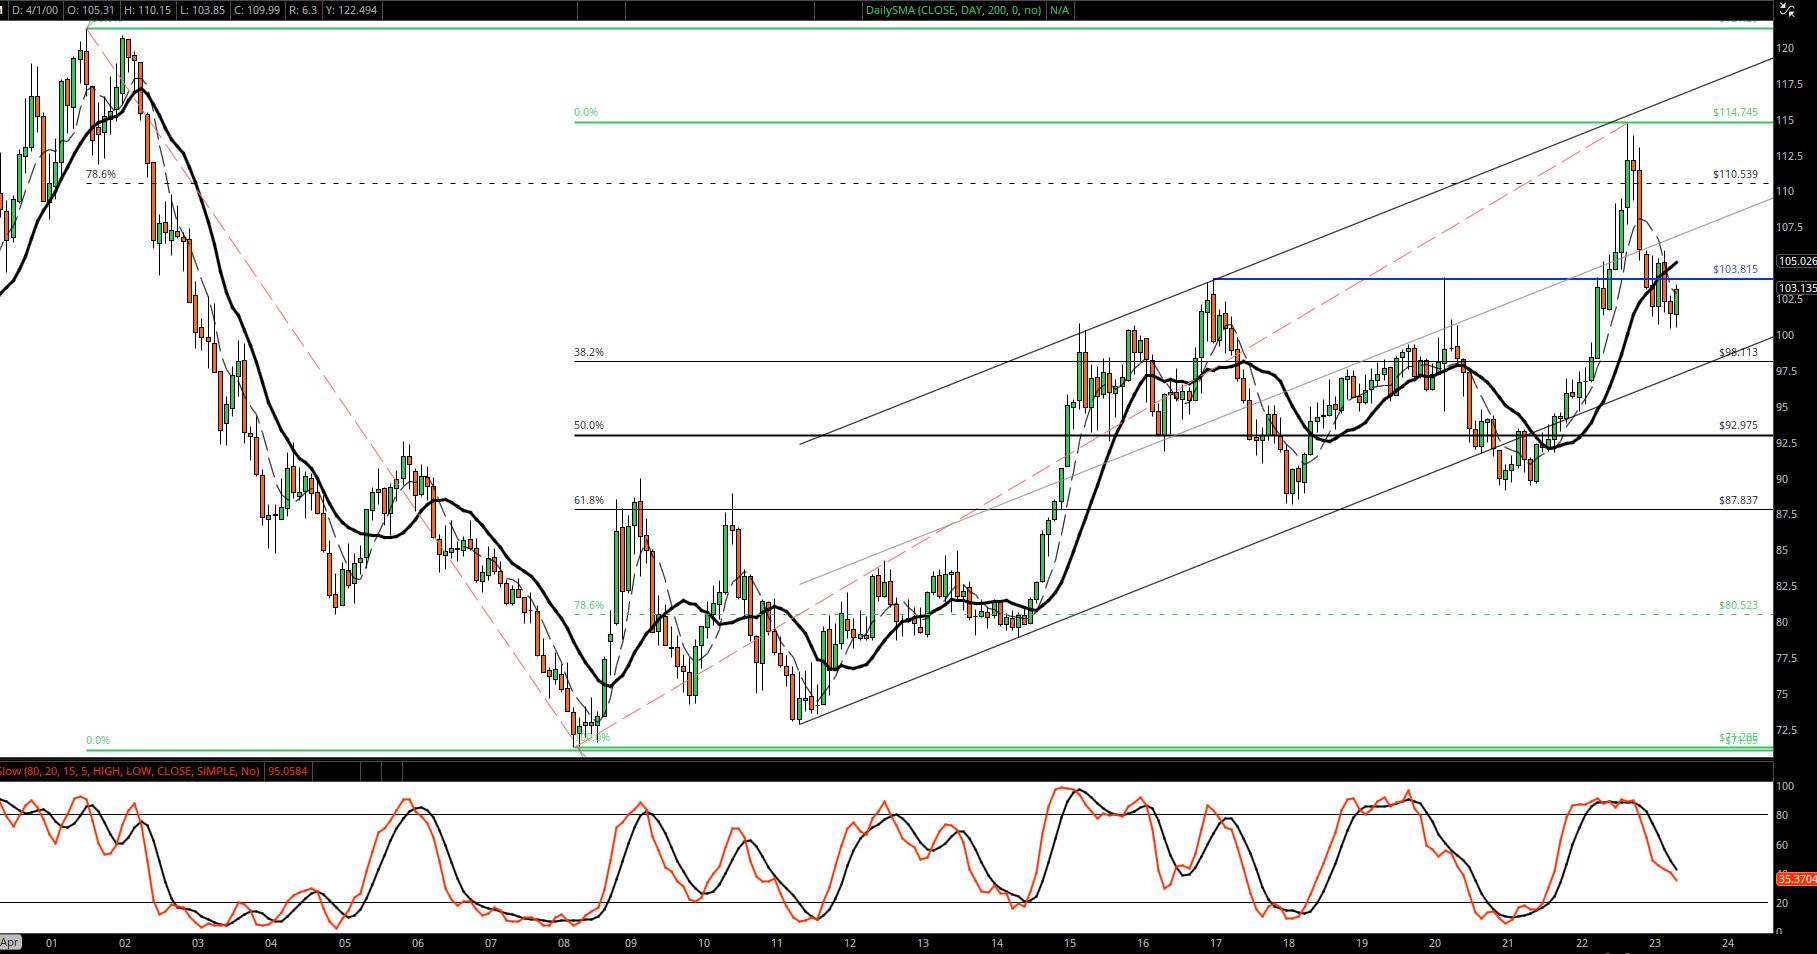
NY Priced in Reais
- This graph is NY C market priced in the Brazilian Currency the Real.
- It’s a much cleaner picture of what the market did and reinforces the above idea that the true point of resistance was the 210 market.
- It also now trending under key moving average and finding resistance off of that MA.
COT Open Interest
Weekly Summary
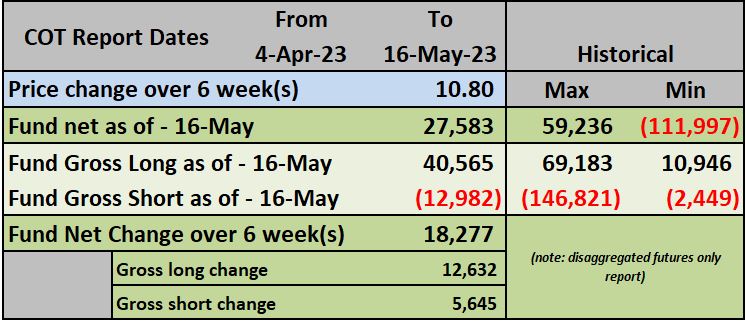
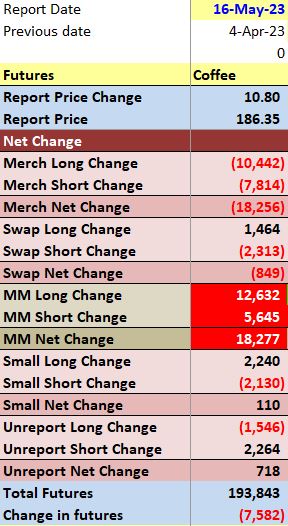
- Below summary is from April 4th to May 16th.
- Funds bought a net of 18 k lots while the market rallied a total of 10.8 cents. Ie, there was lots of selling by both rosters and producers near the top.
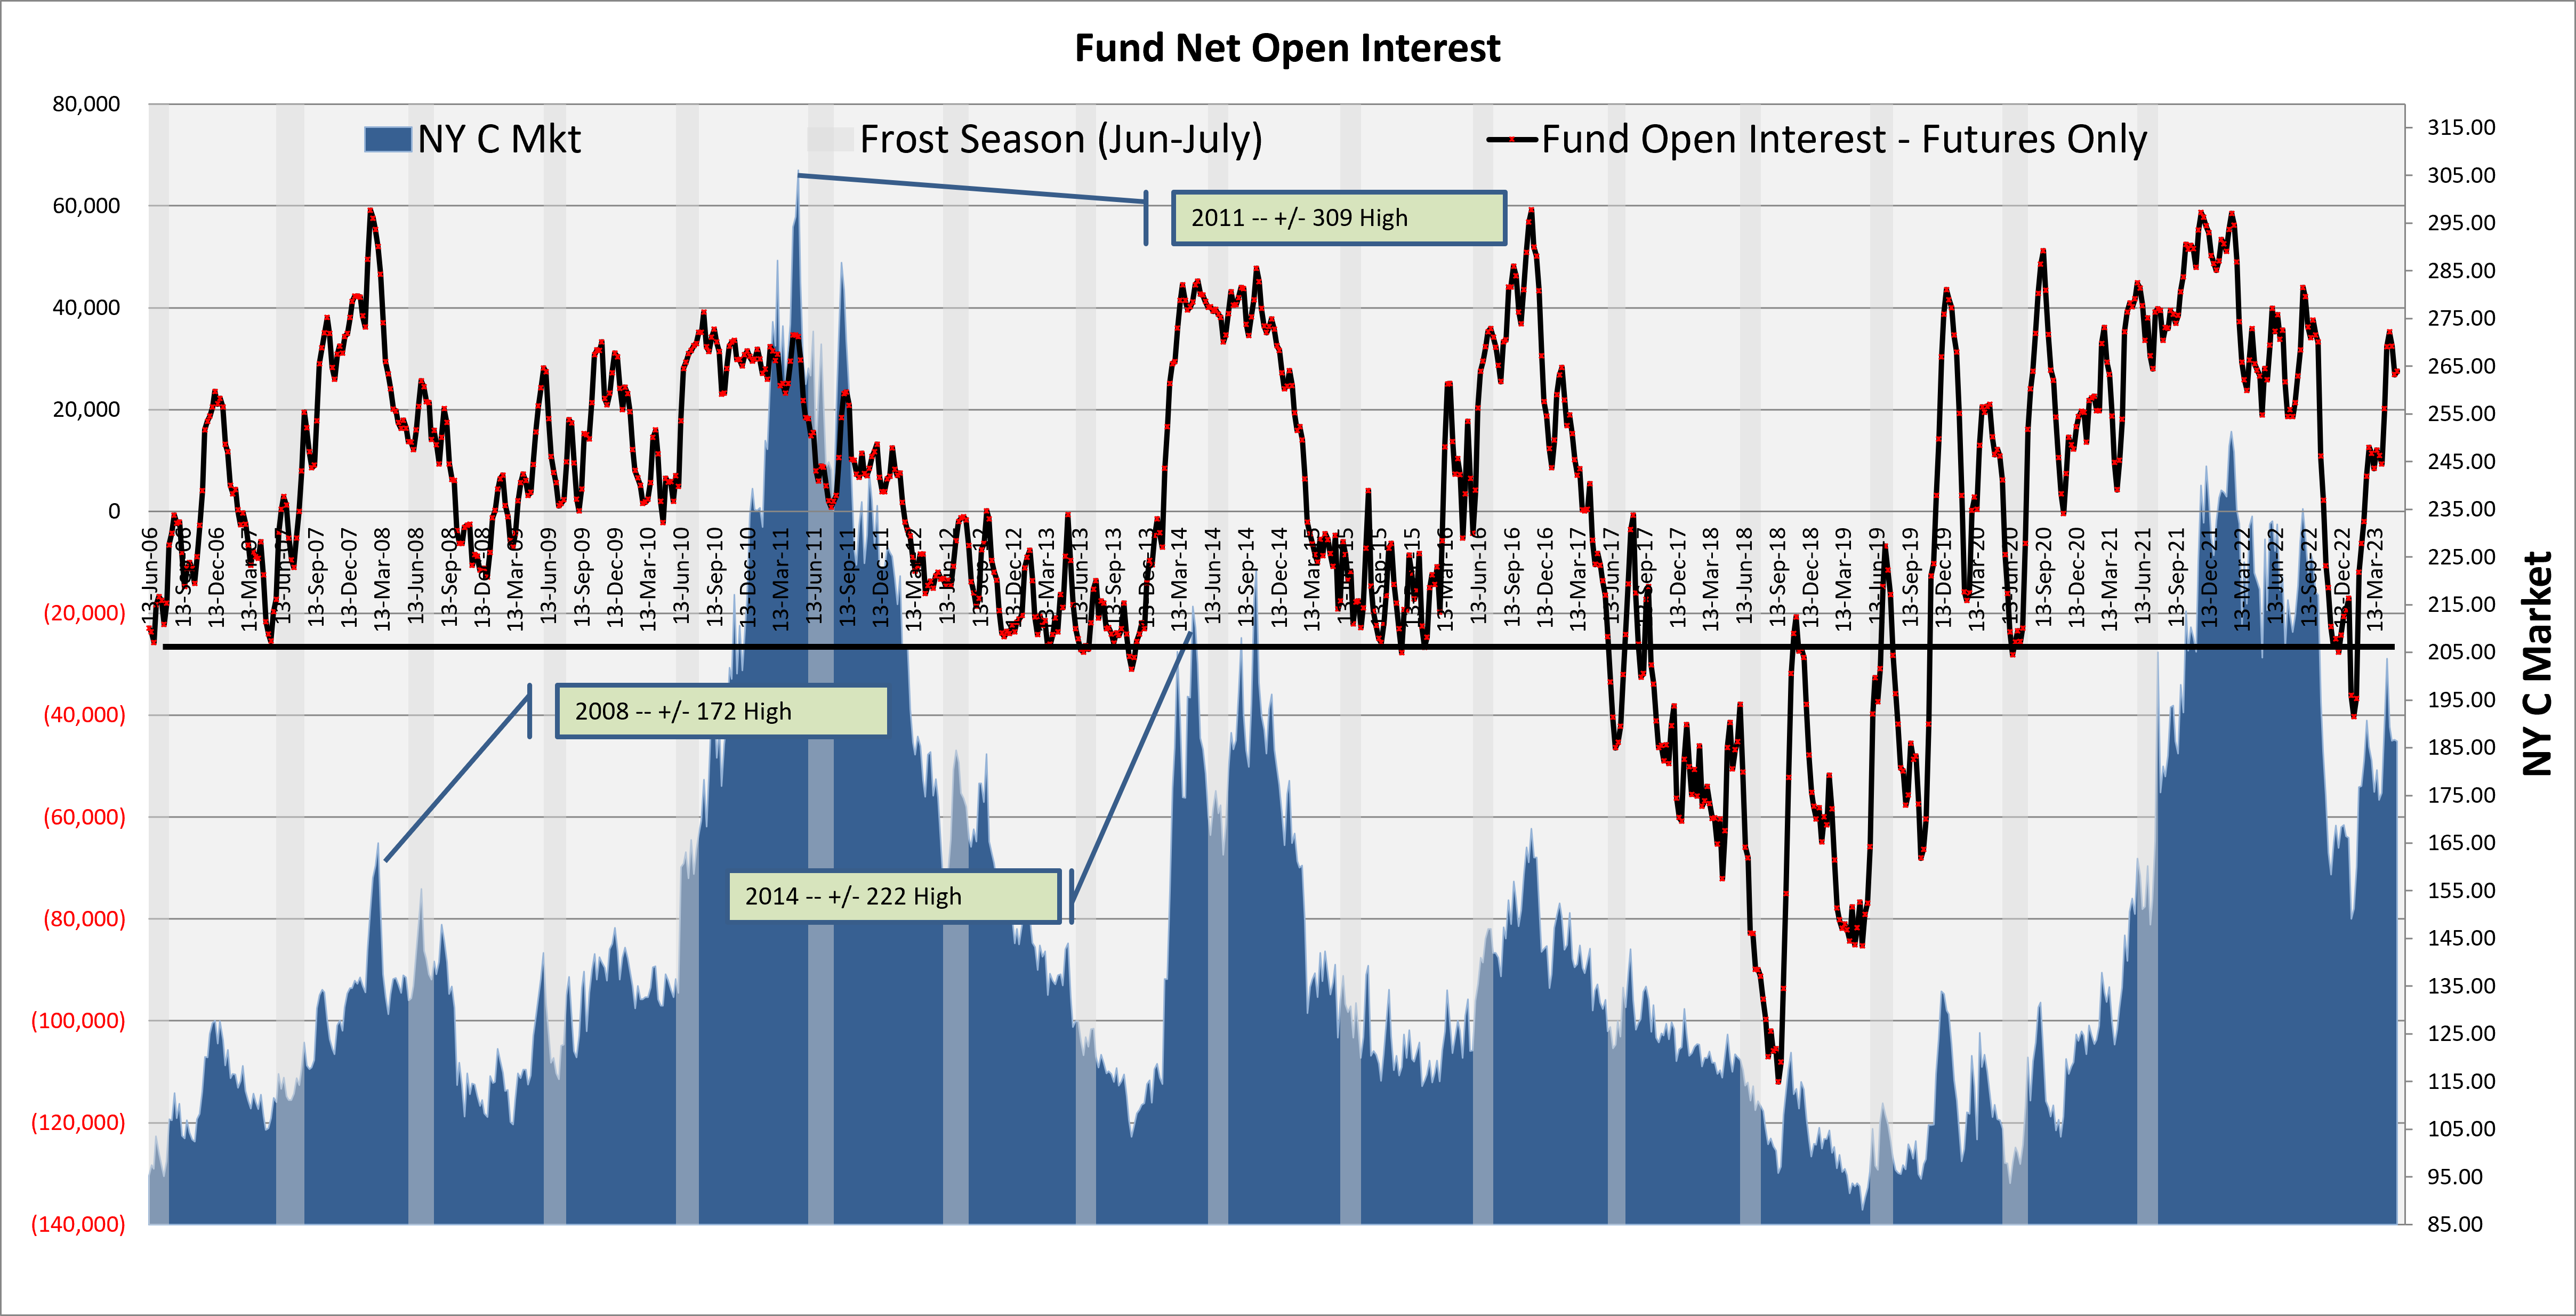
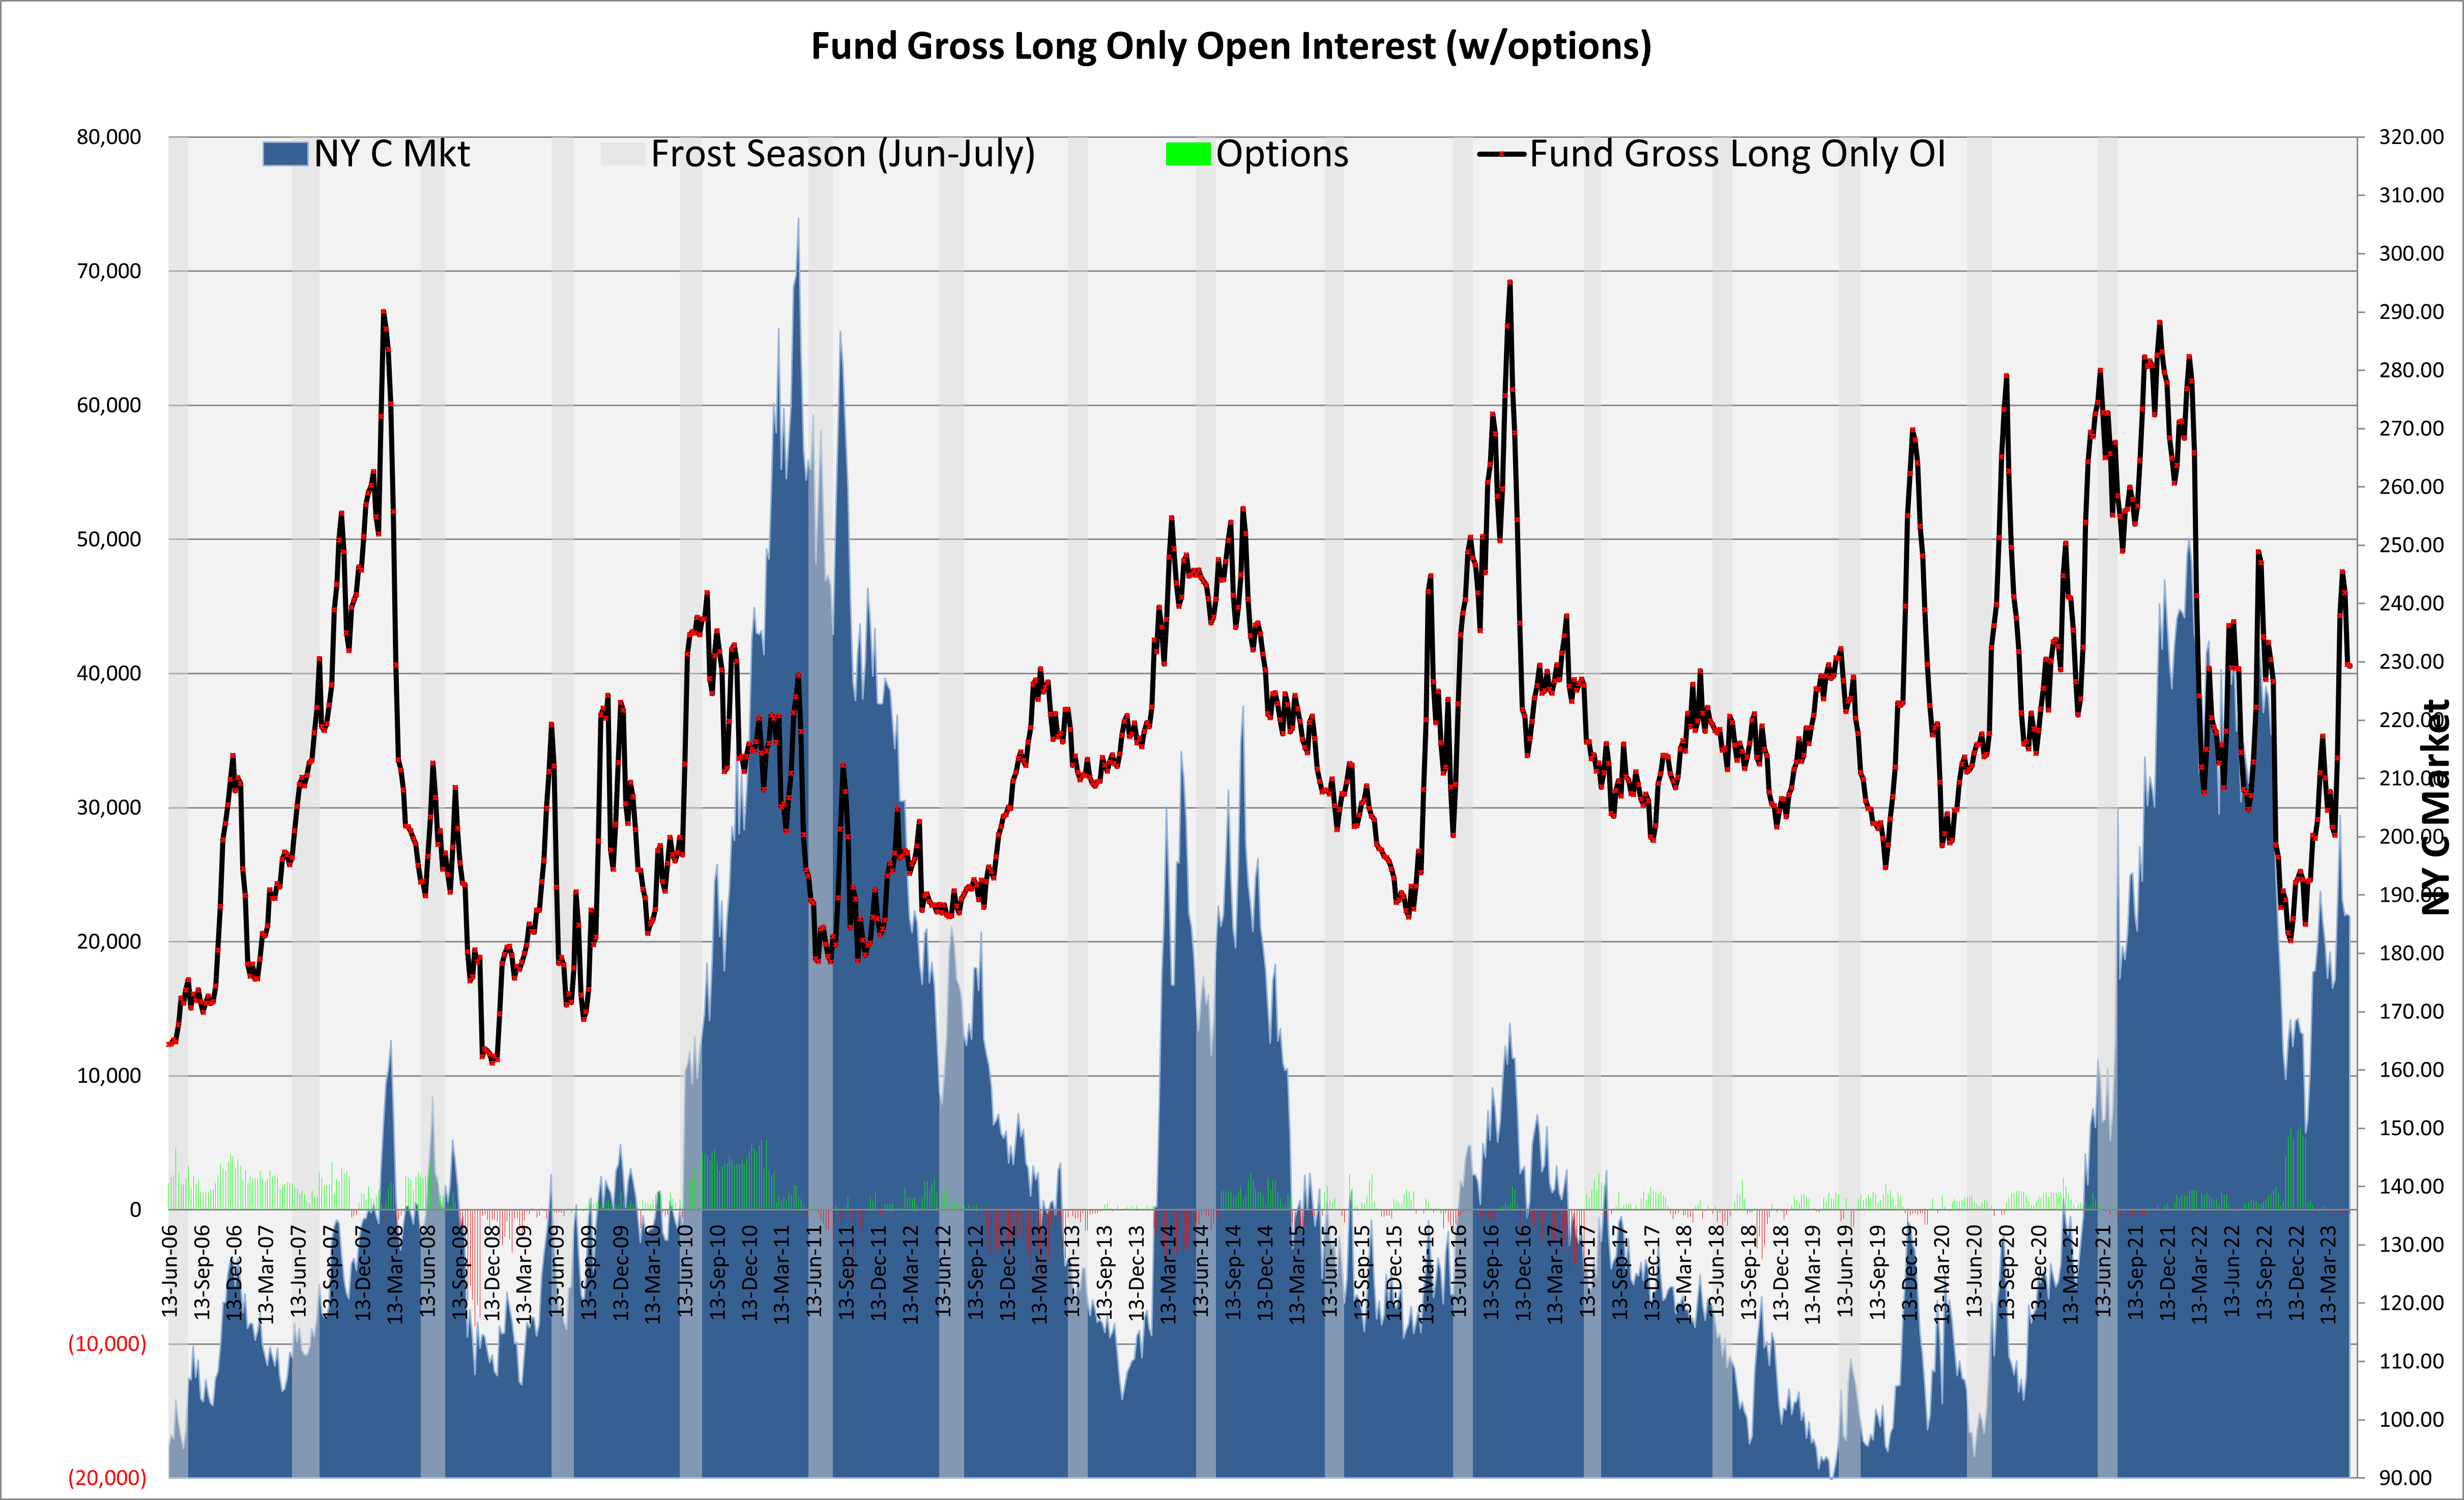
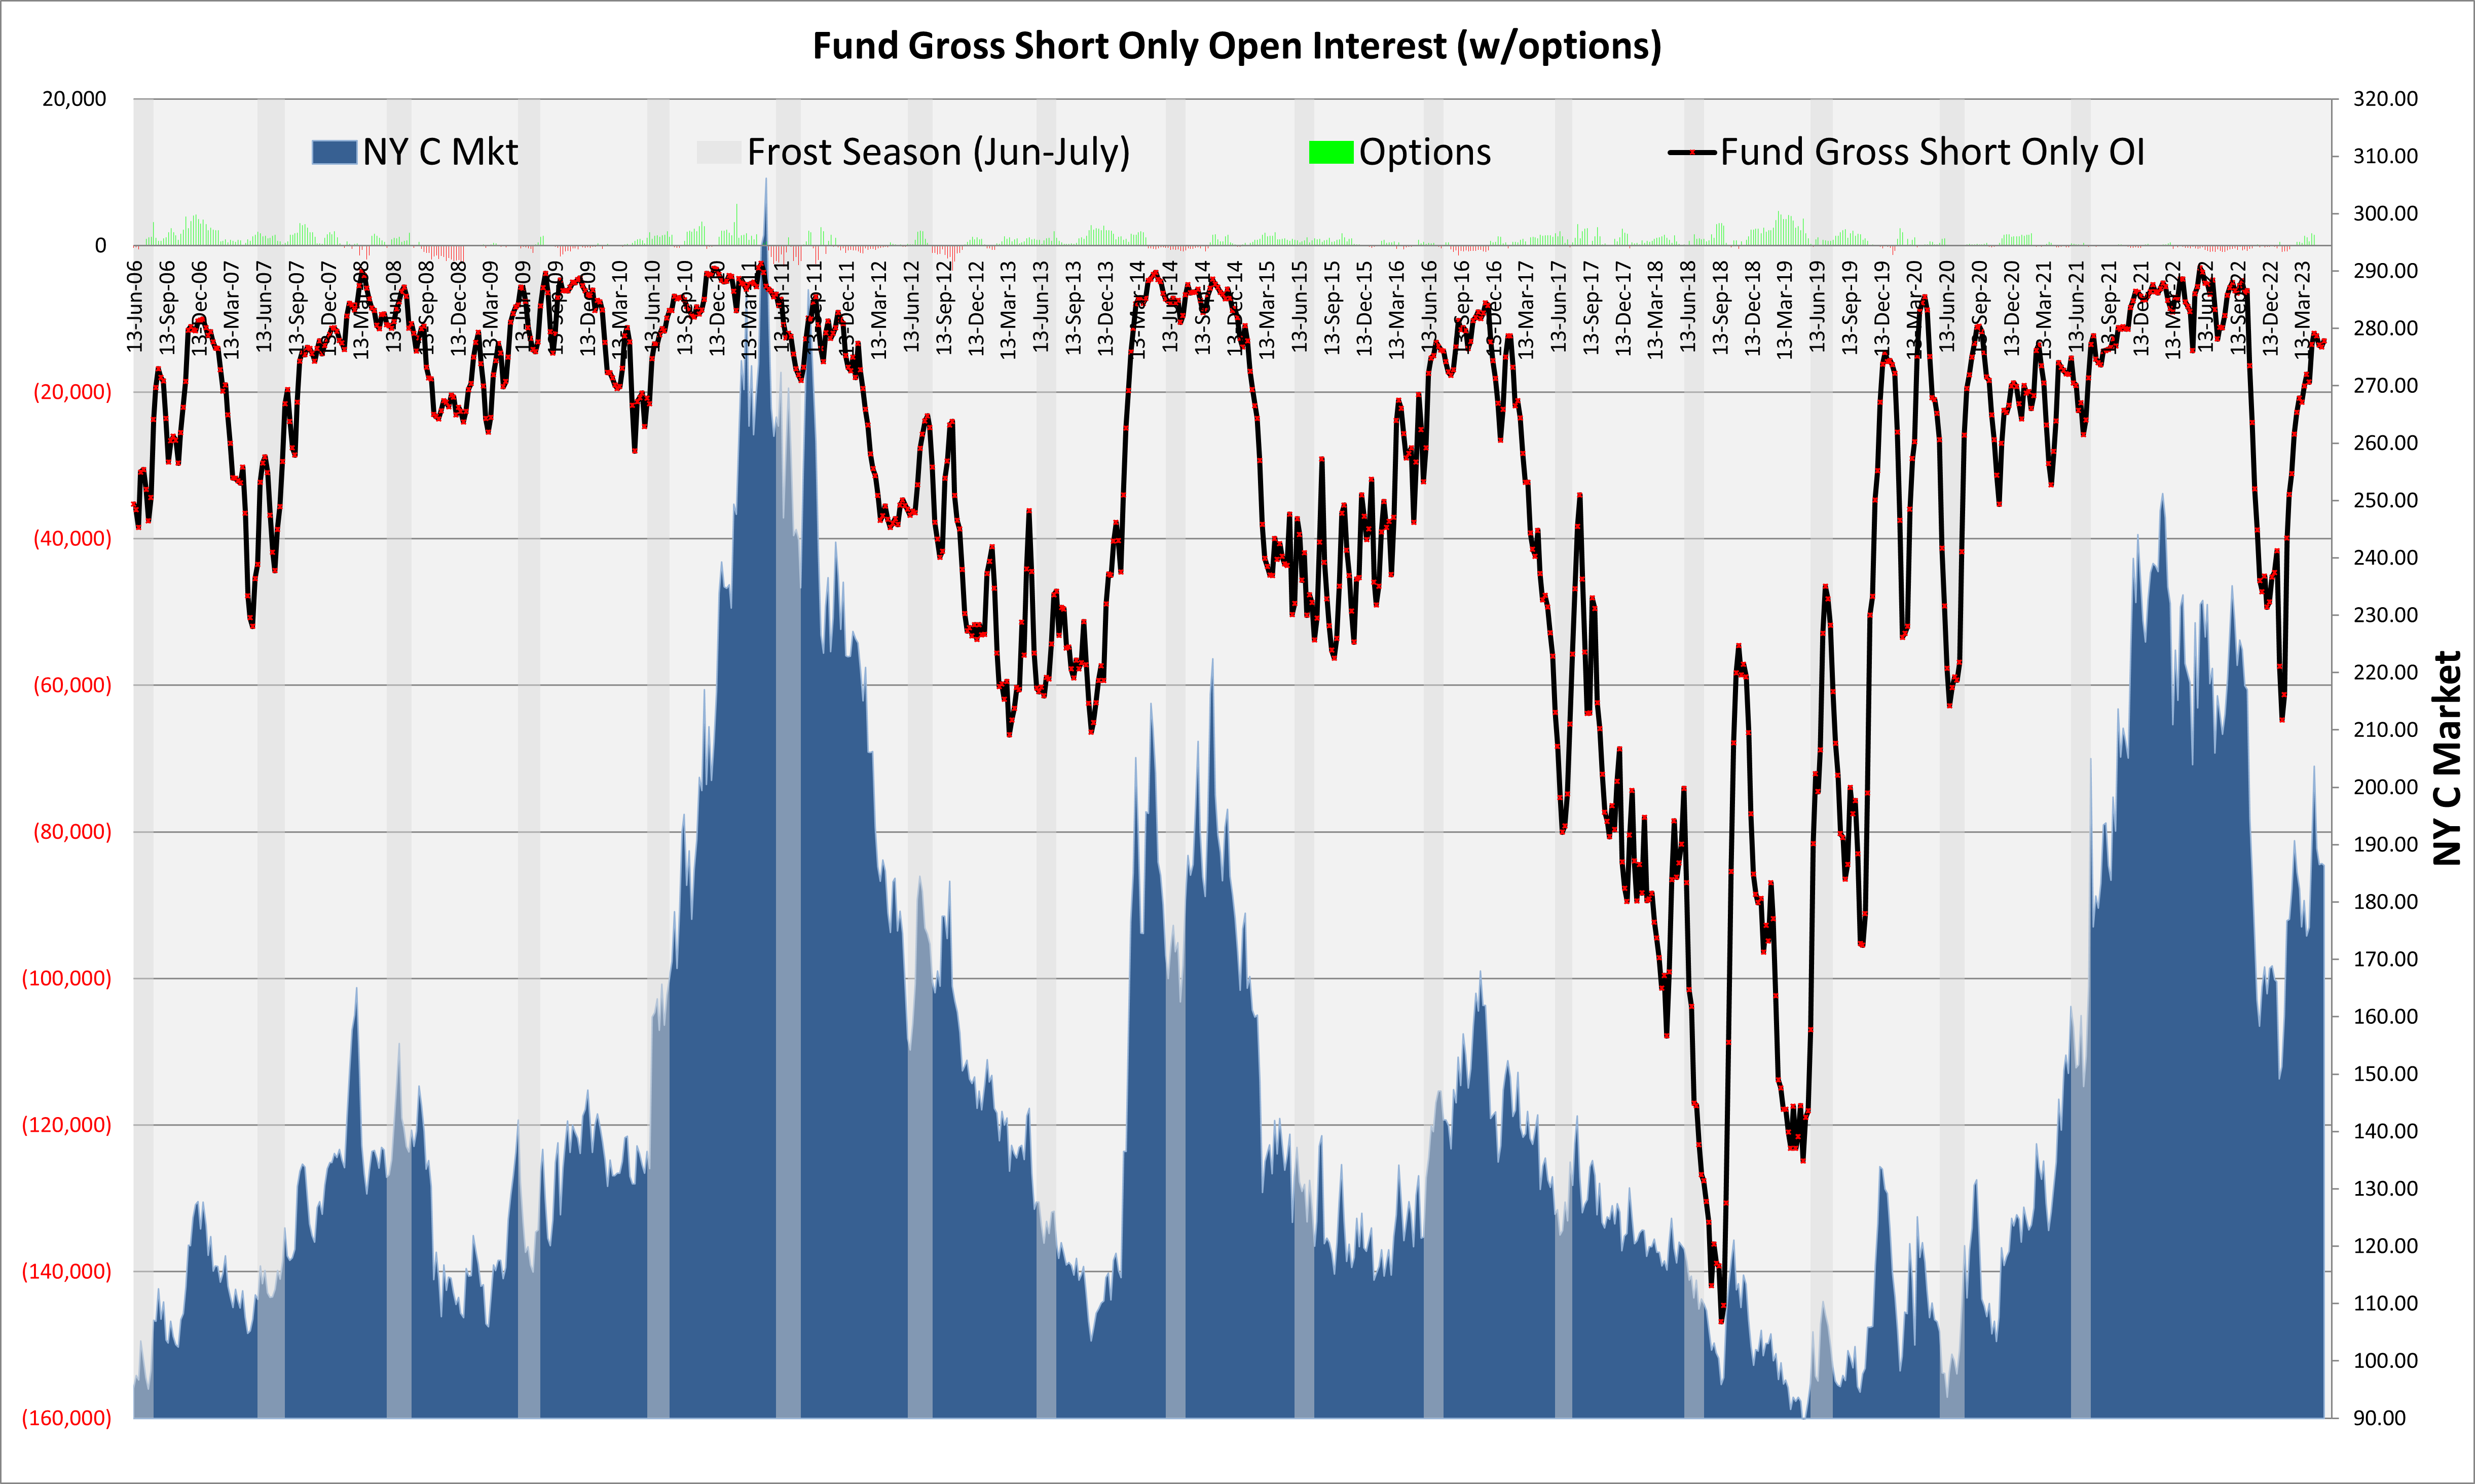
Managed Money
- Funds till quite long and not much more room for shorts to cover.
- Inverted market is in the longs favor.
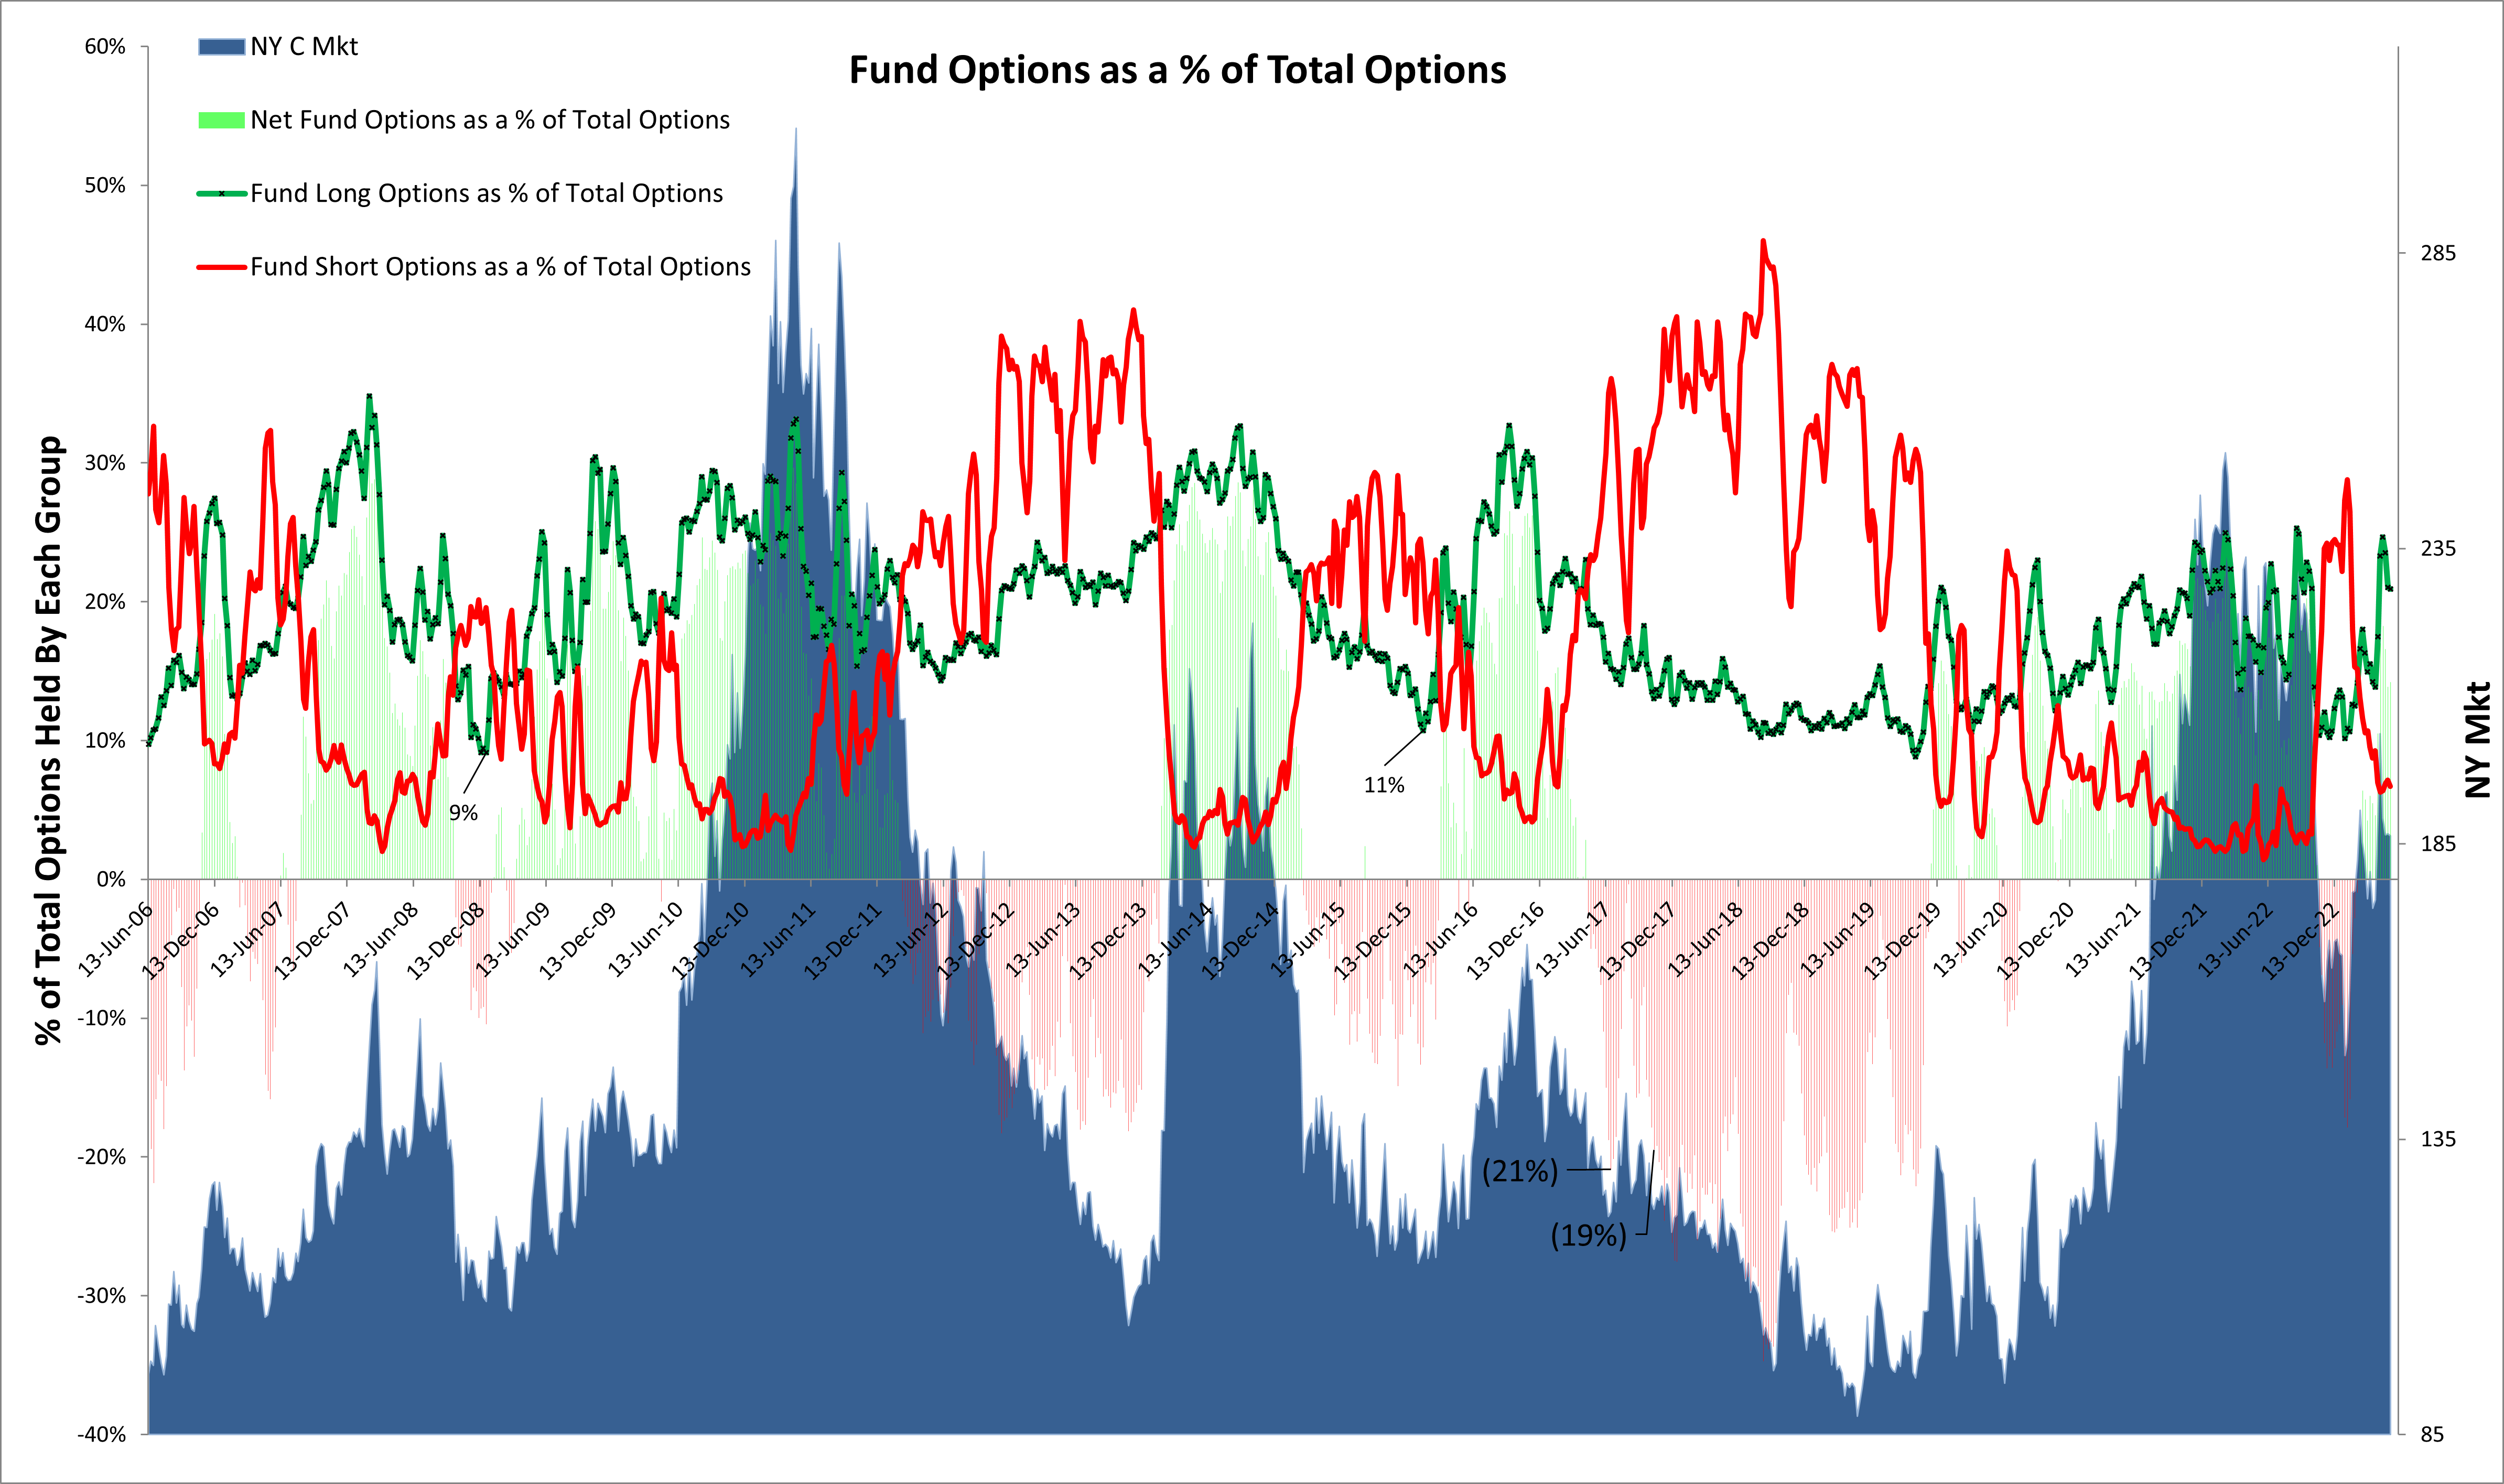
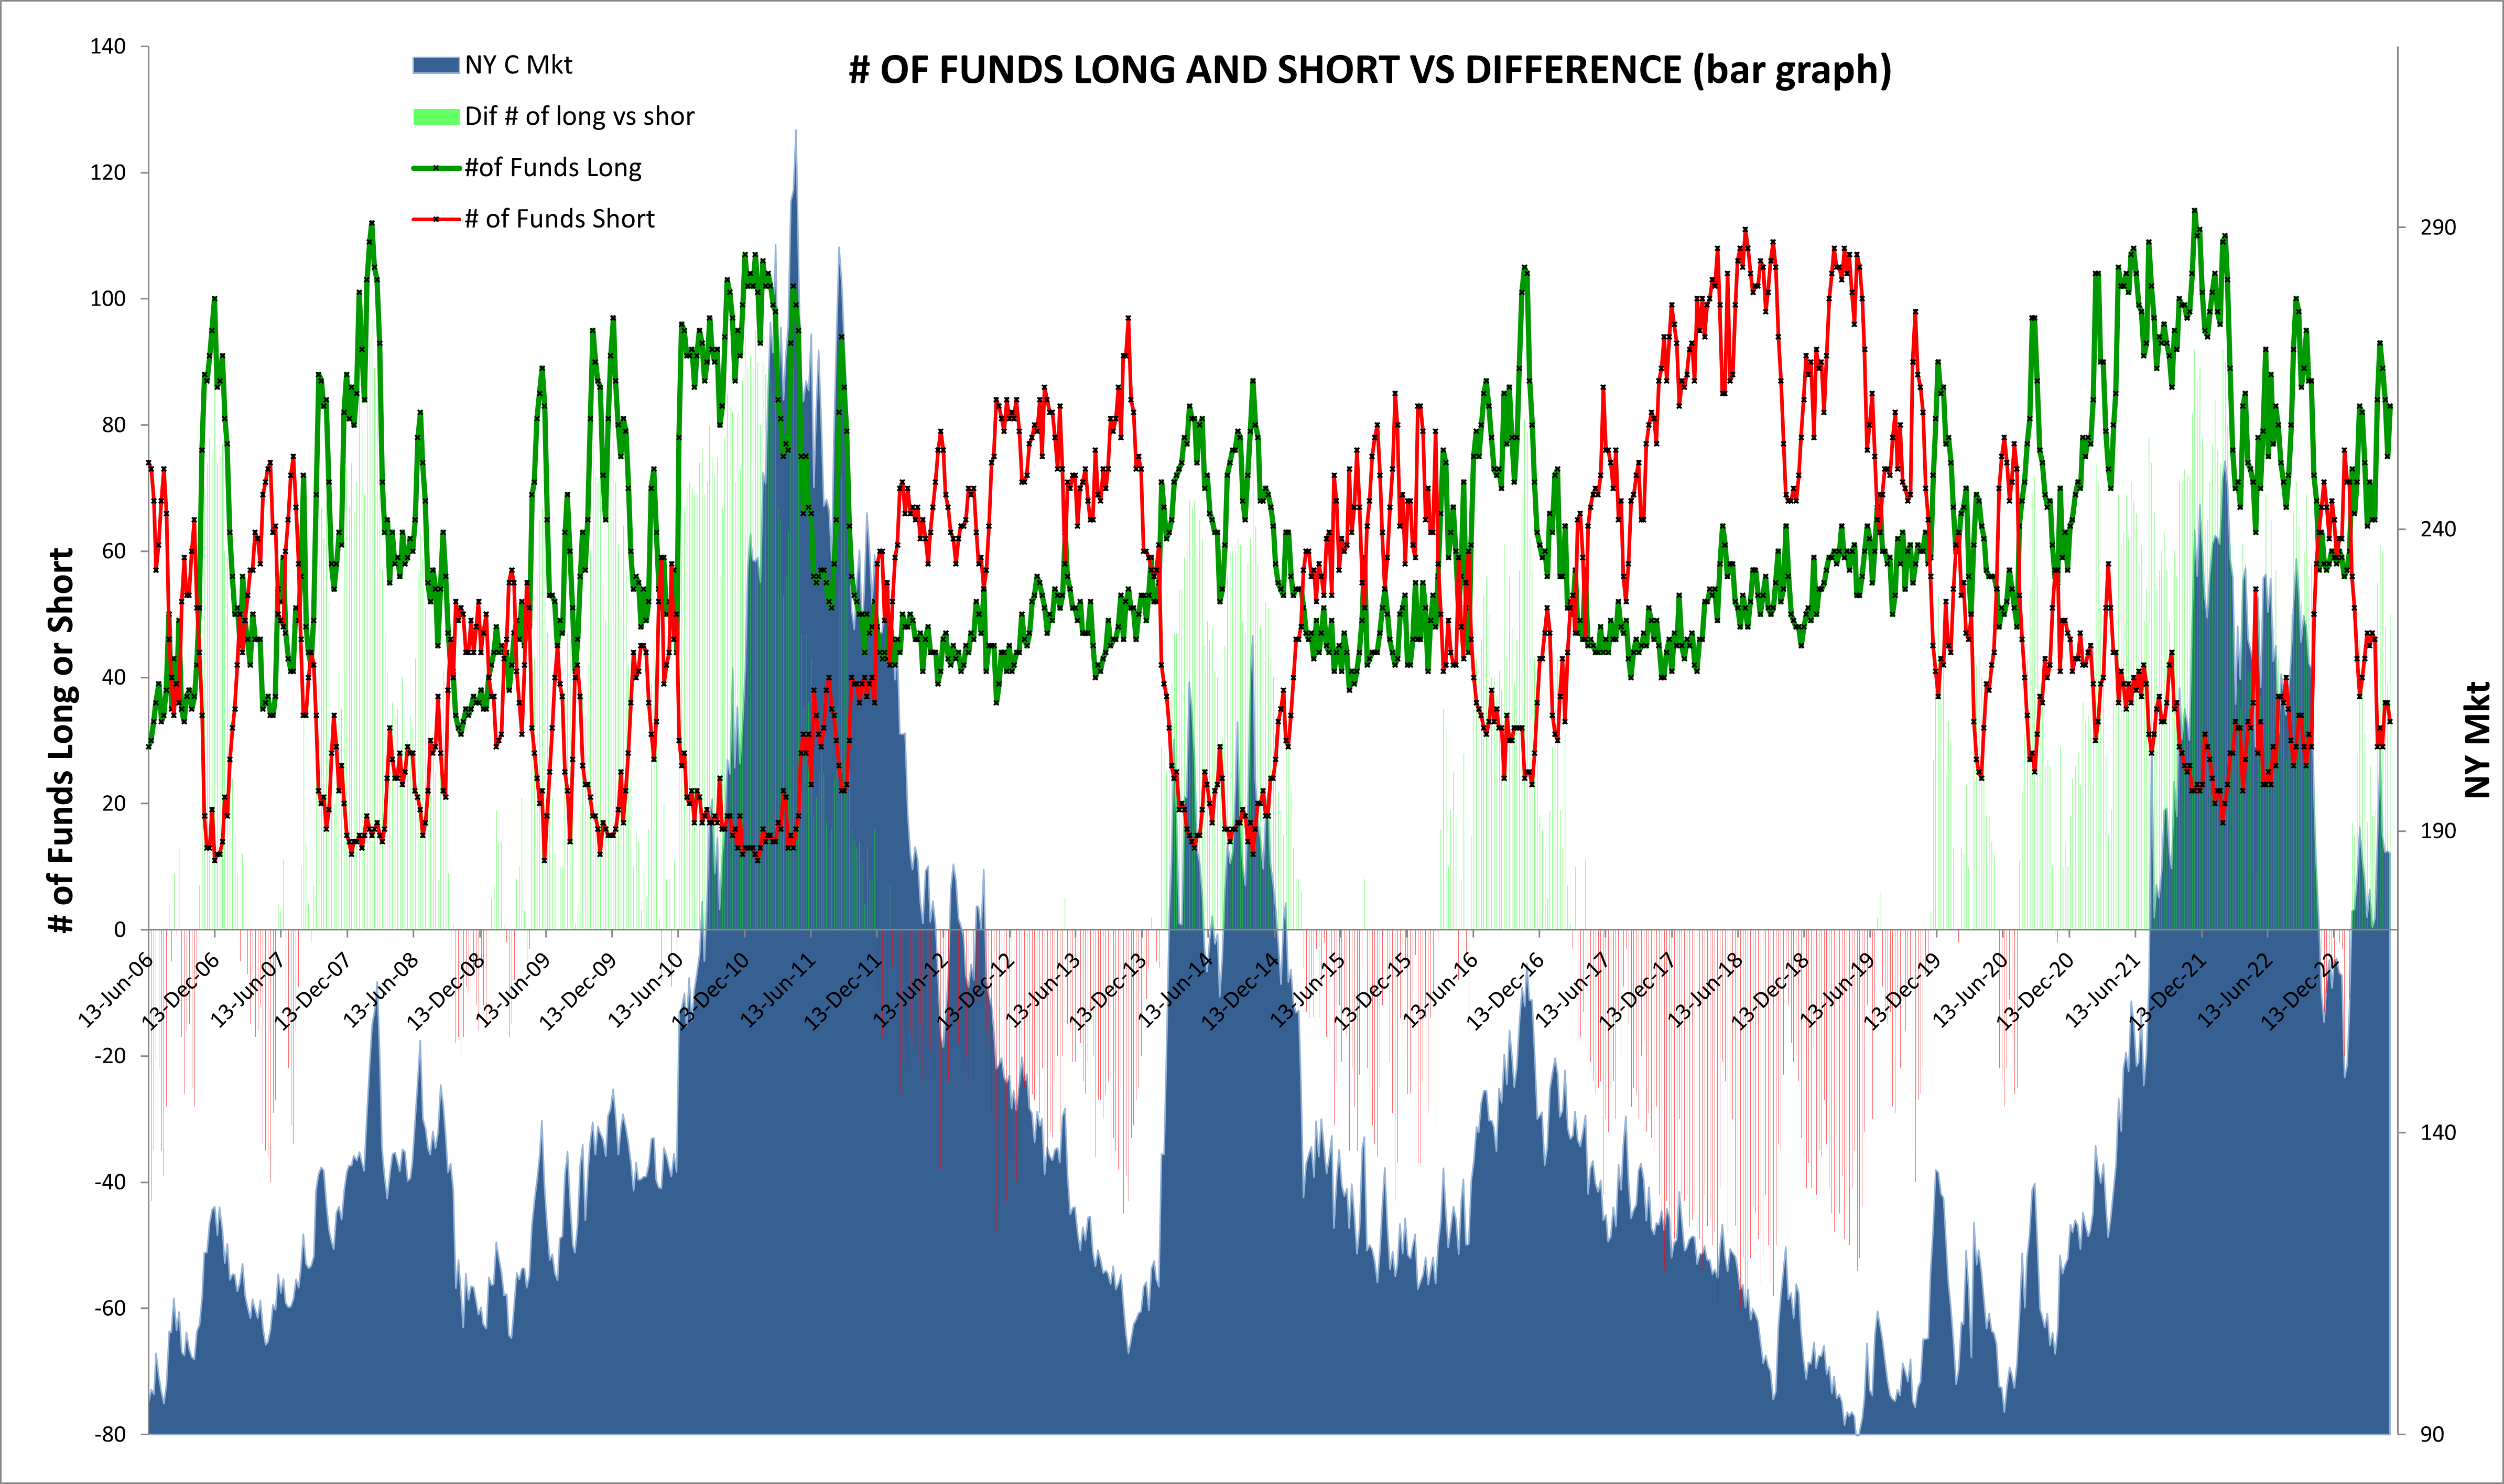
Managed Money – Options and # of Participants
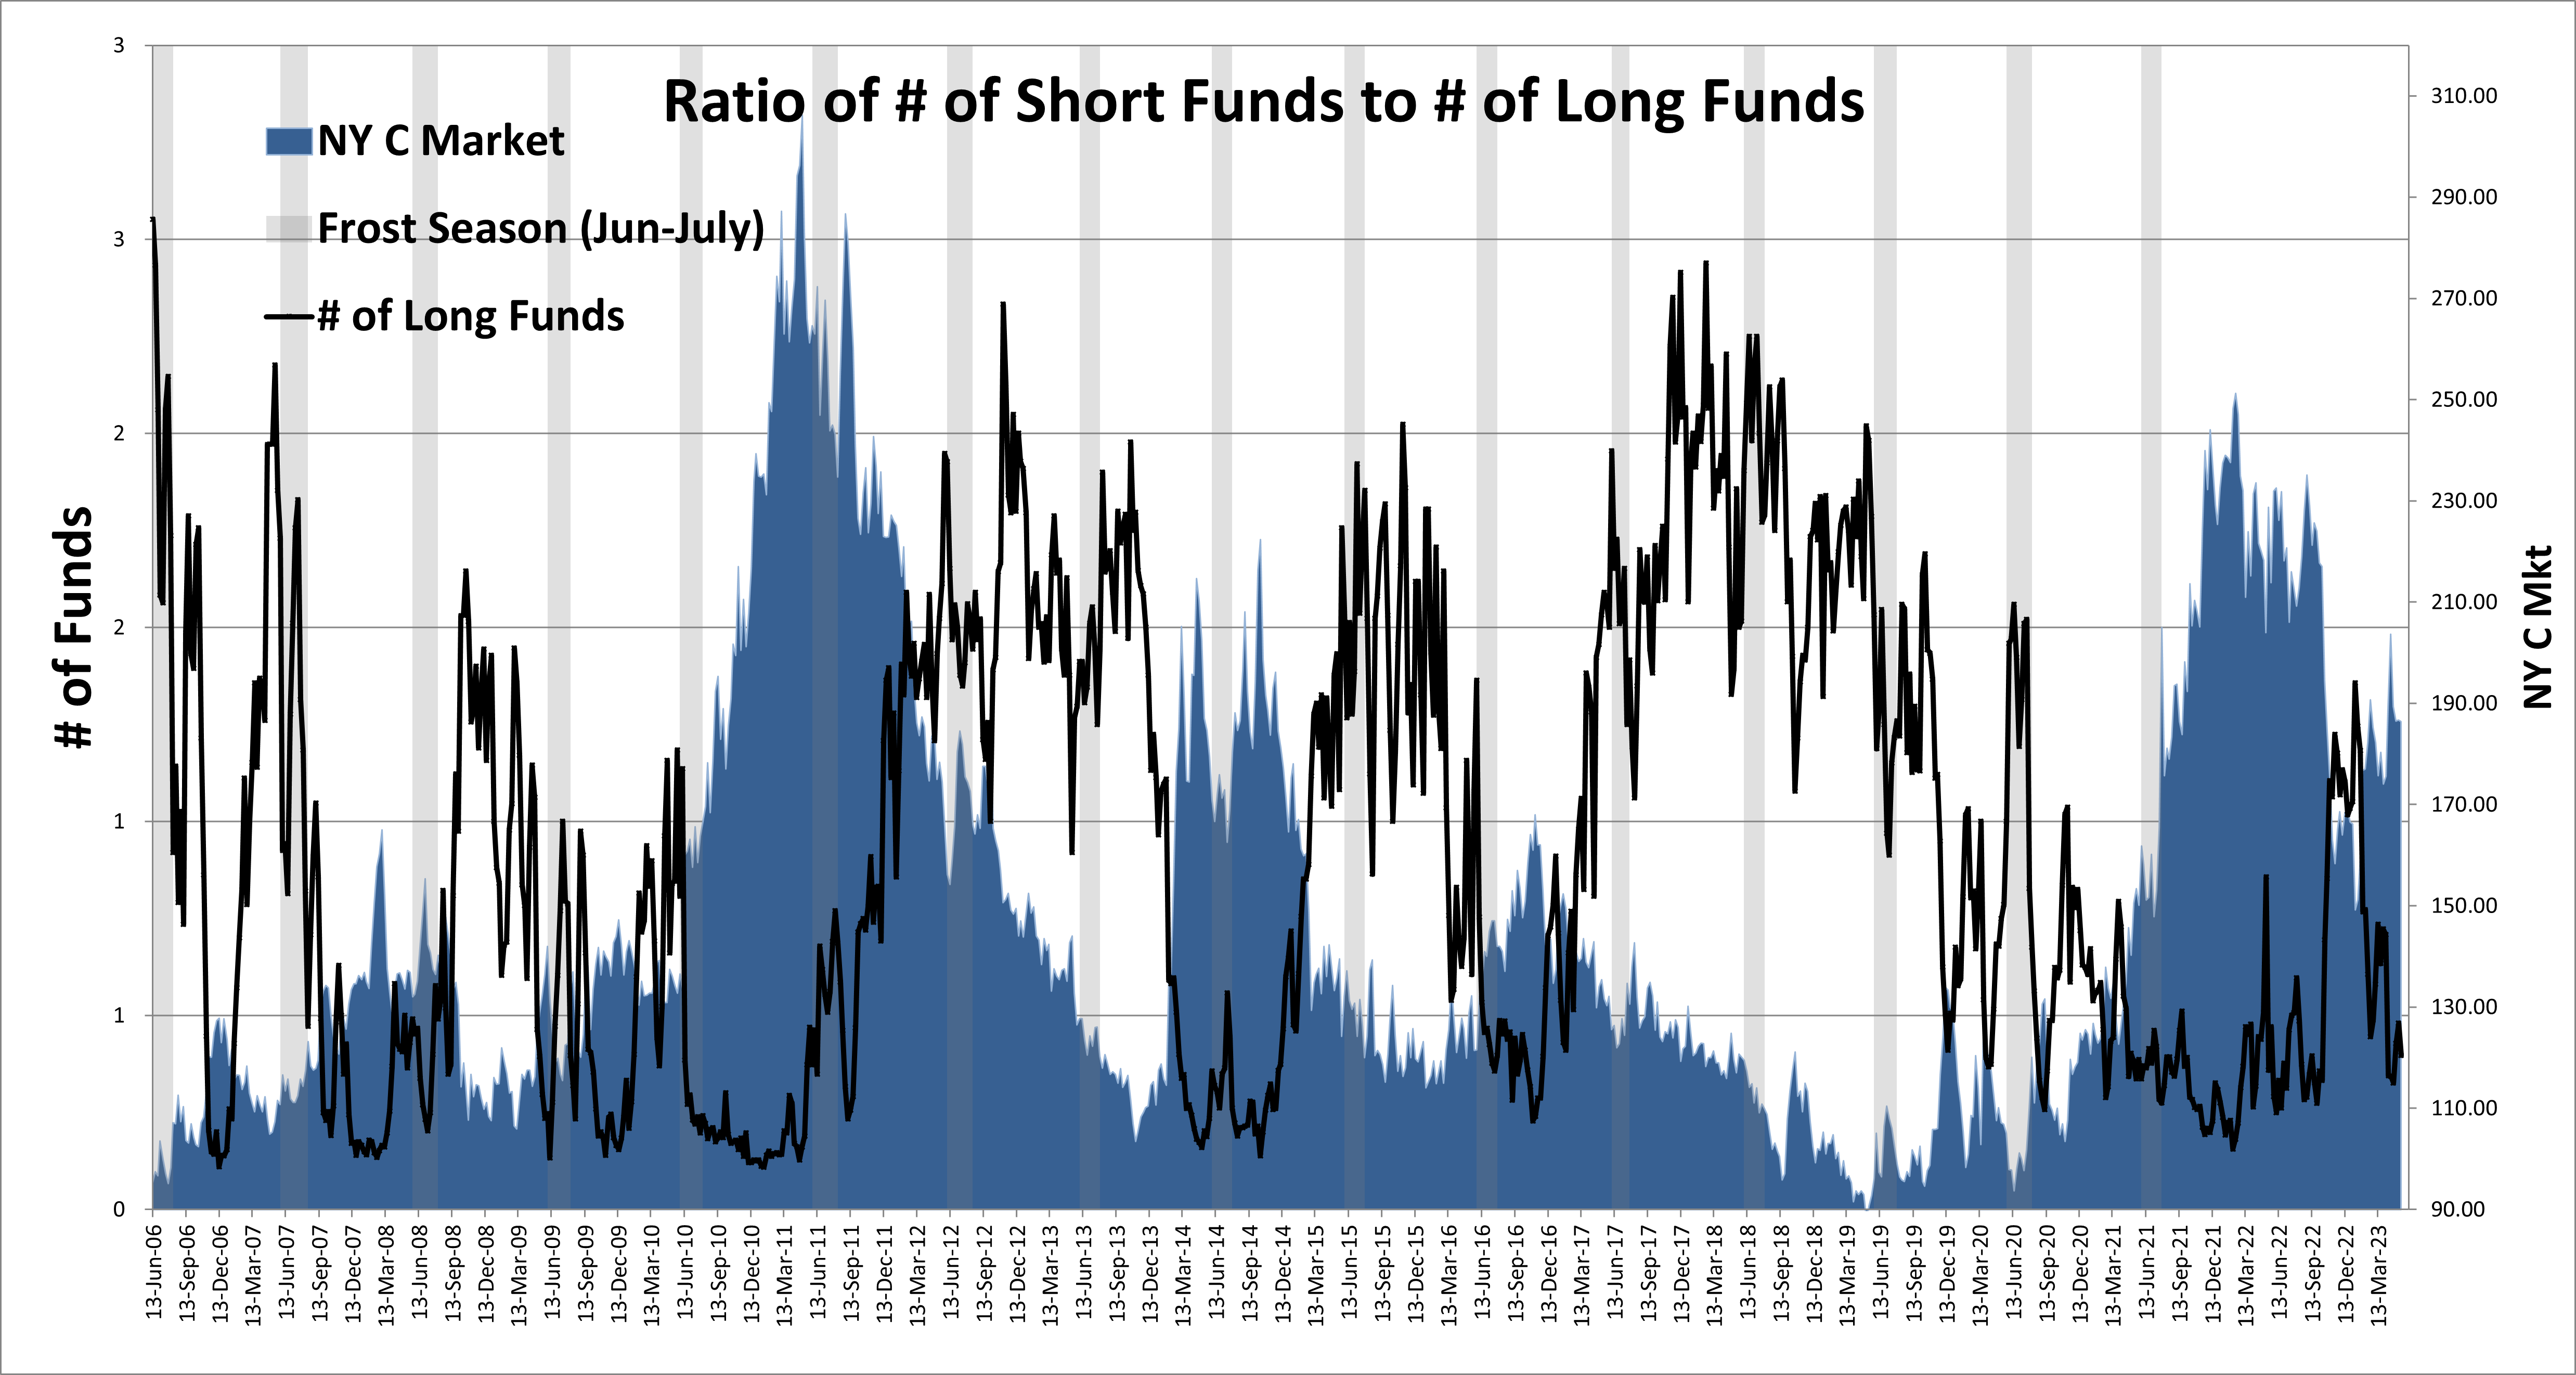
- First graph shows % of total open interest held by both Fund/MM longs (green) and shorts (red).
- These graphs have been good for capturing general trend.
- It is actually more bullish than bearish, but inconclusive.
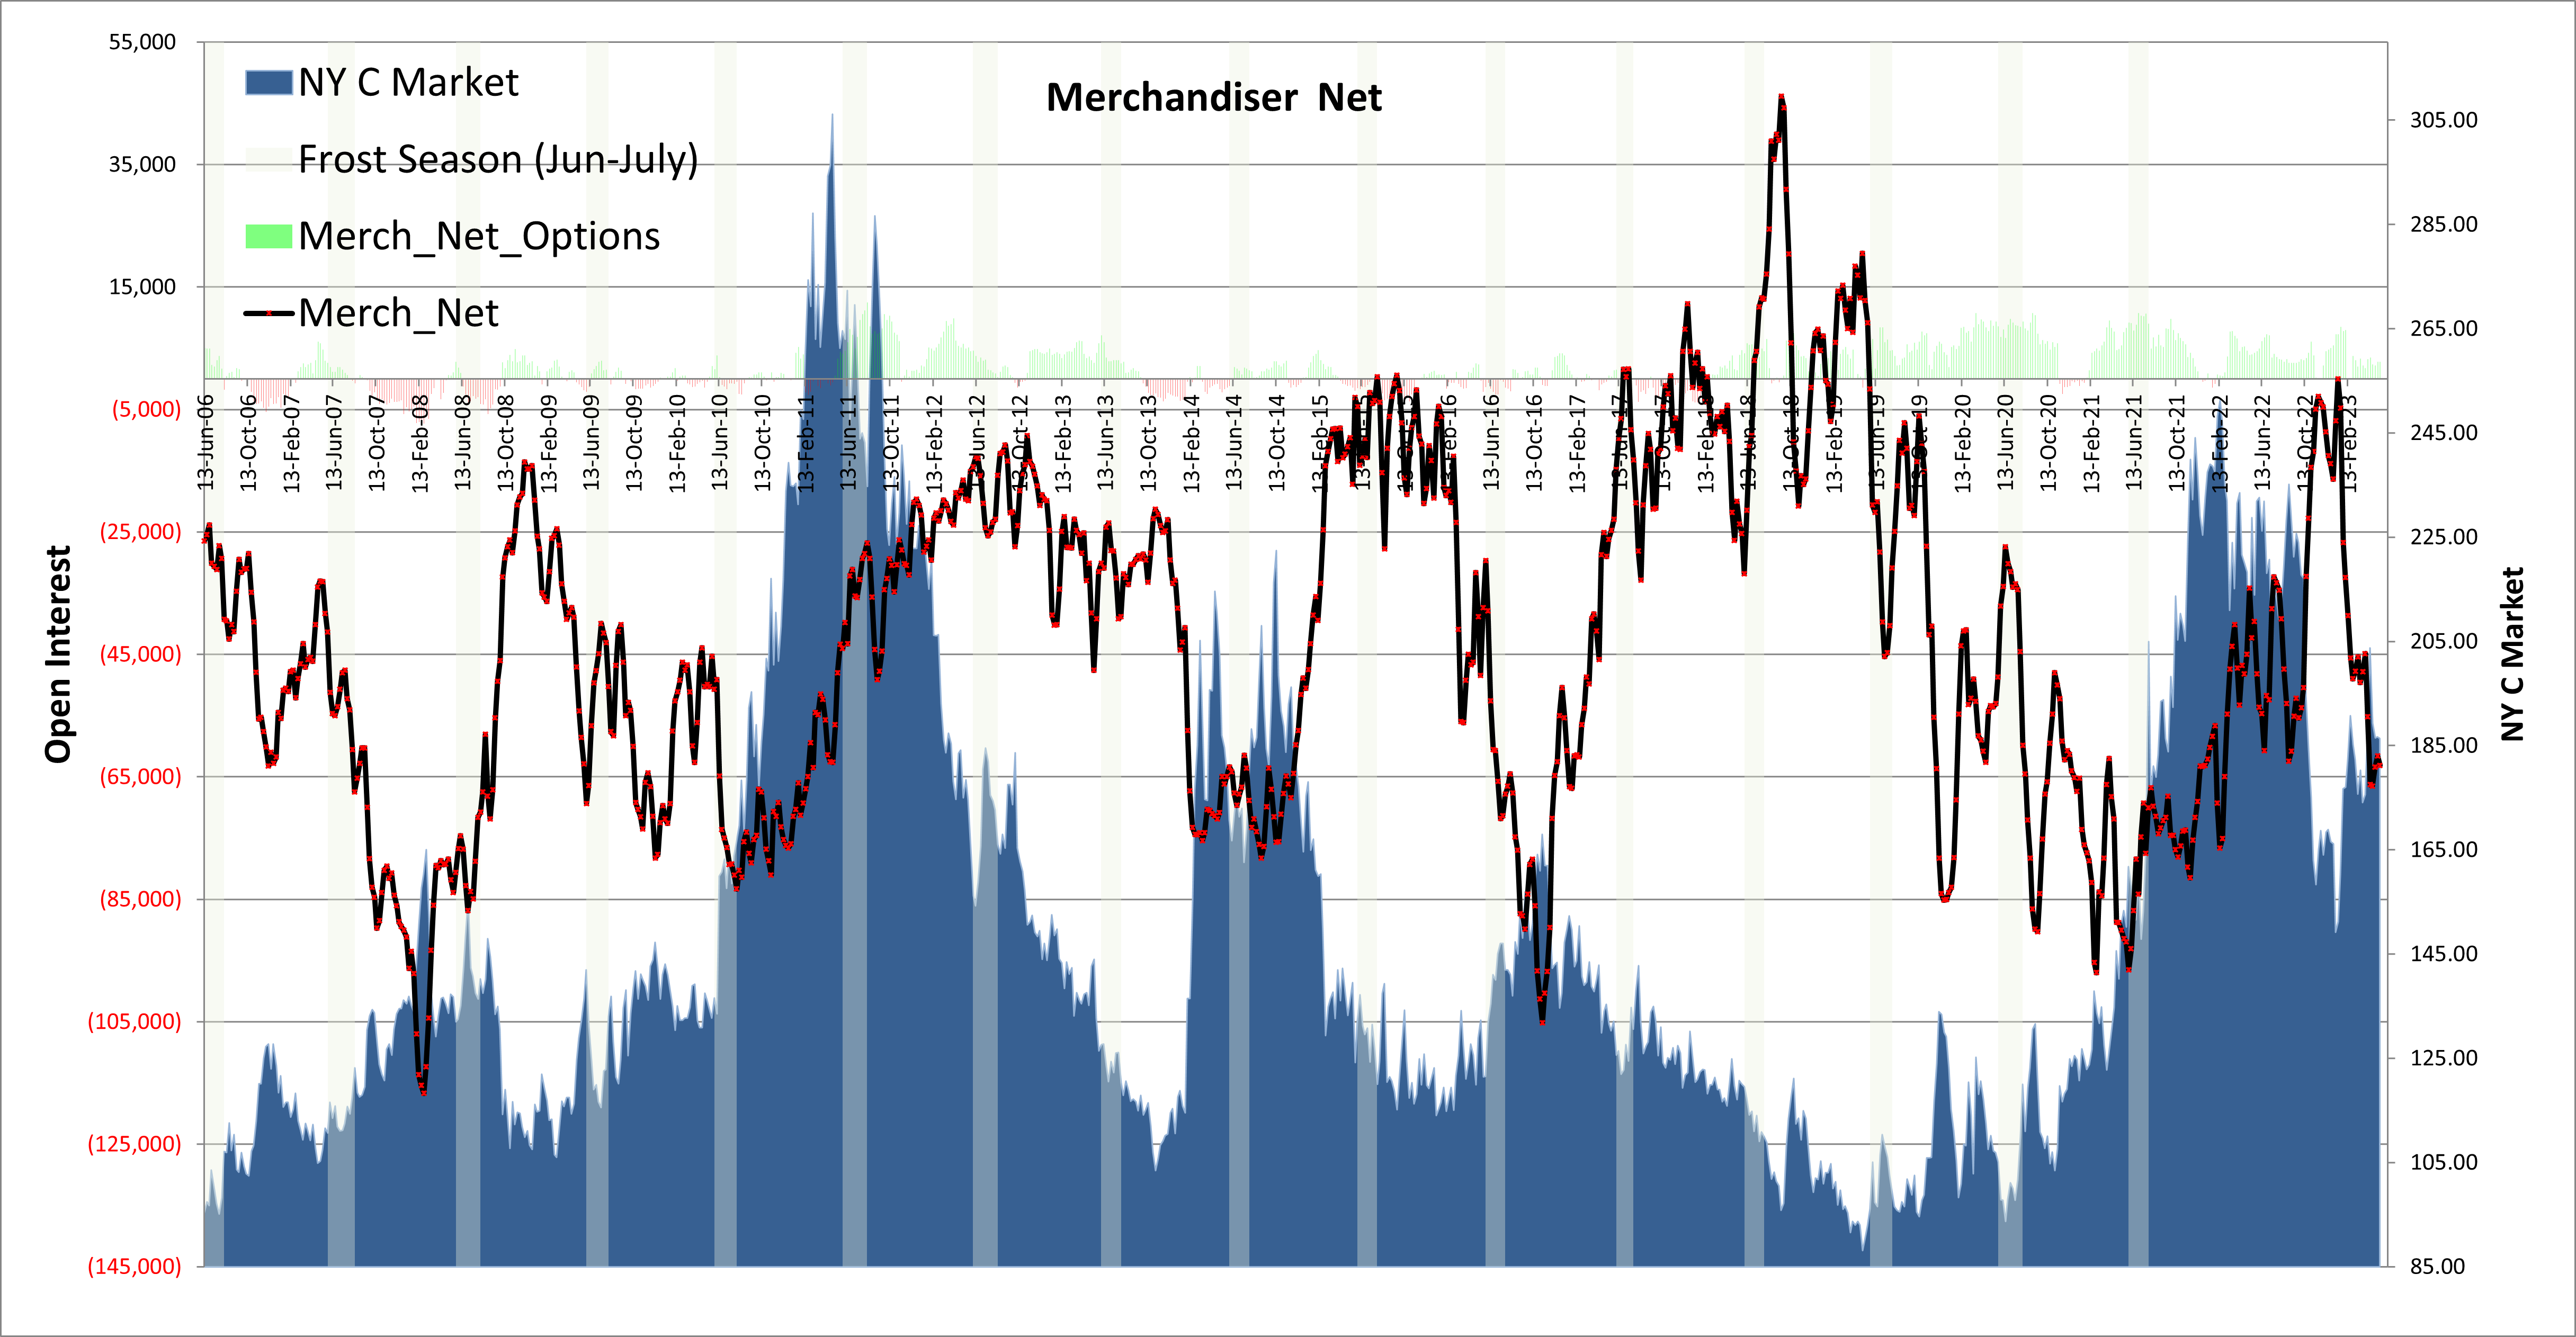
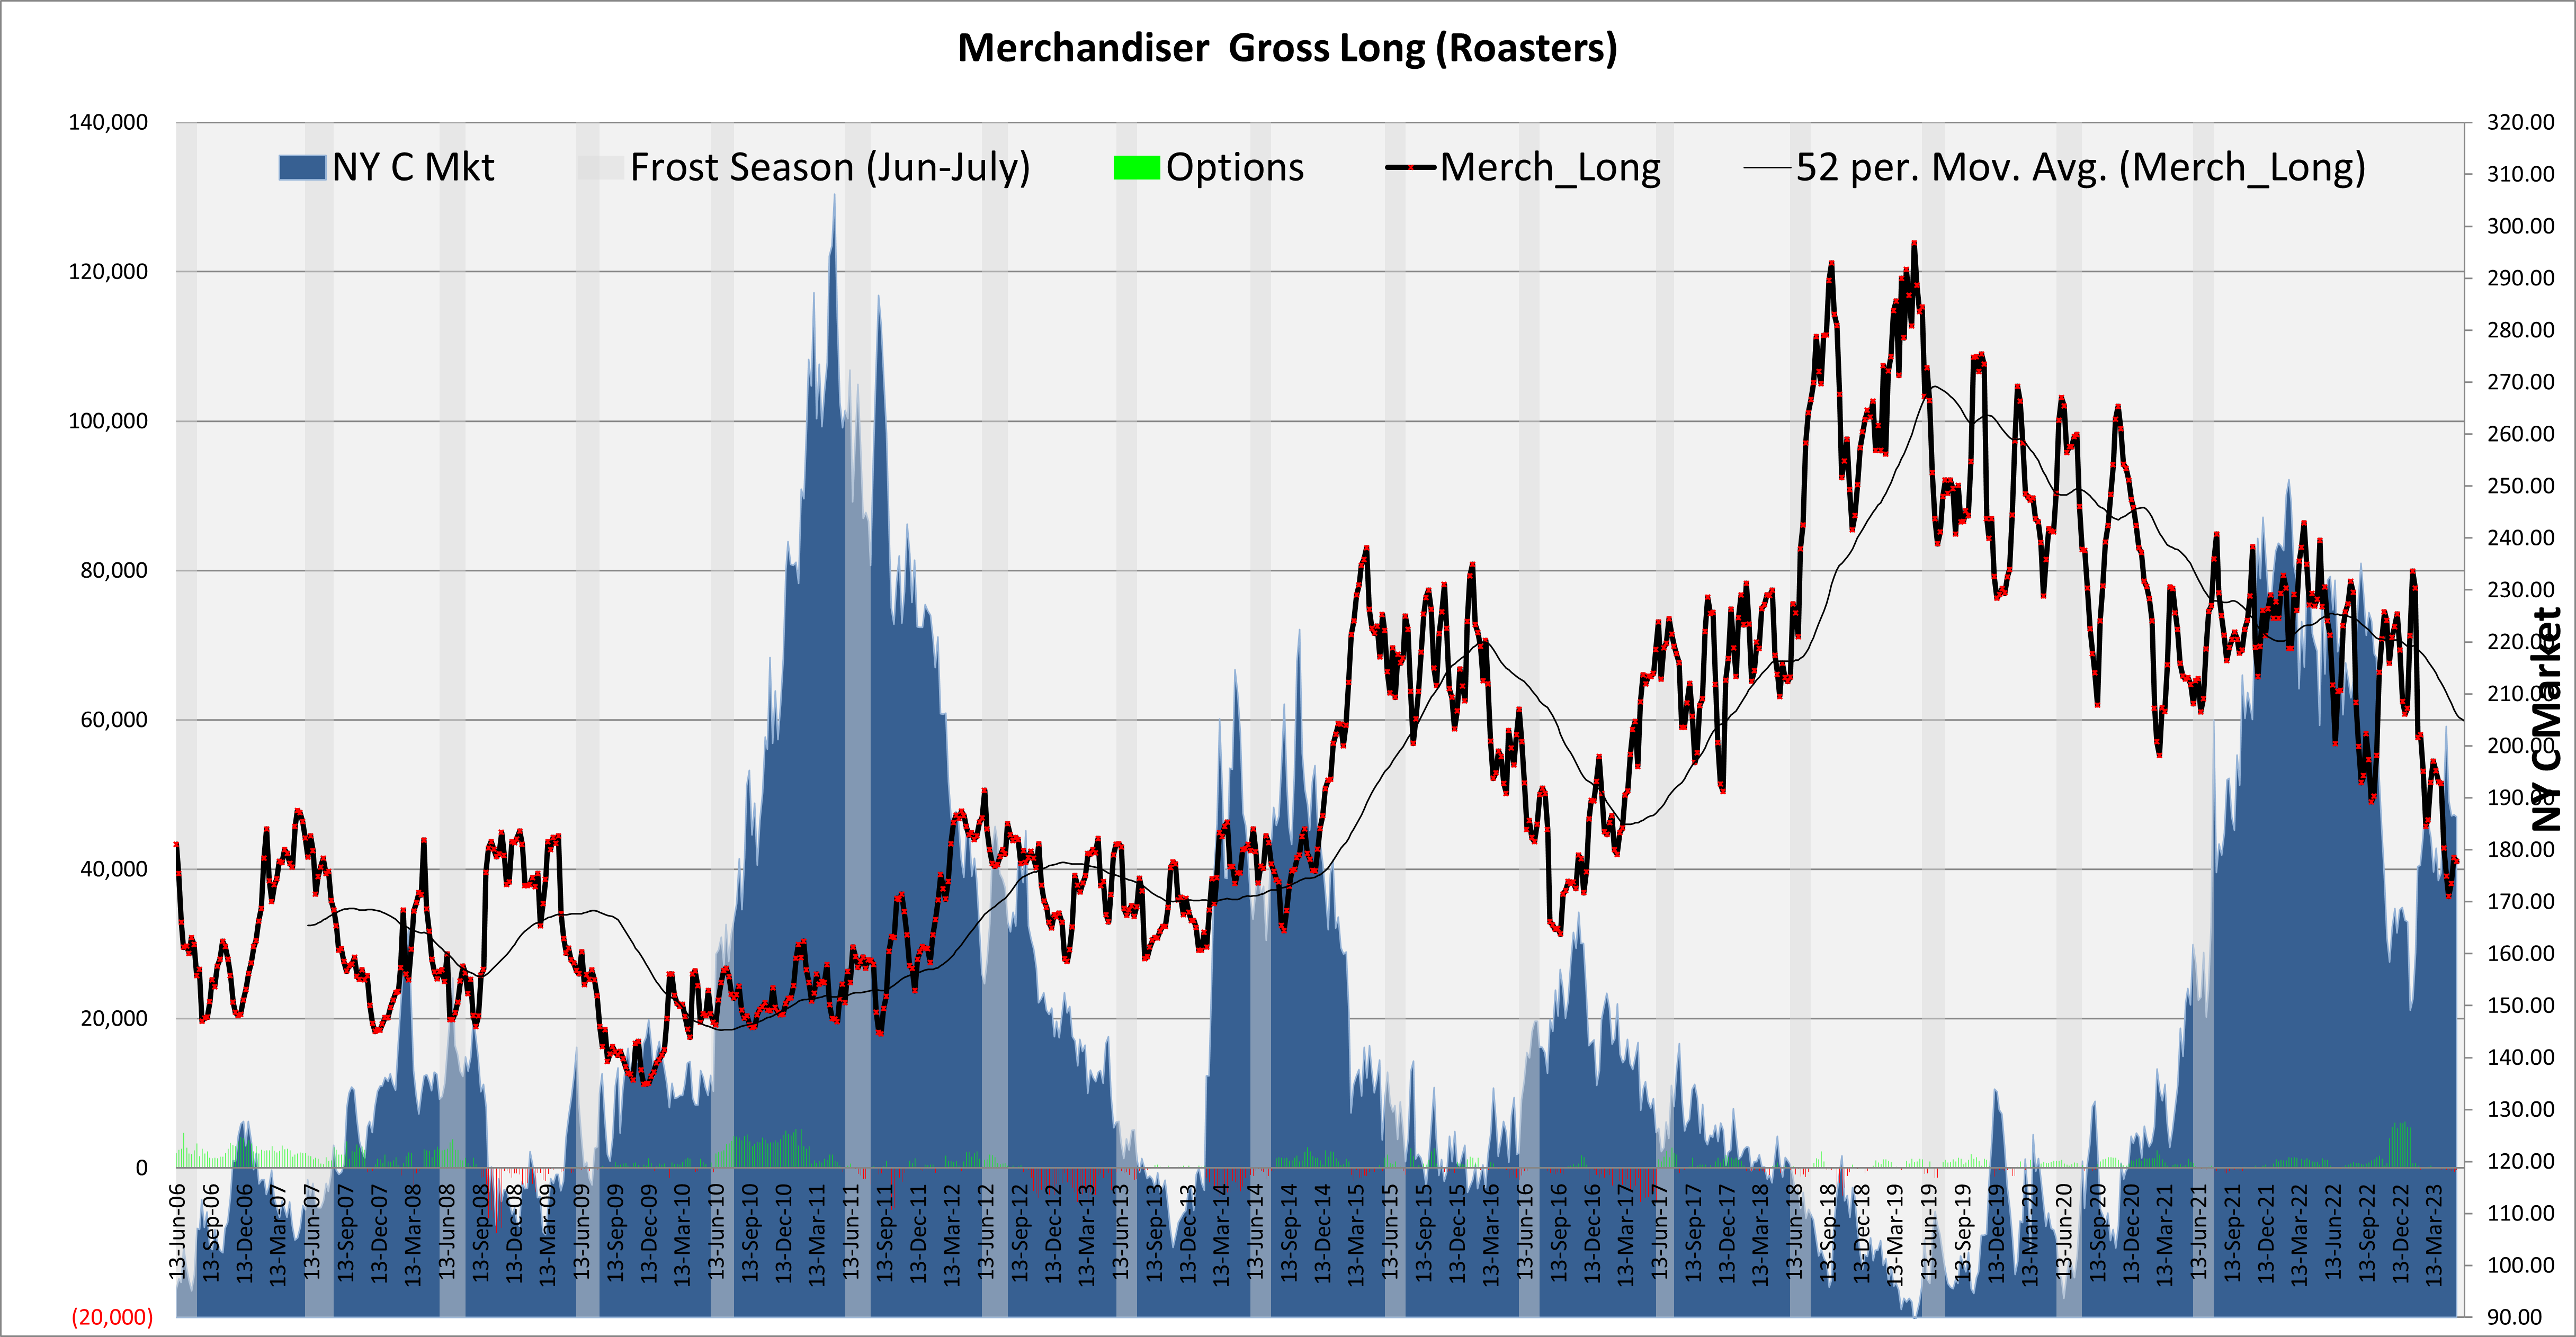
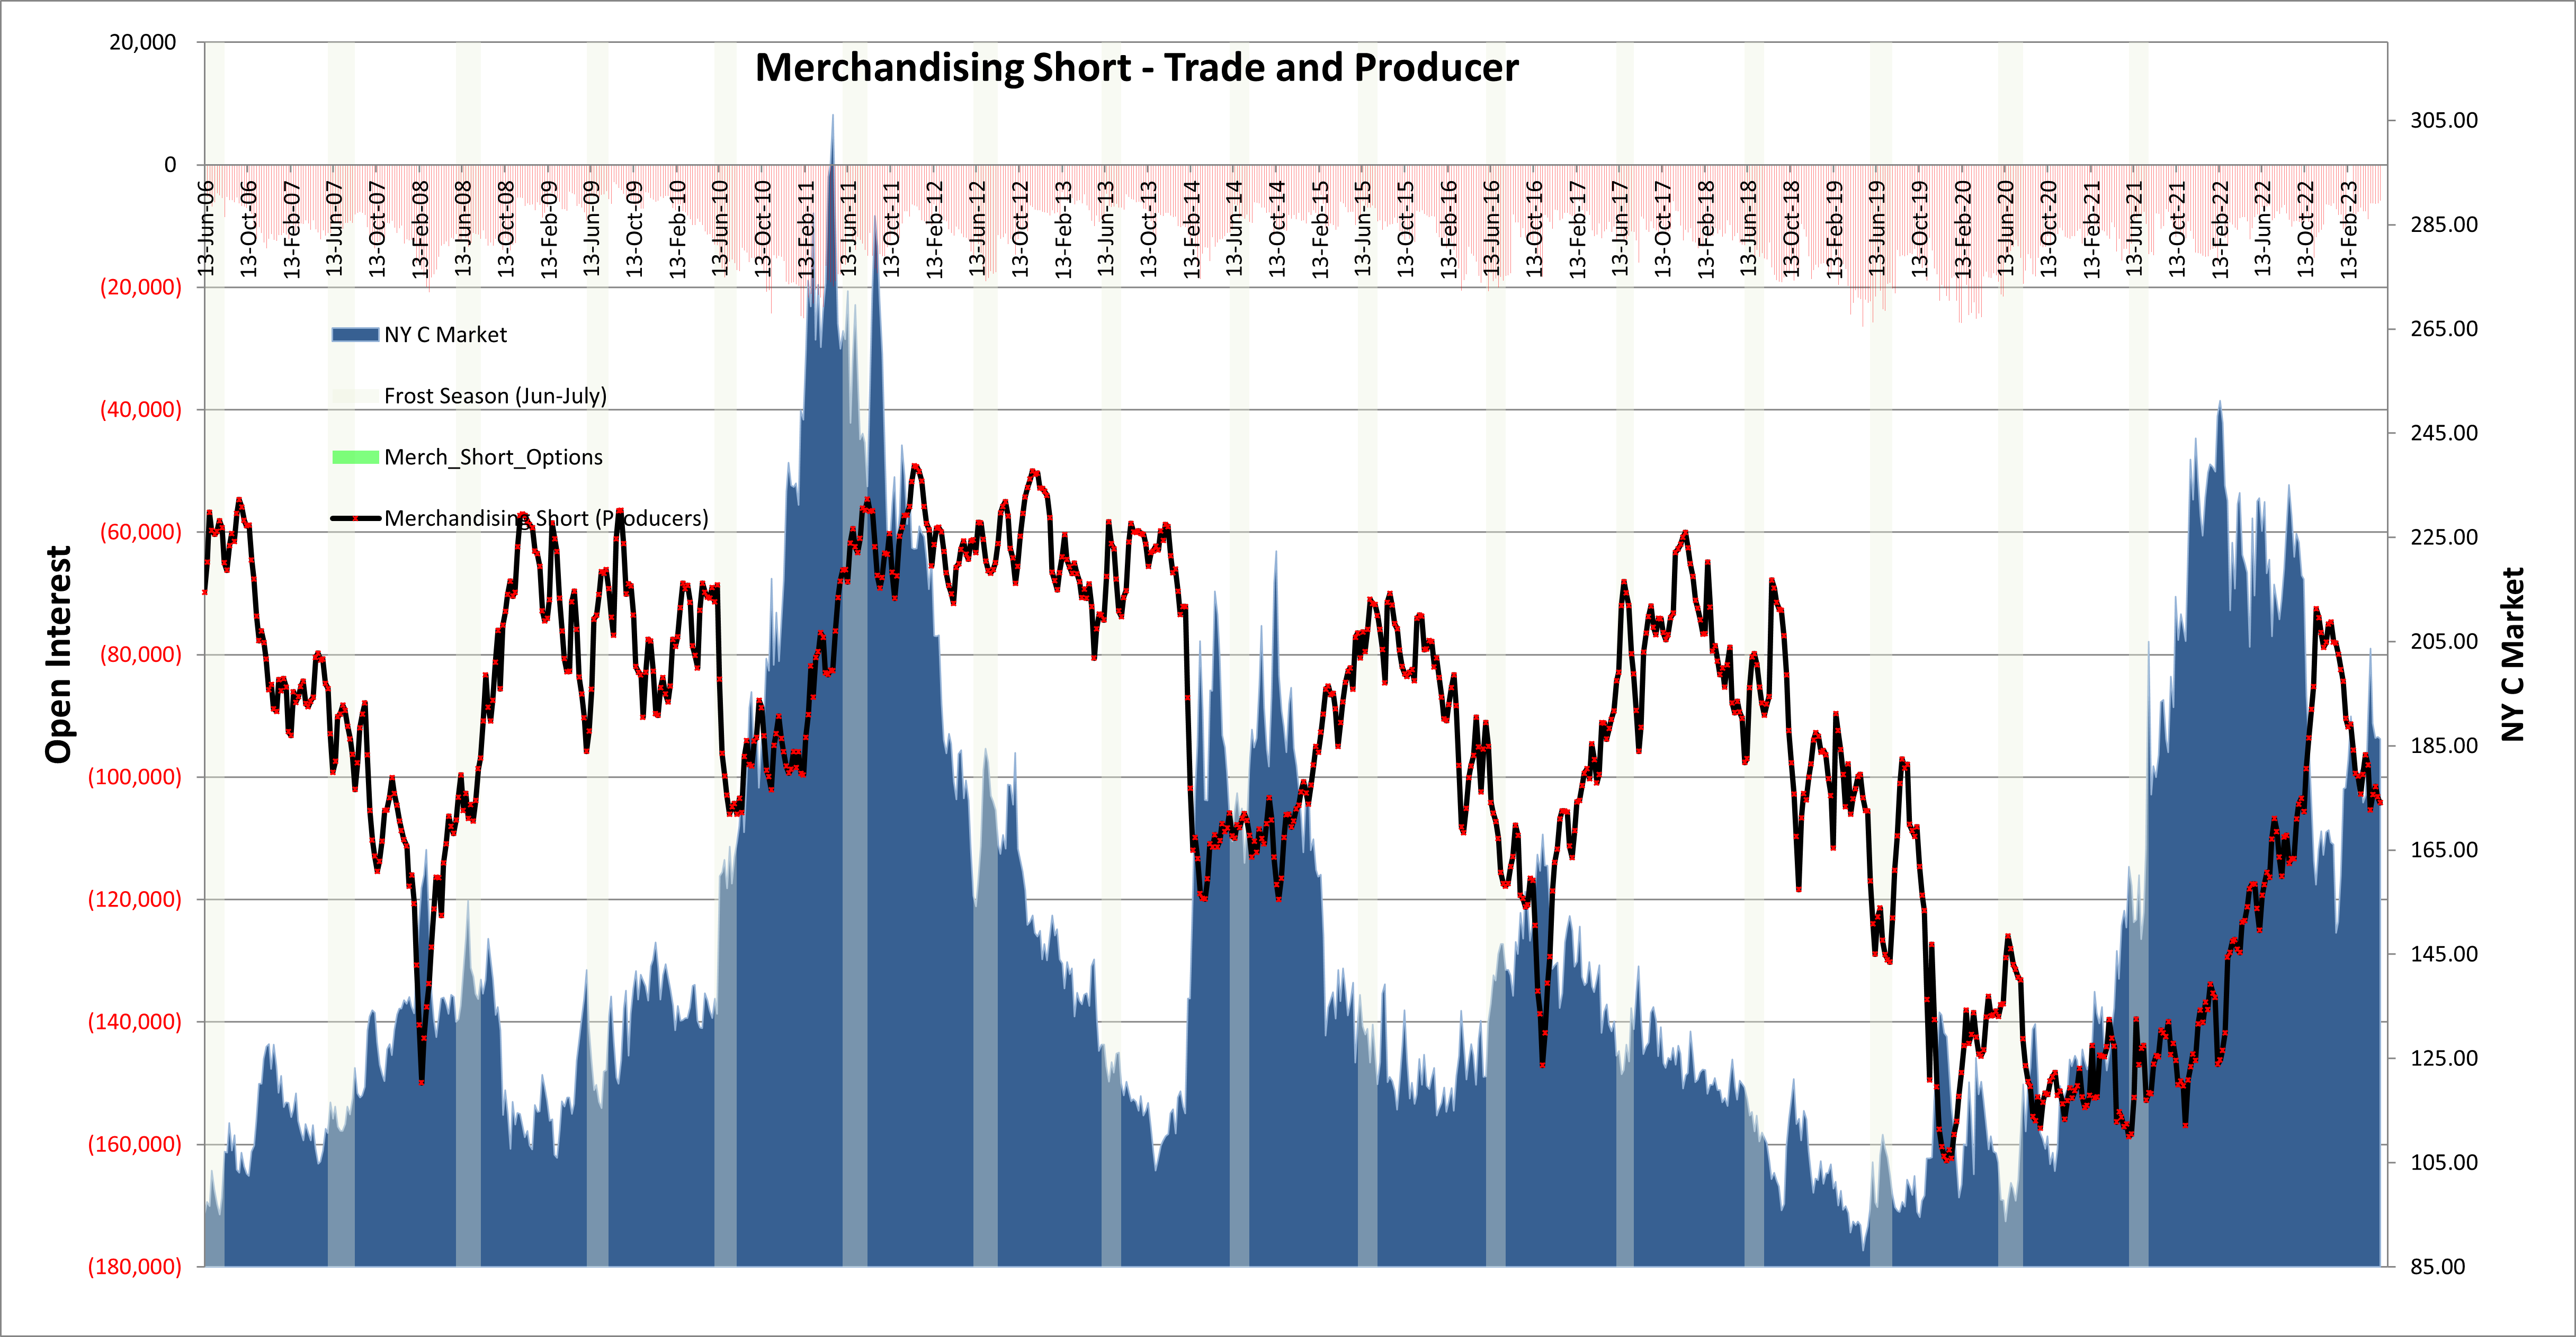
Merchandising
- What really stands out is how far behind the roaster is. This could be come problematic for bears if there are frost concerns.
- However, also important to note is that last time the roasters were this undercovered, the market ground down from 170 to 90.
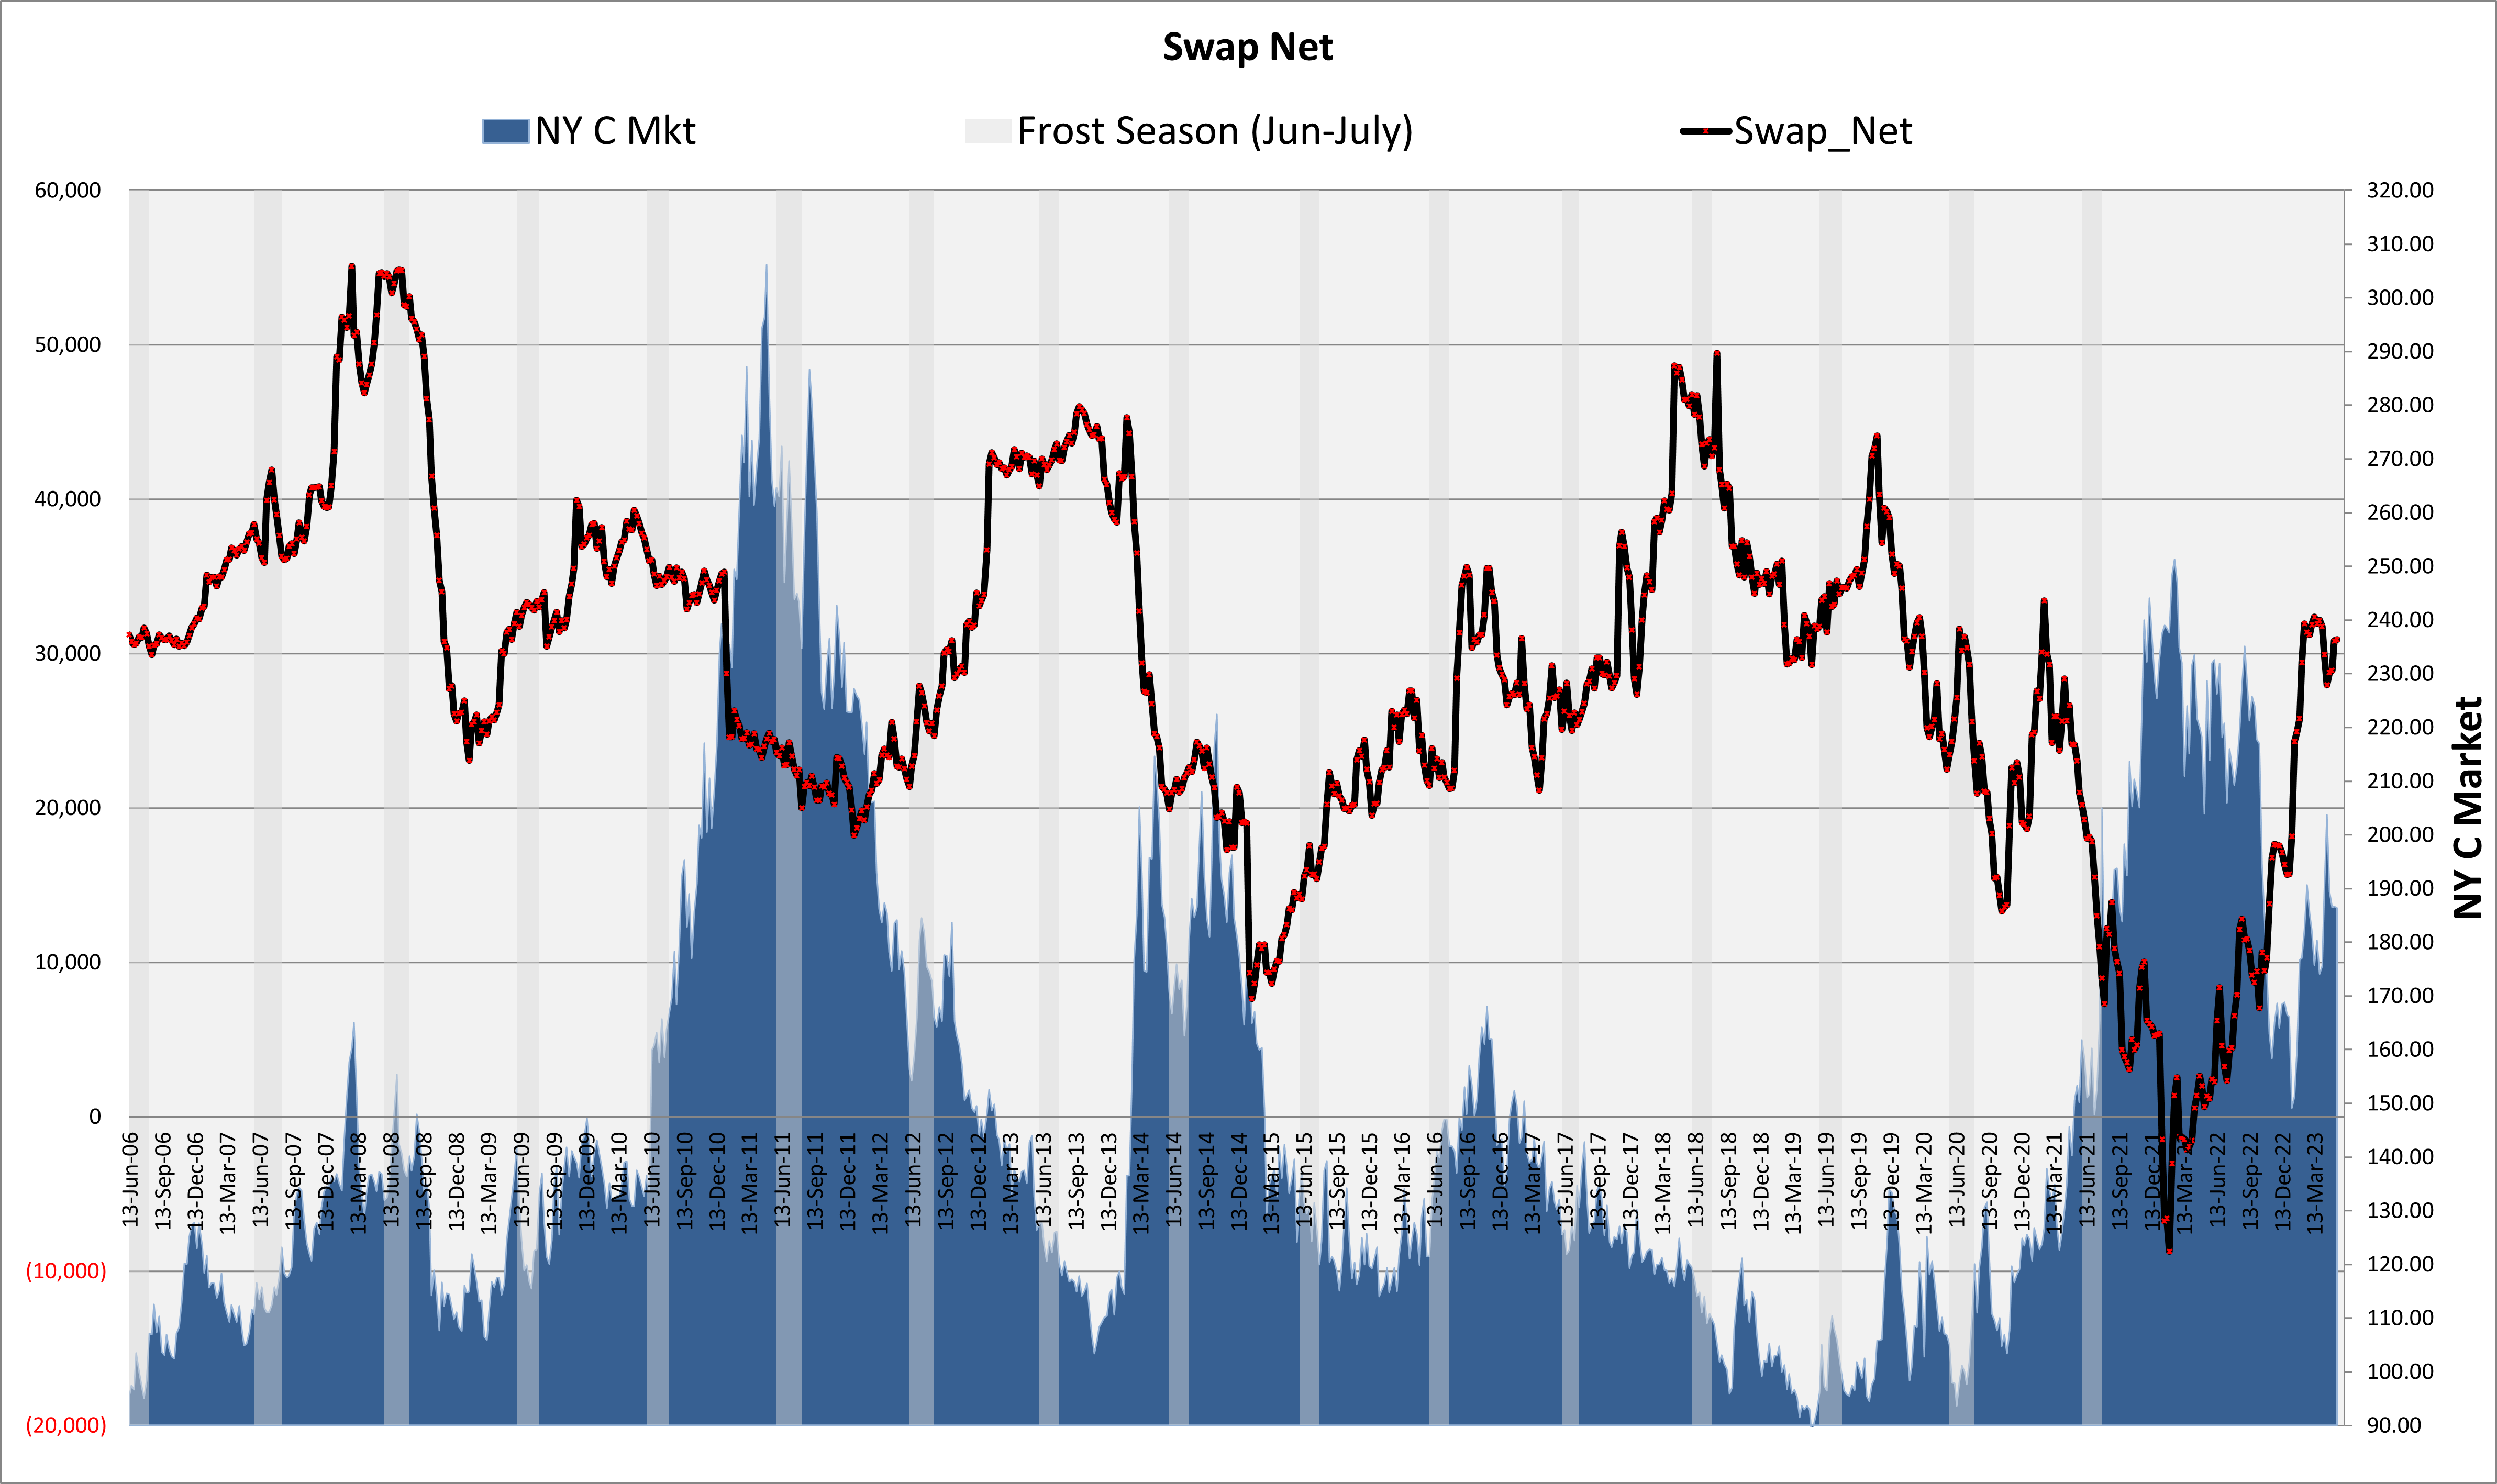
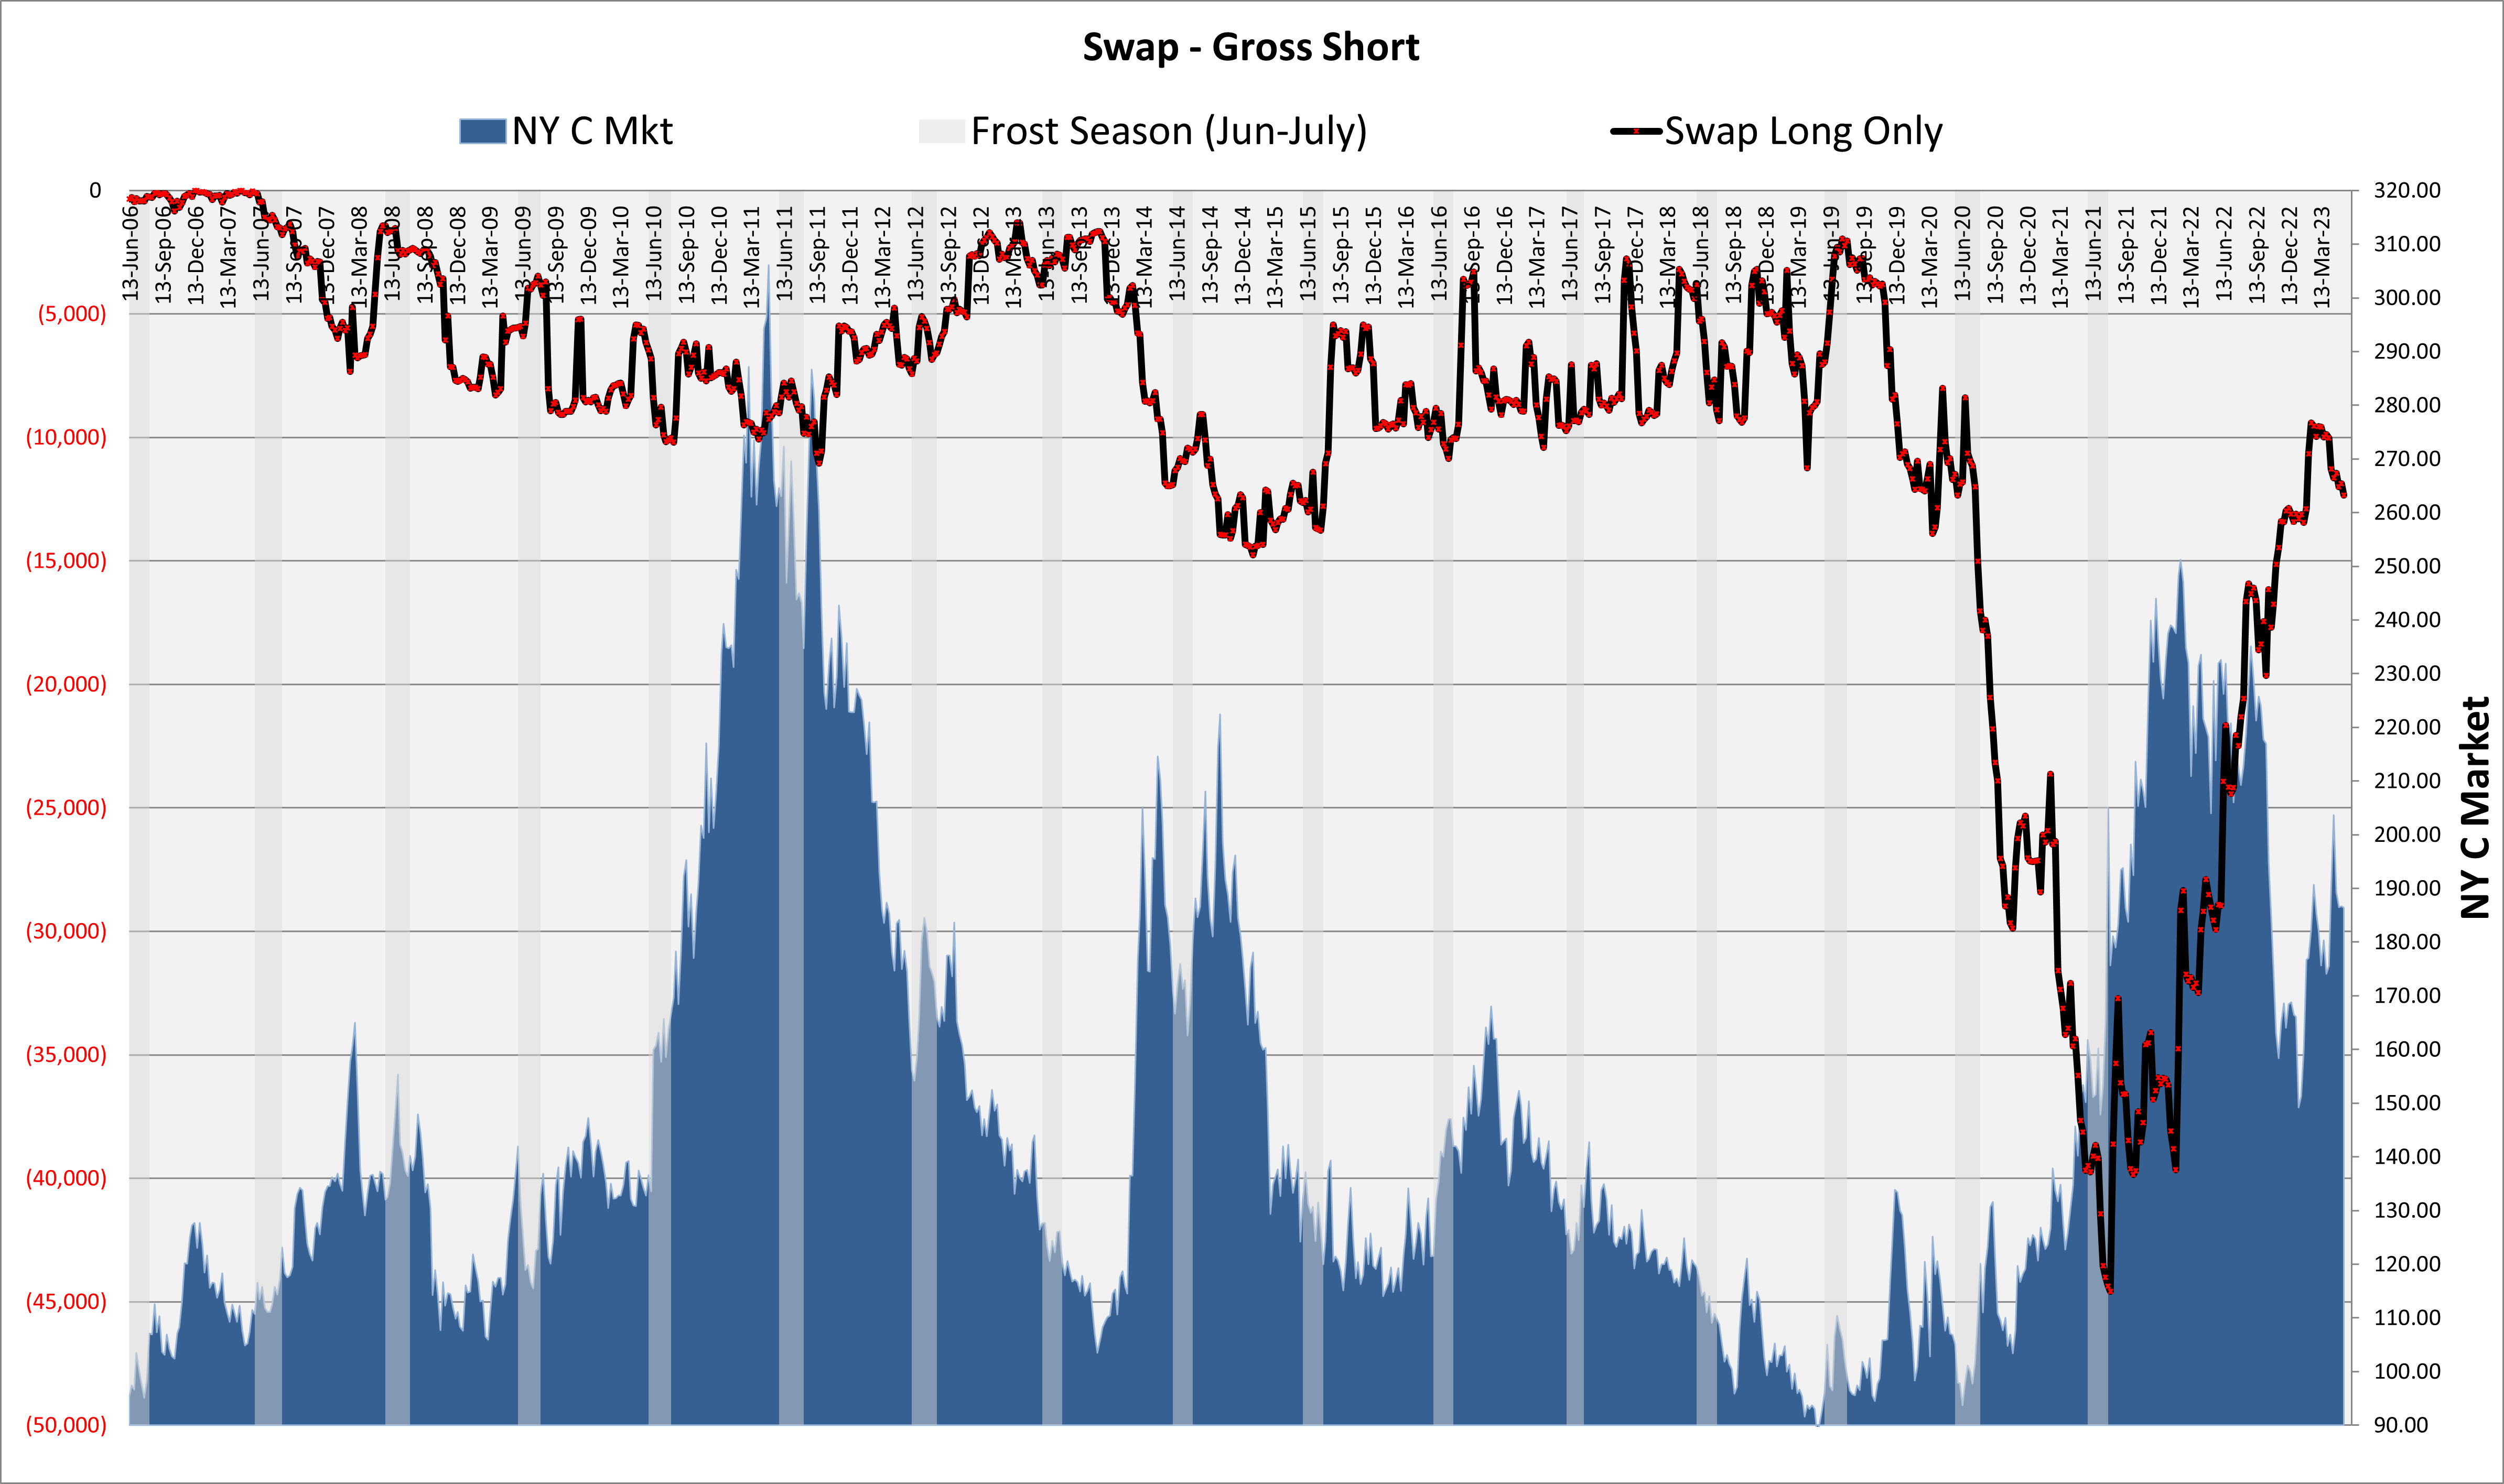
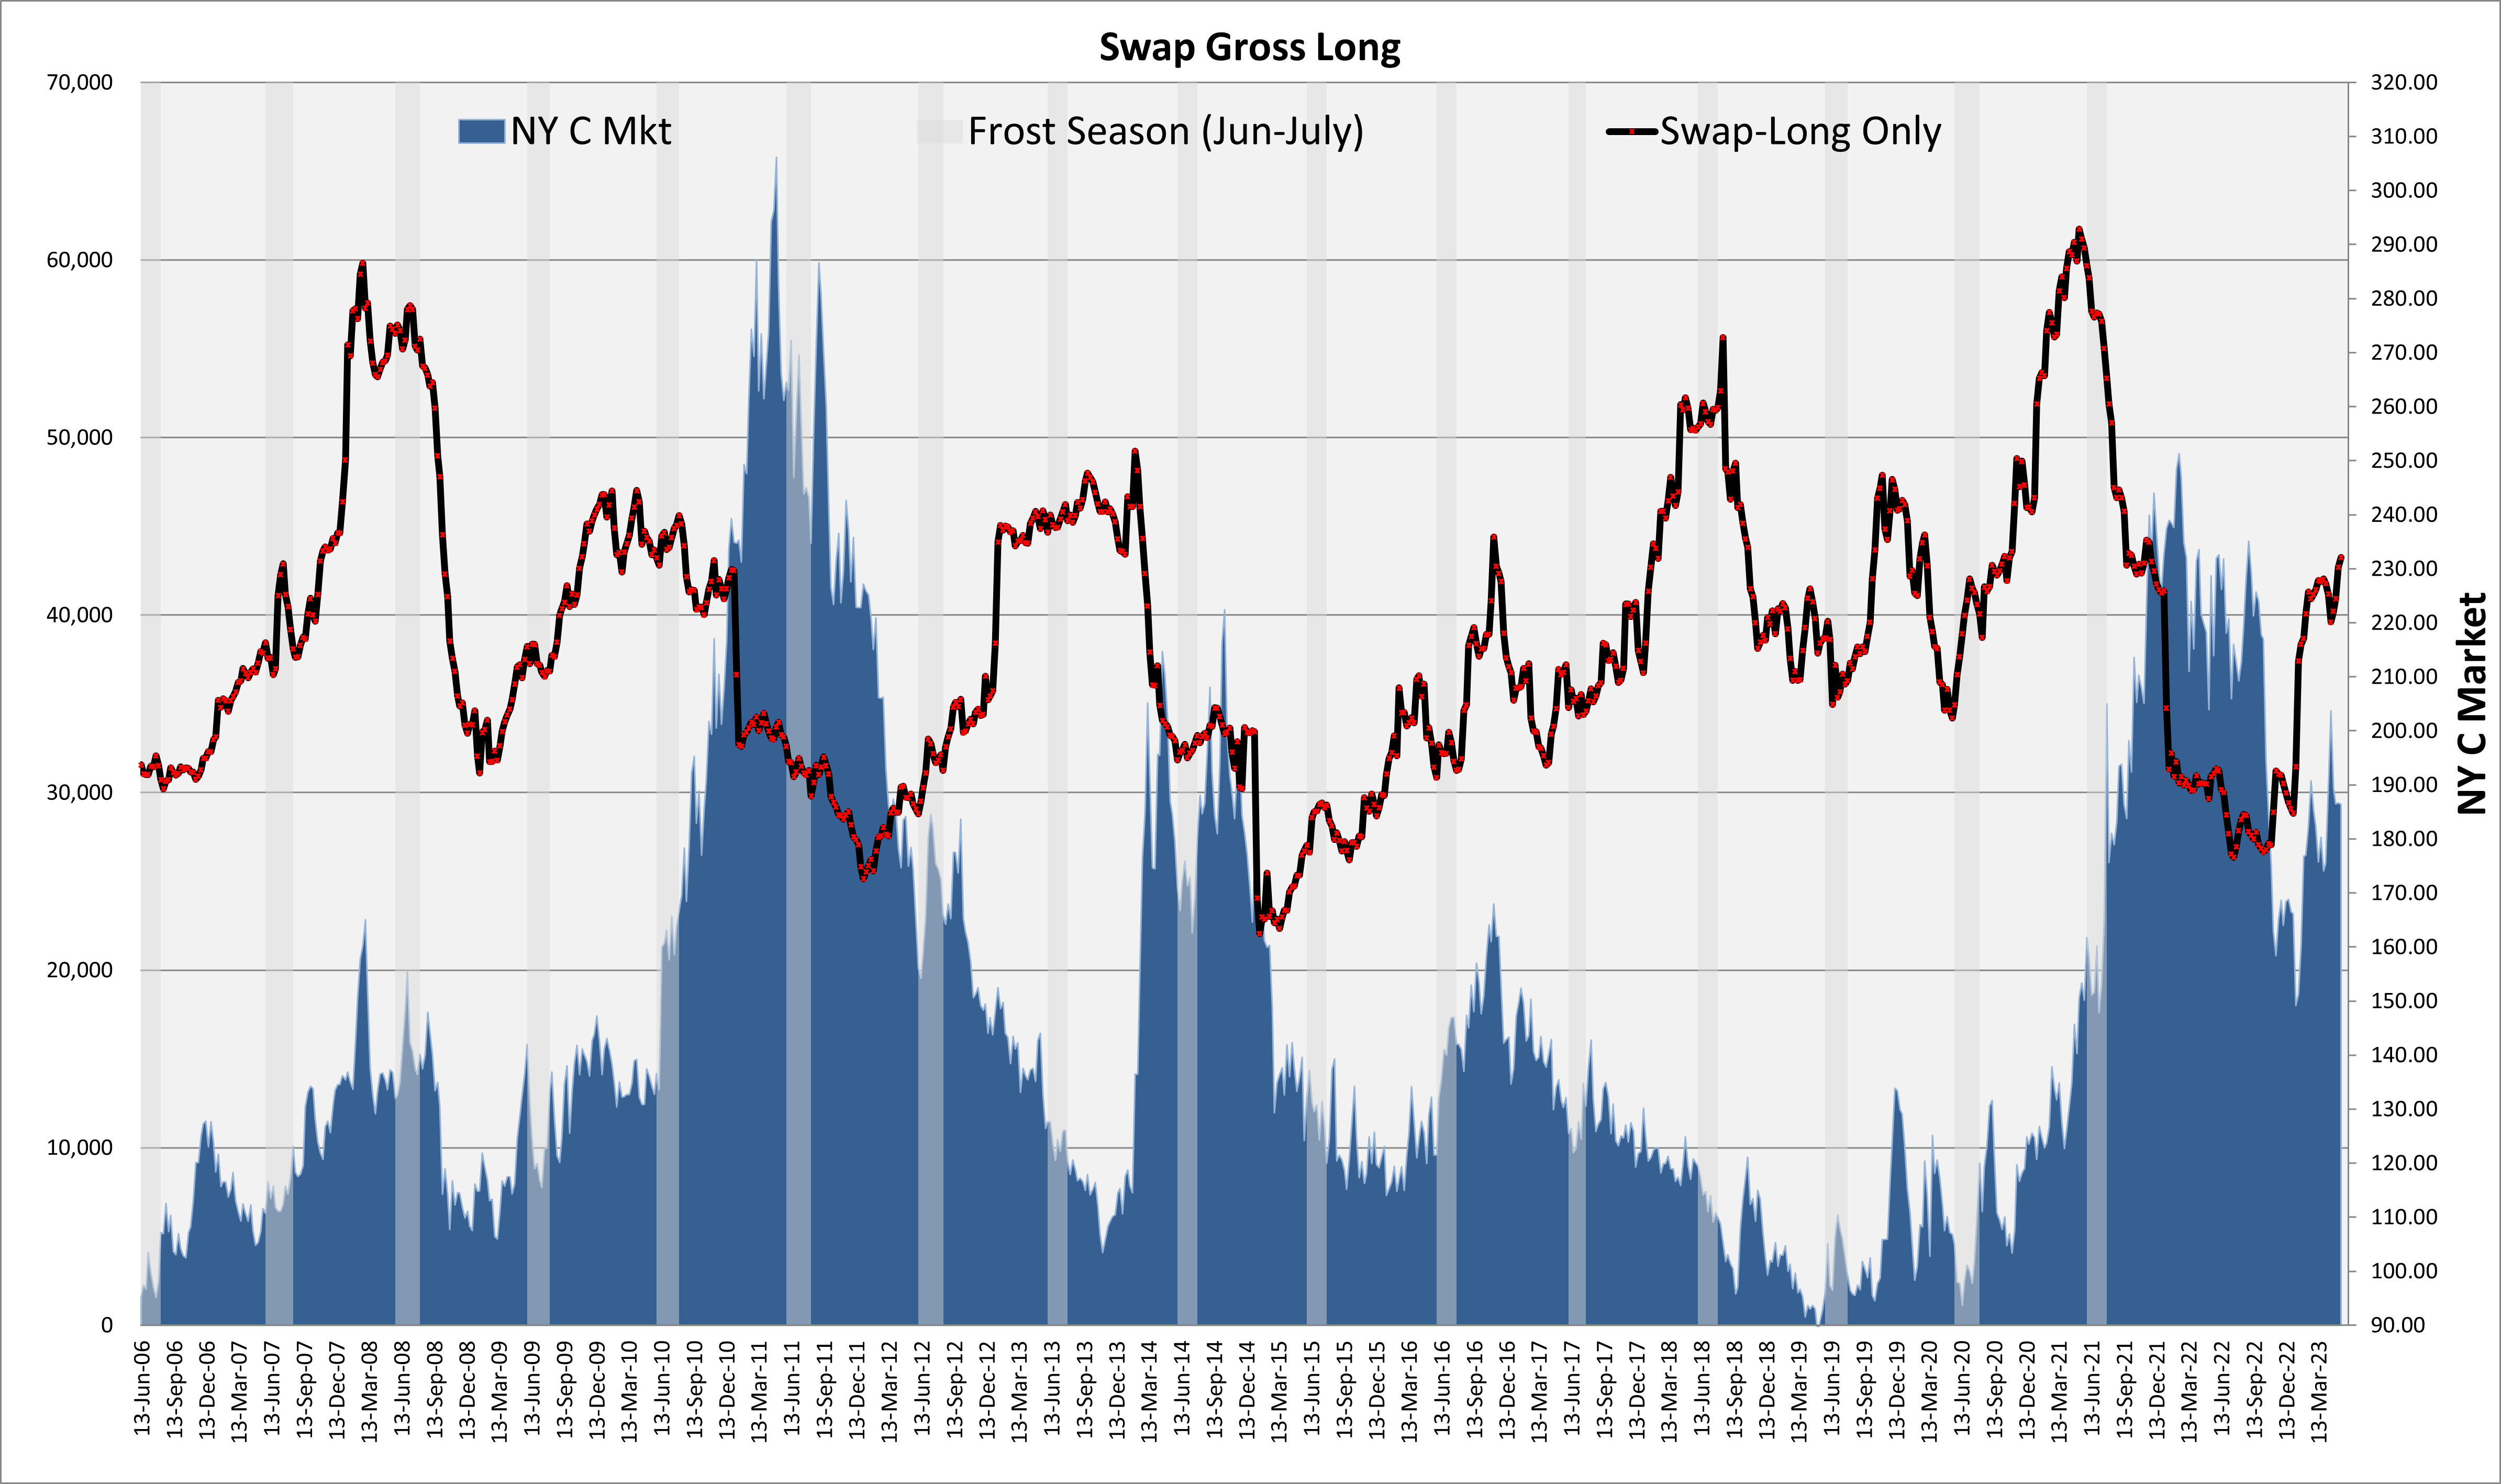
Swap
- Swap position has normalized with gross shorts back to historical levels.
- Shows more of a commitment to the long side.
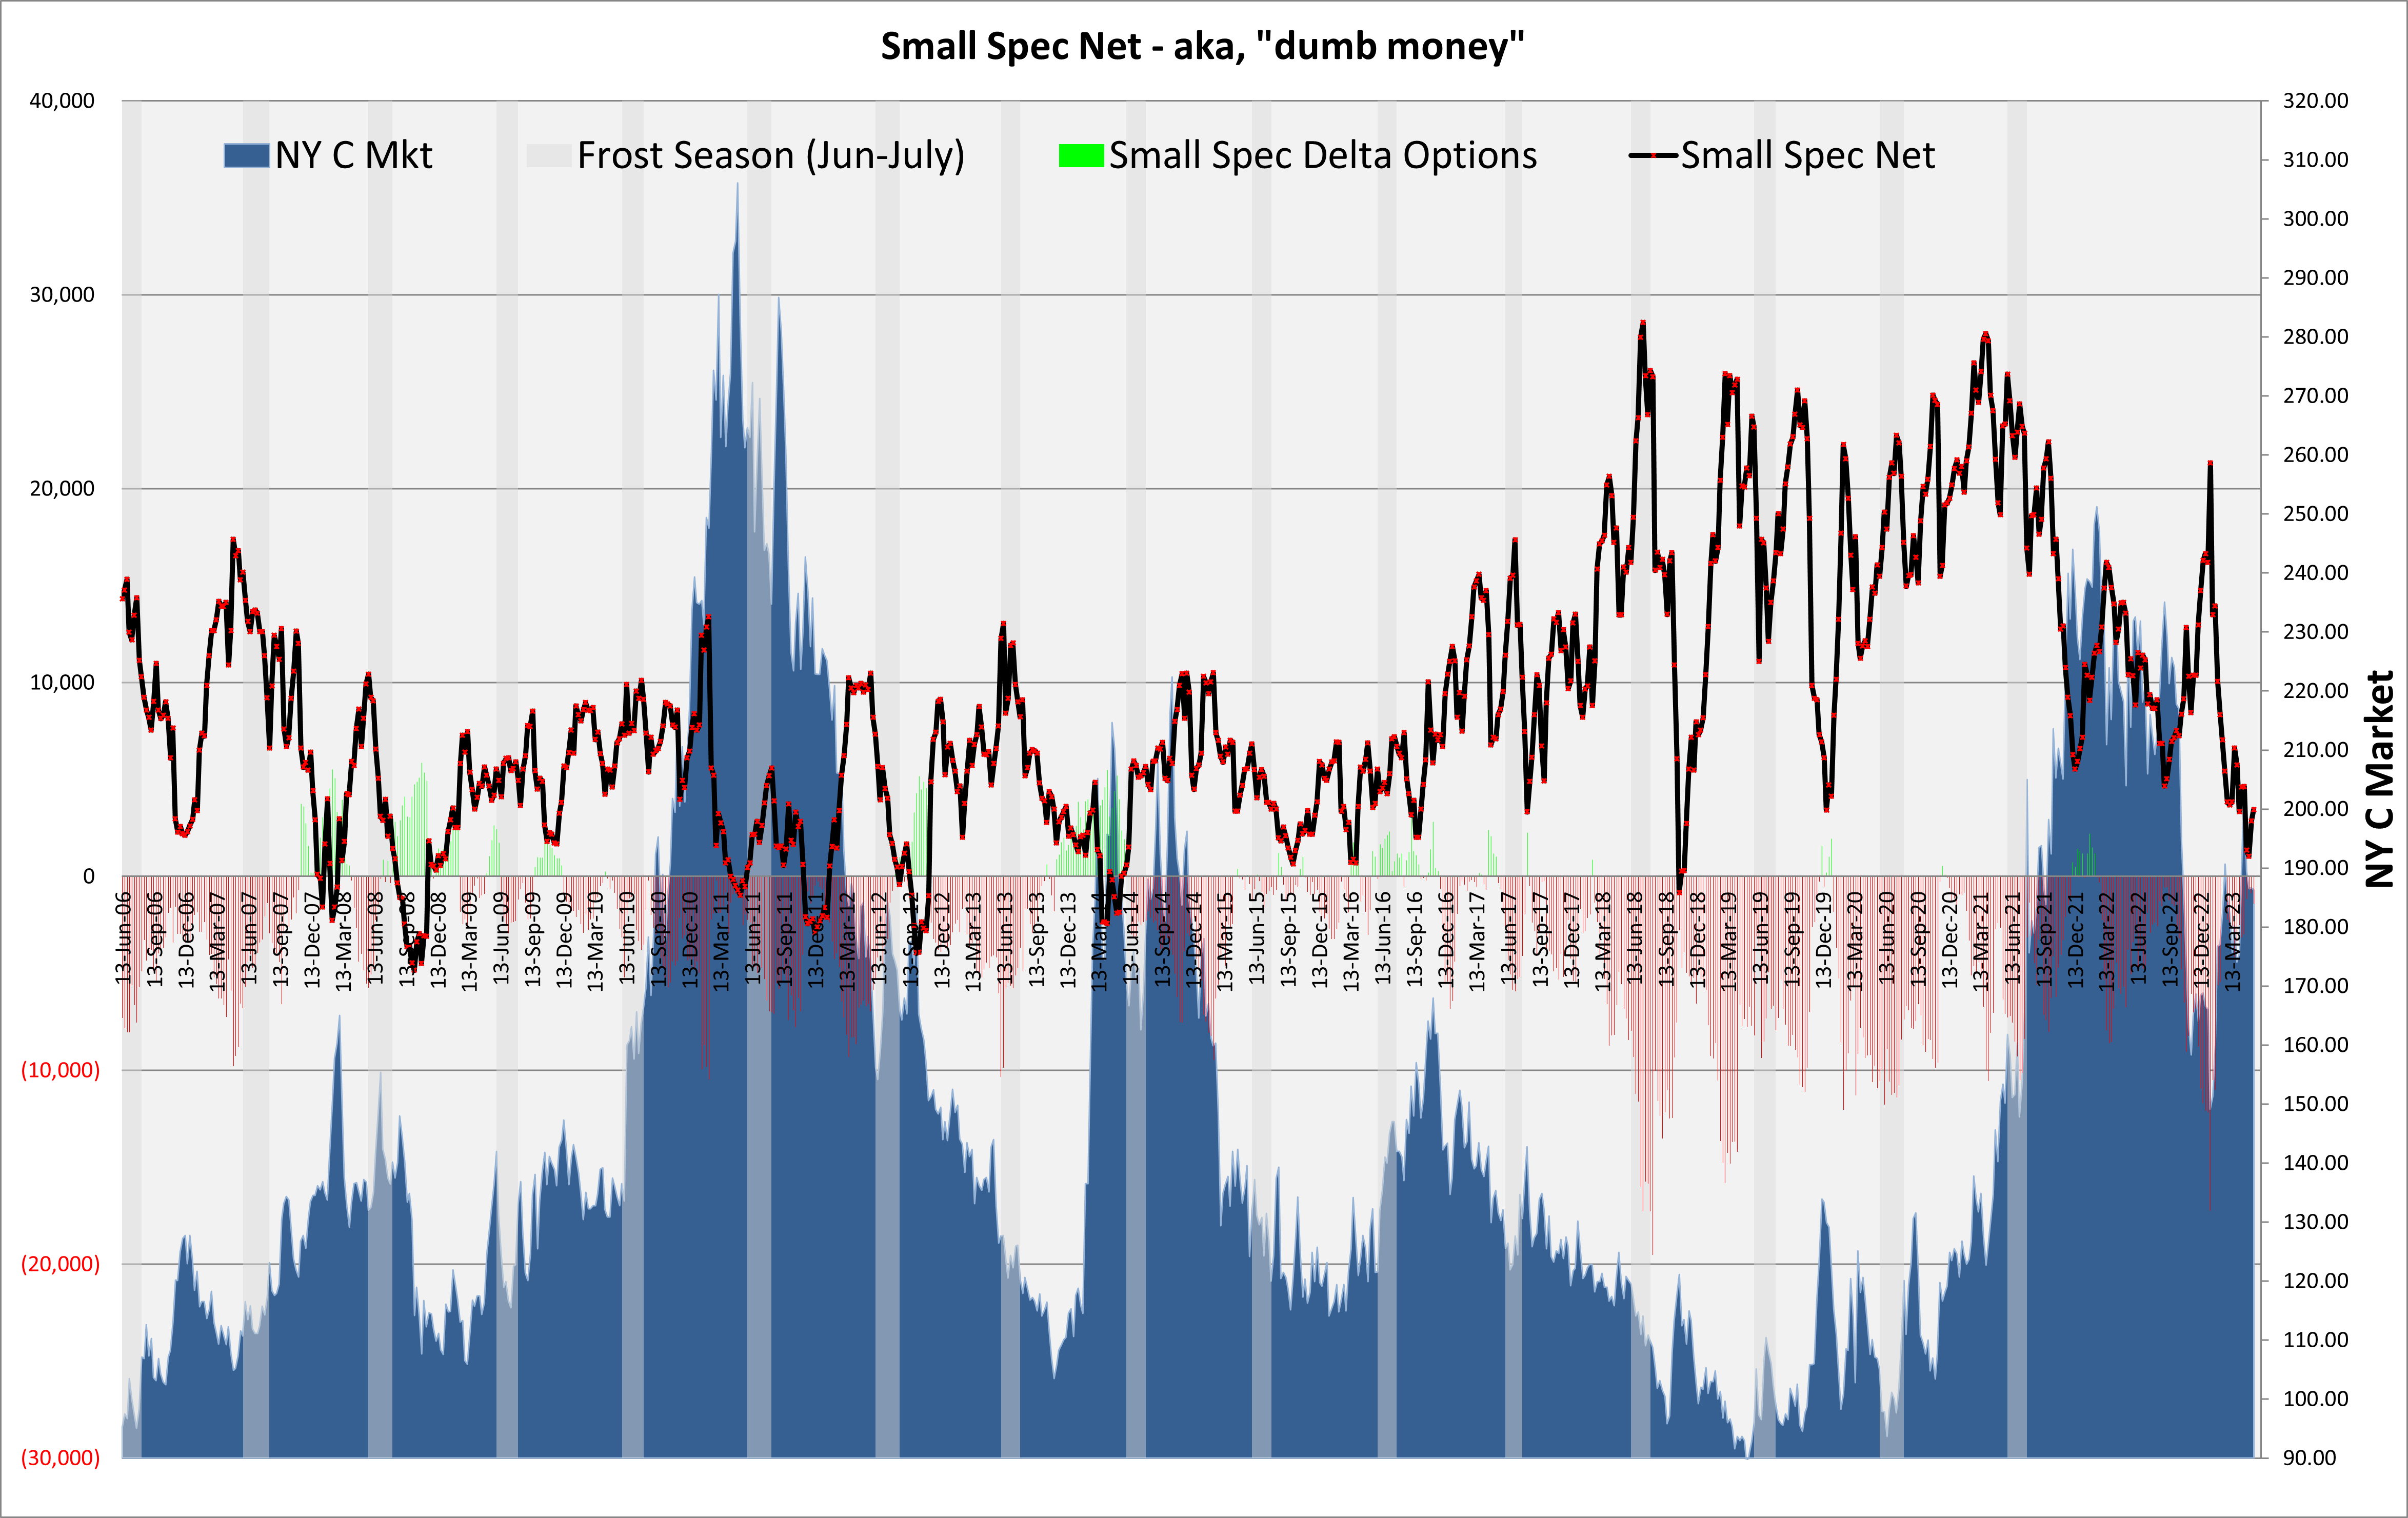
Dumb Money
- The “dumb money” is back to net, flat.
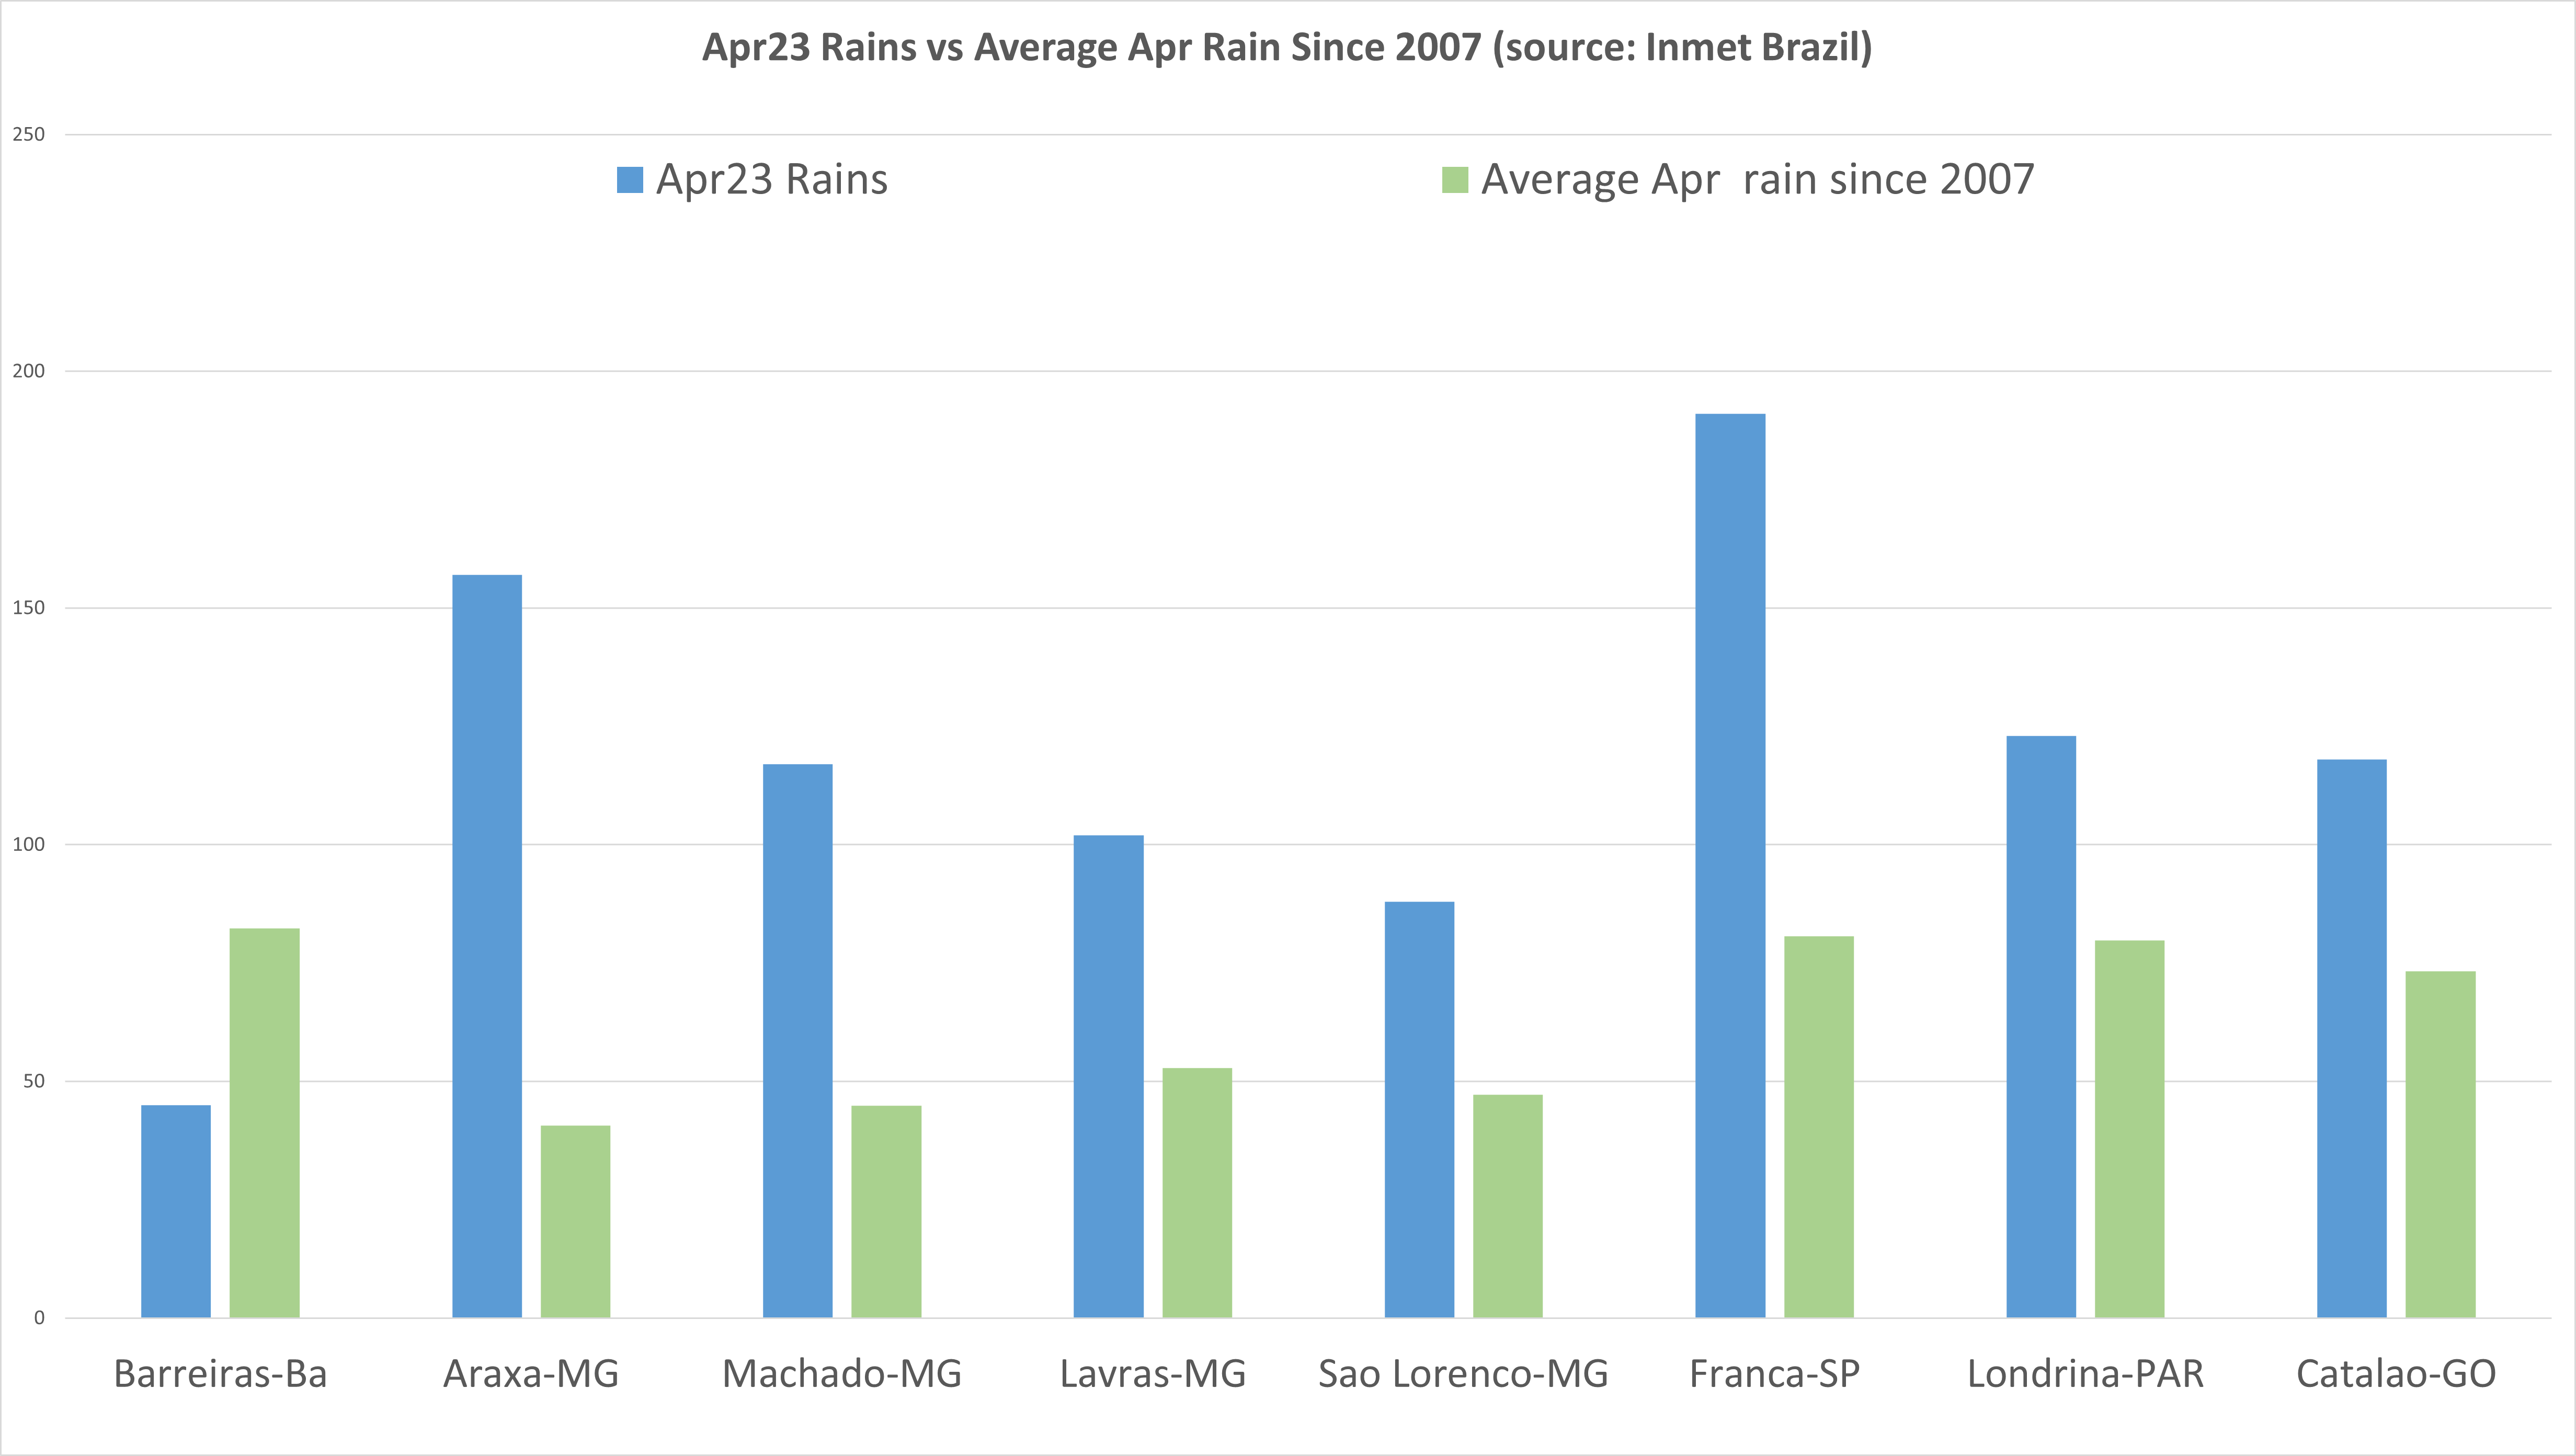
Brazil Rain
Month
- April rains were generally quite above normal and should prove moisture for many months if need be.
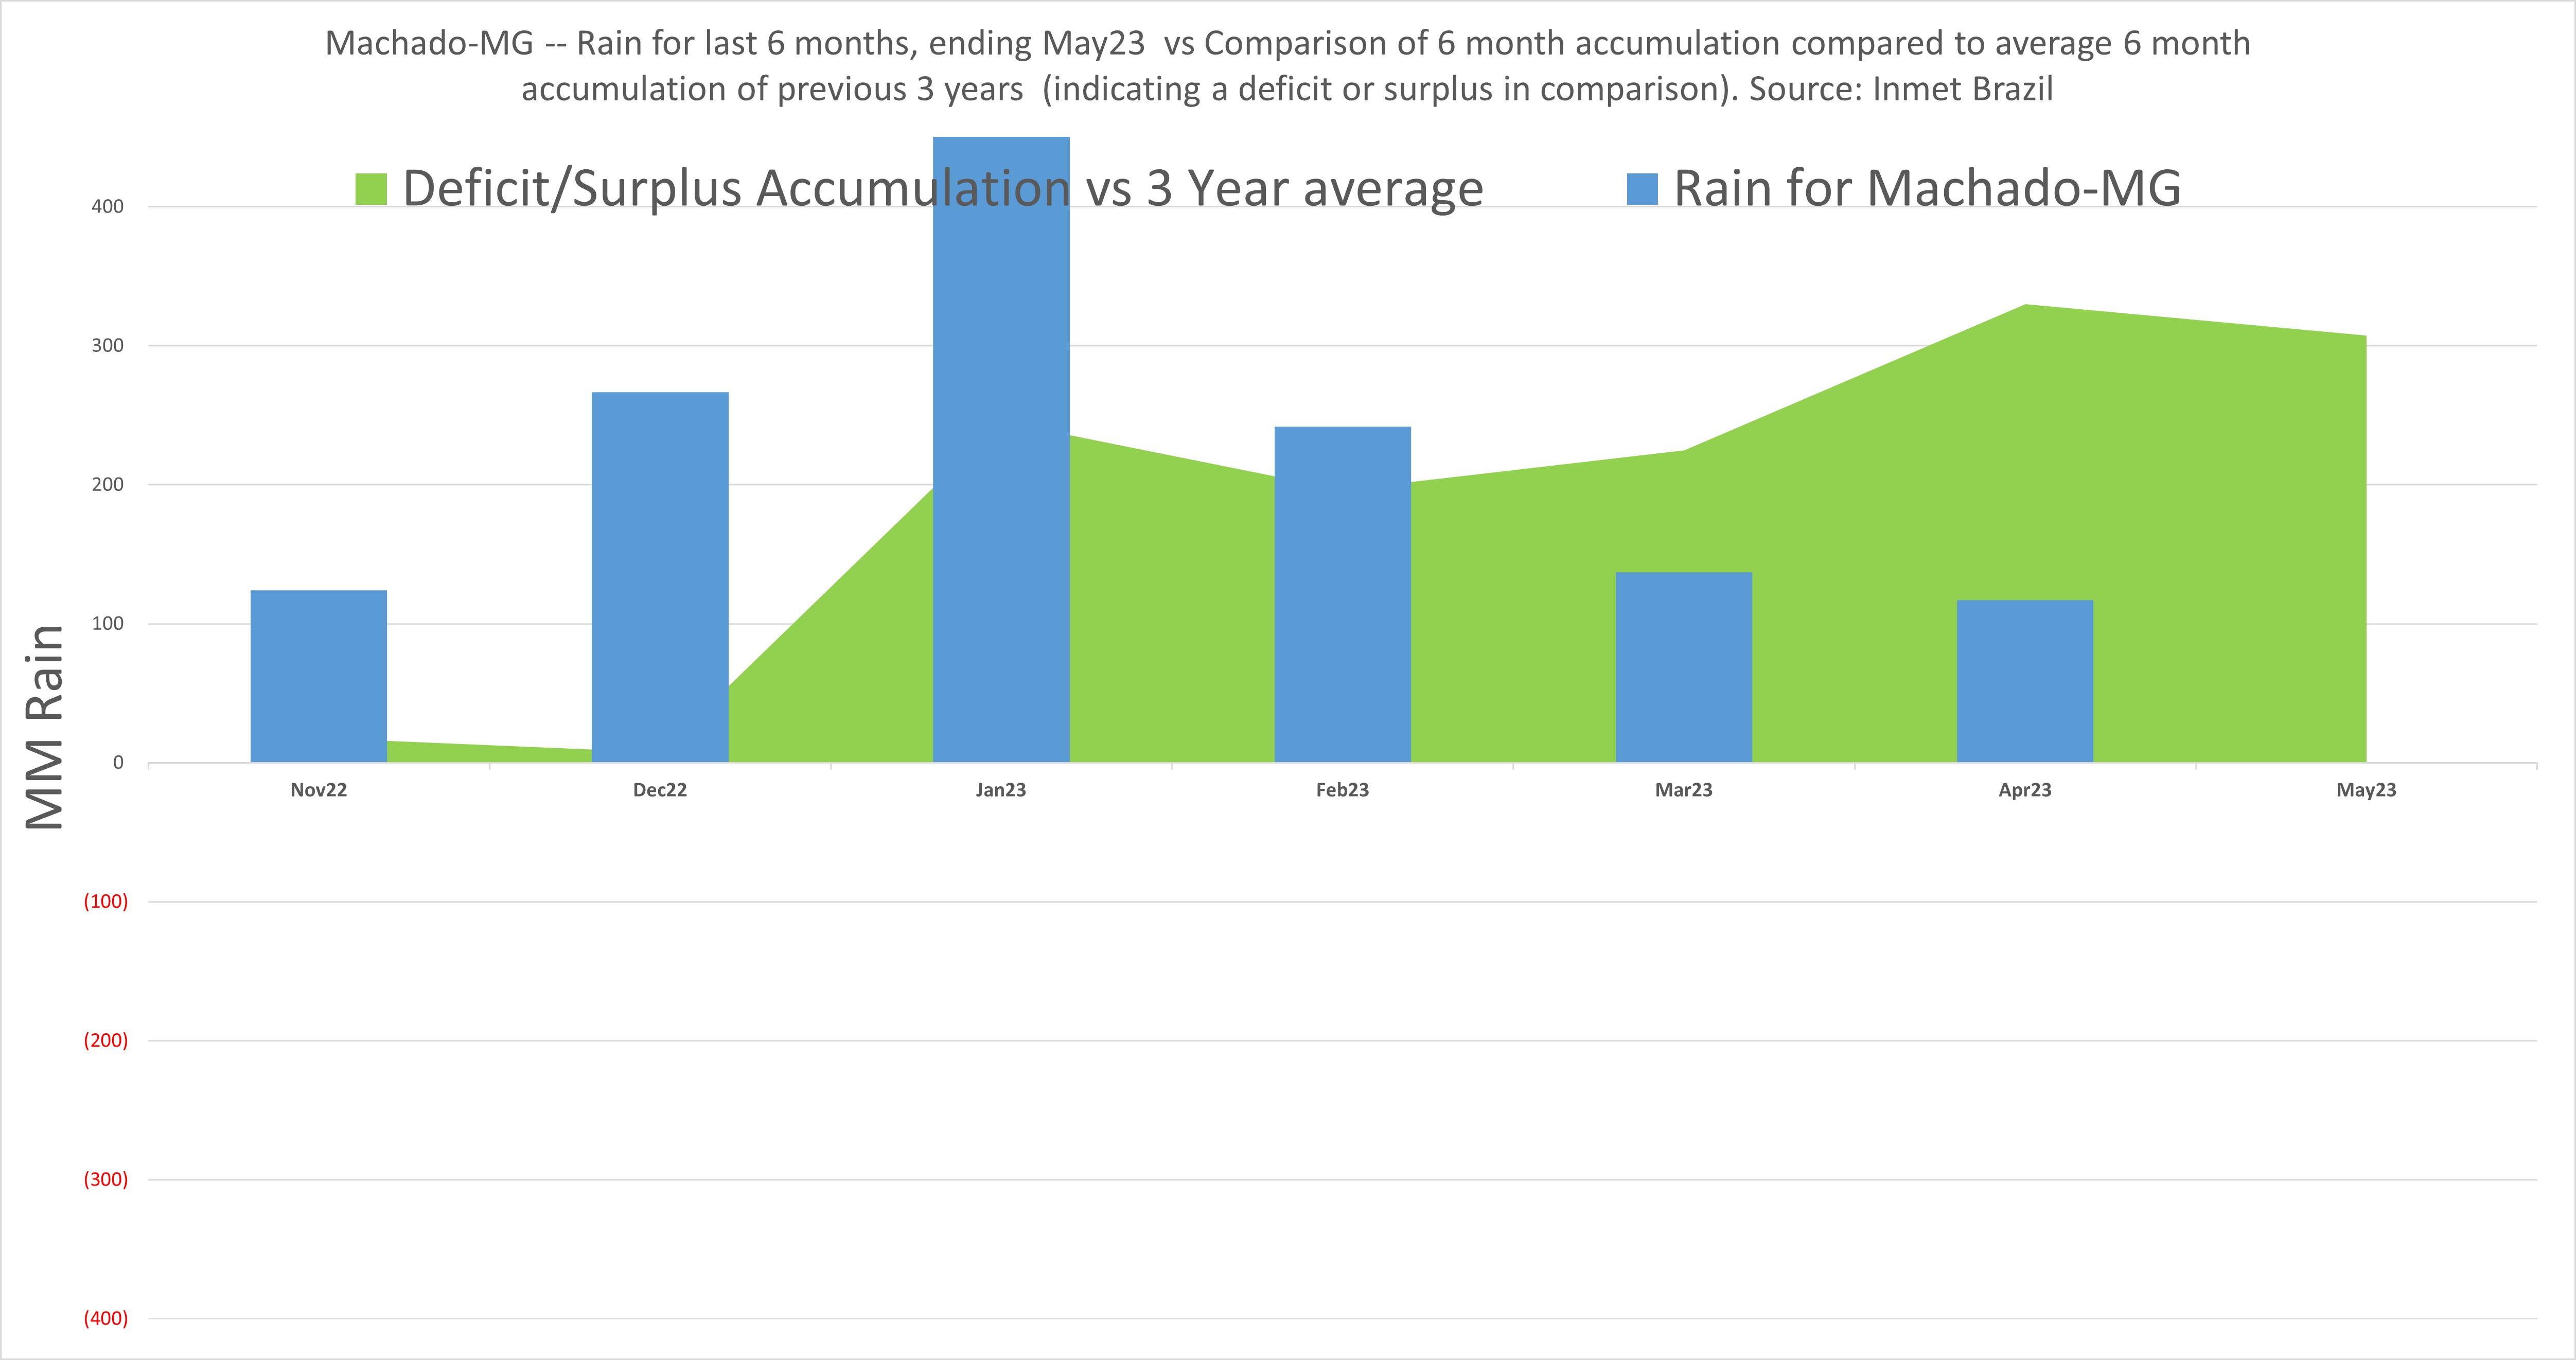
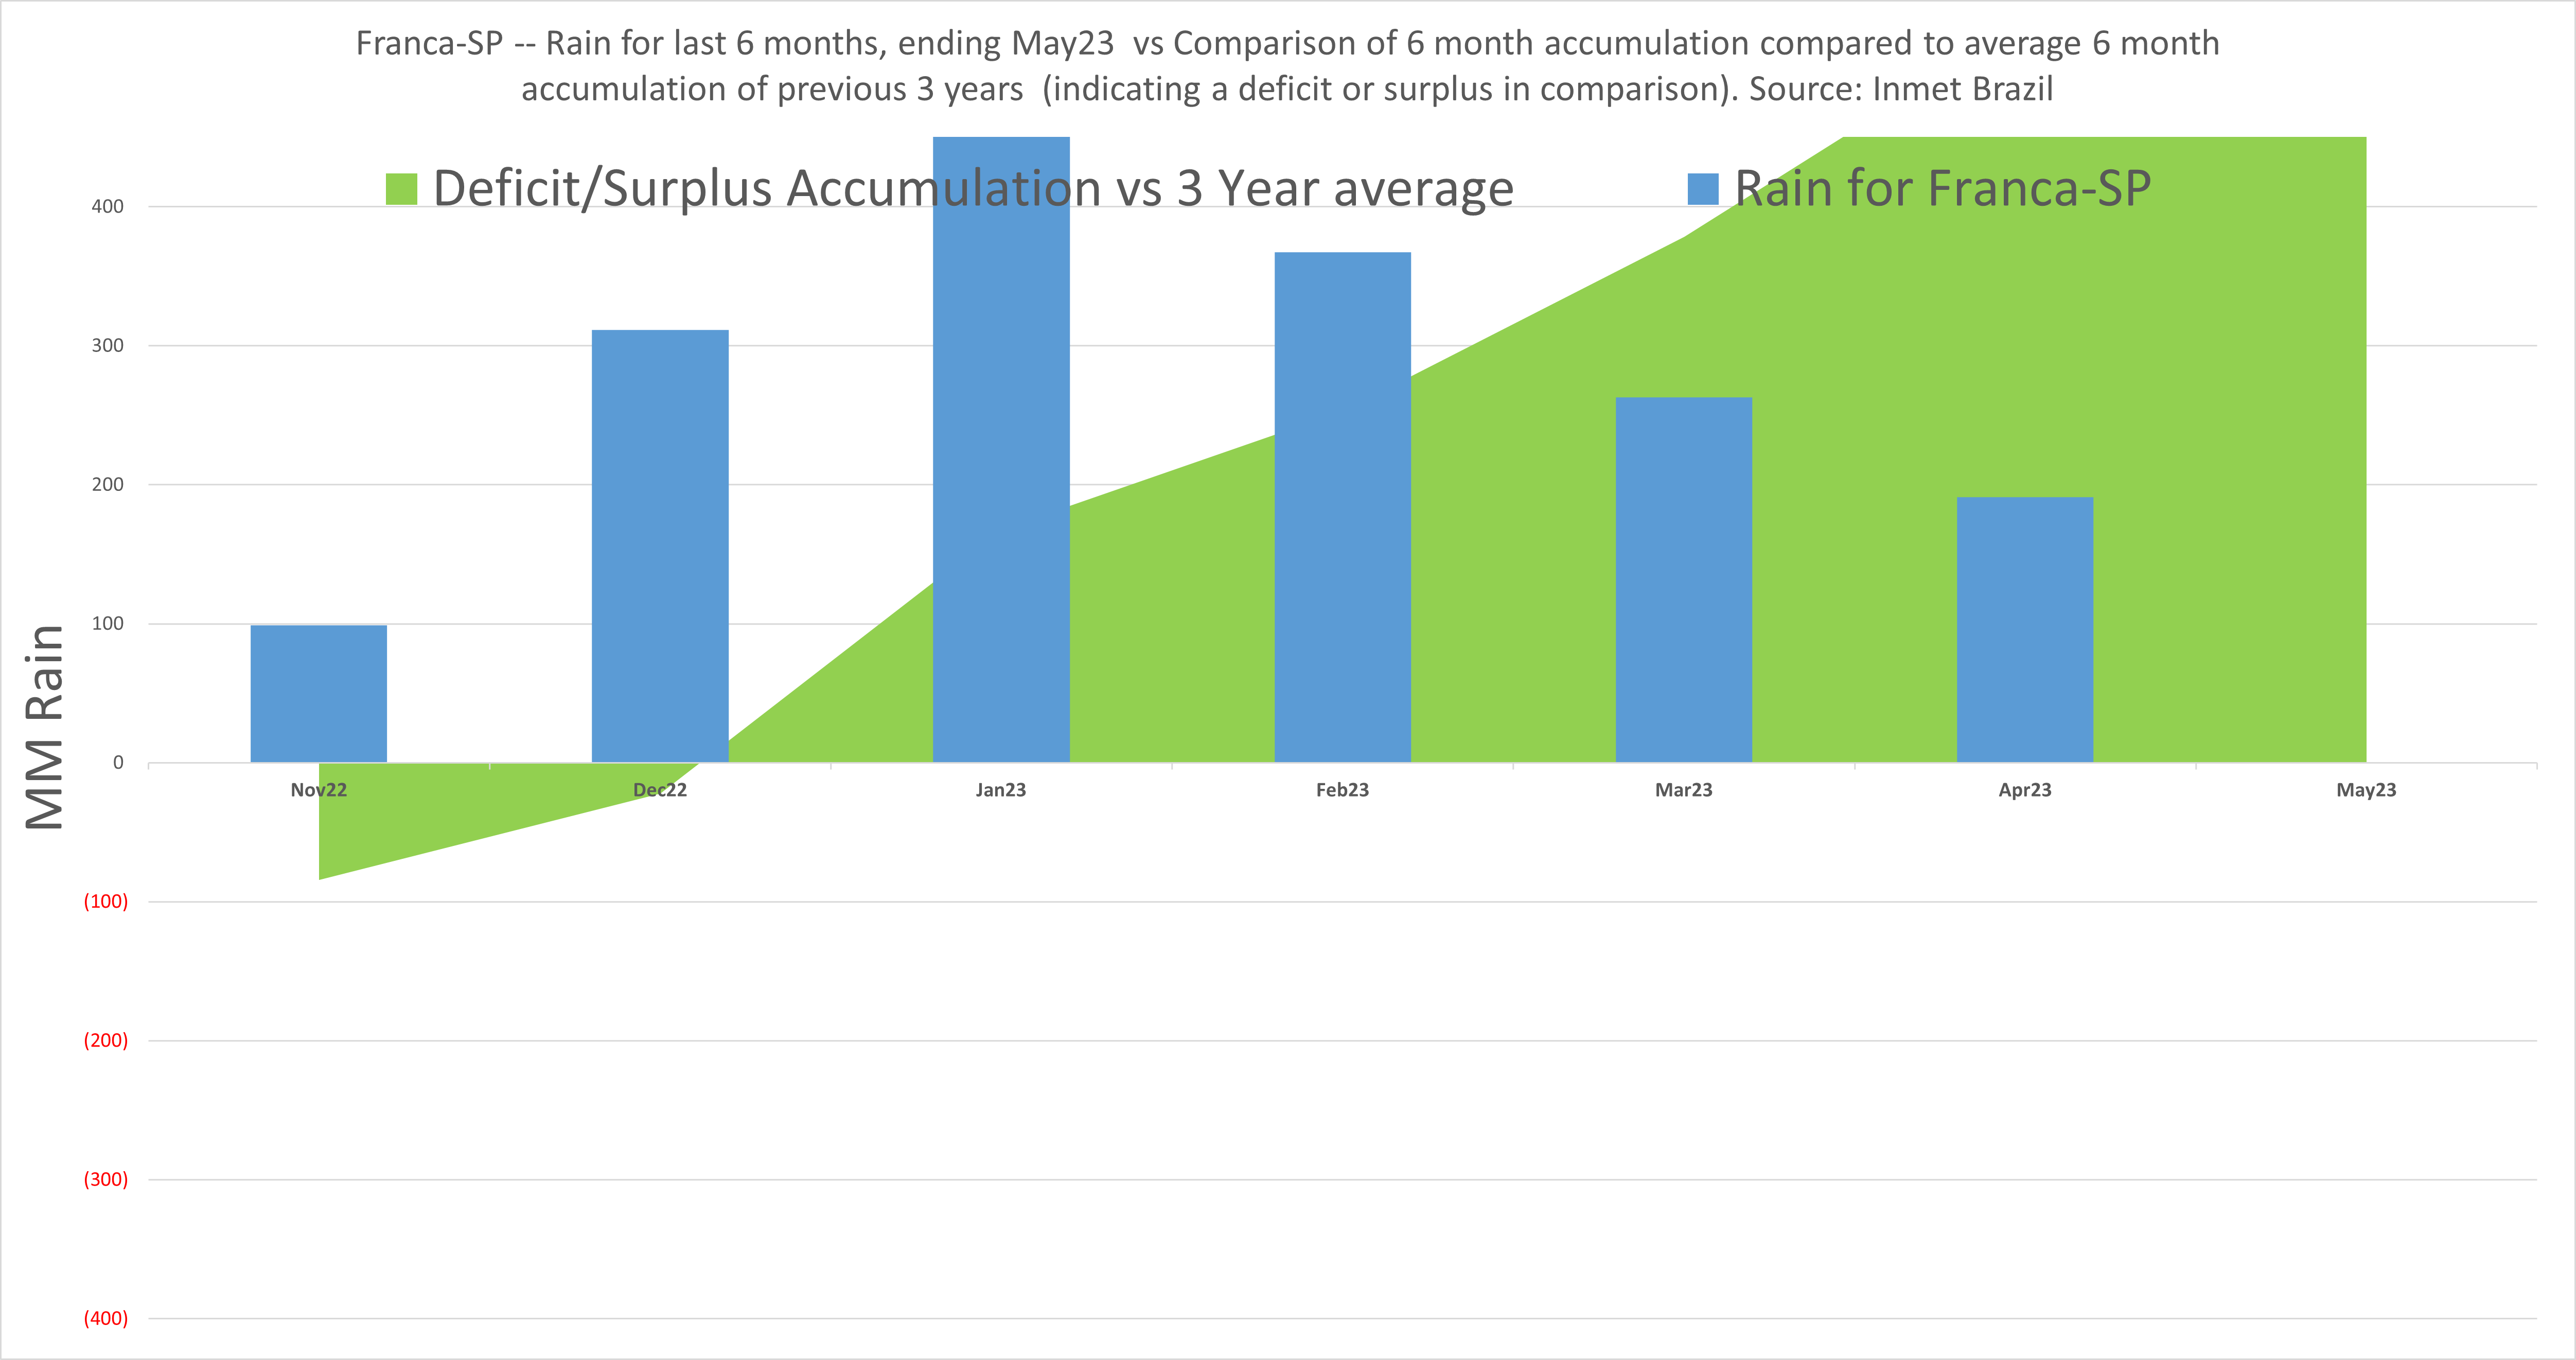
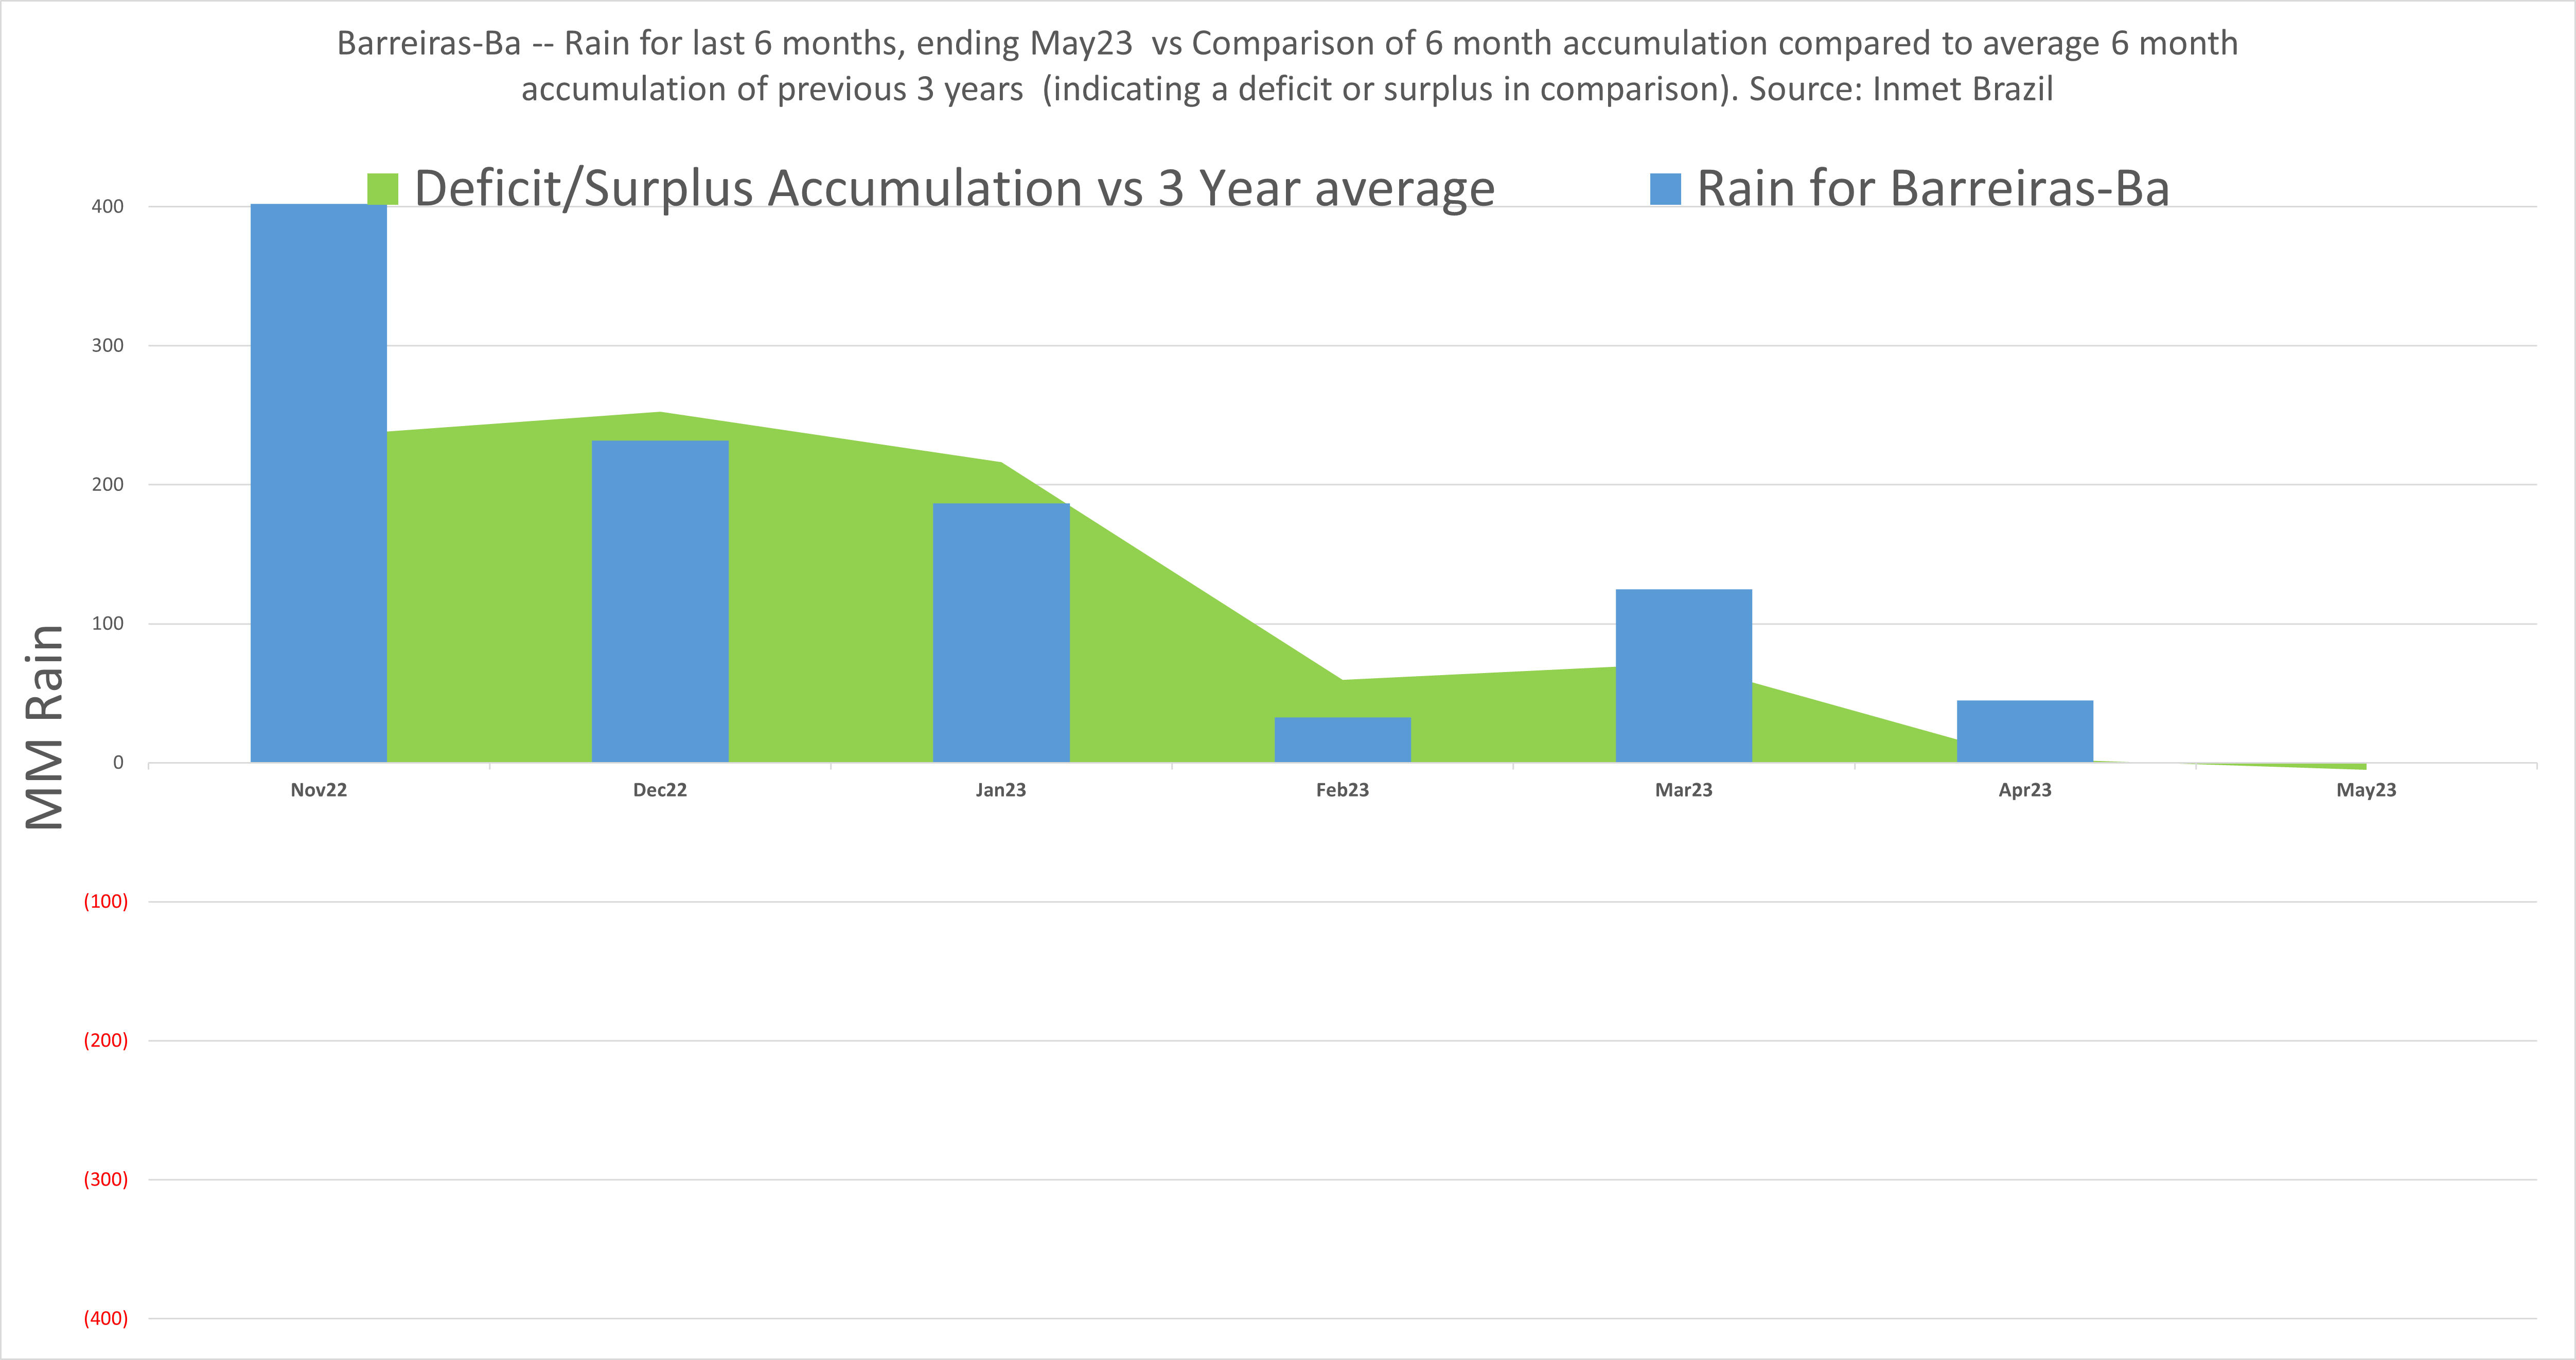
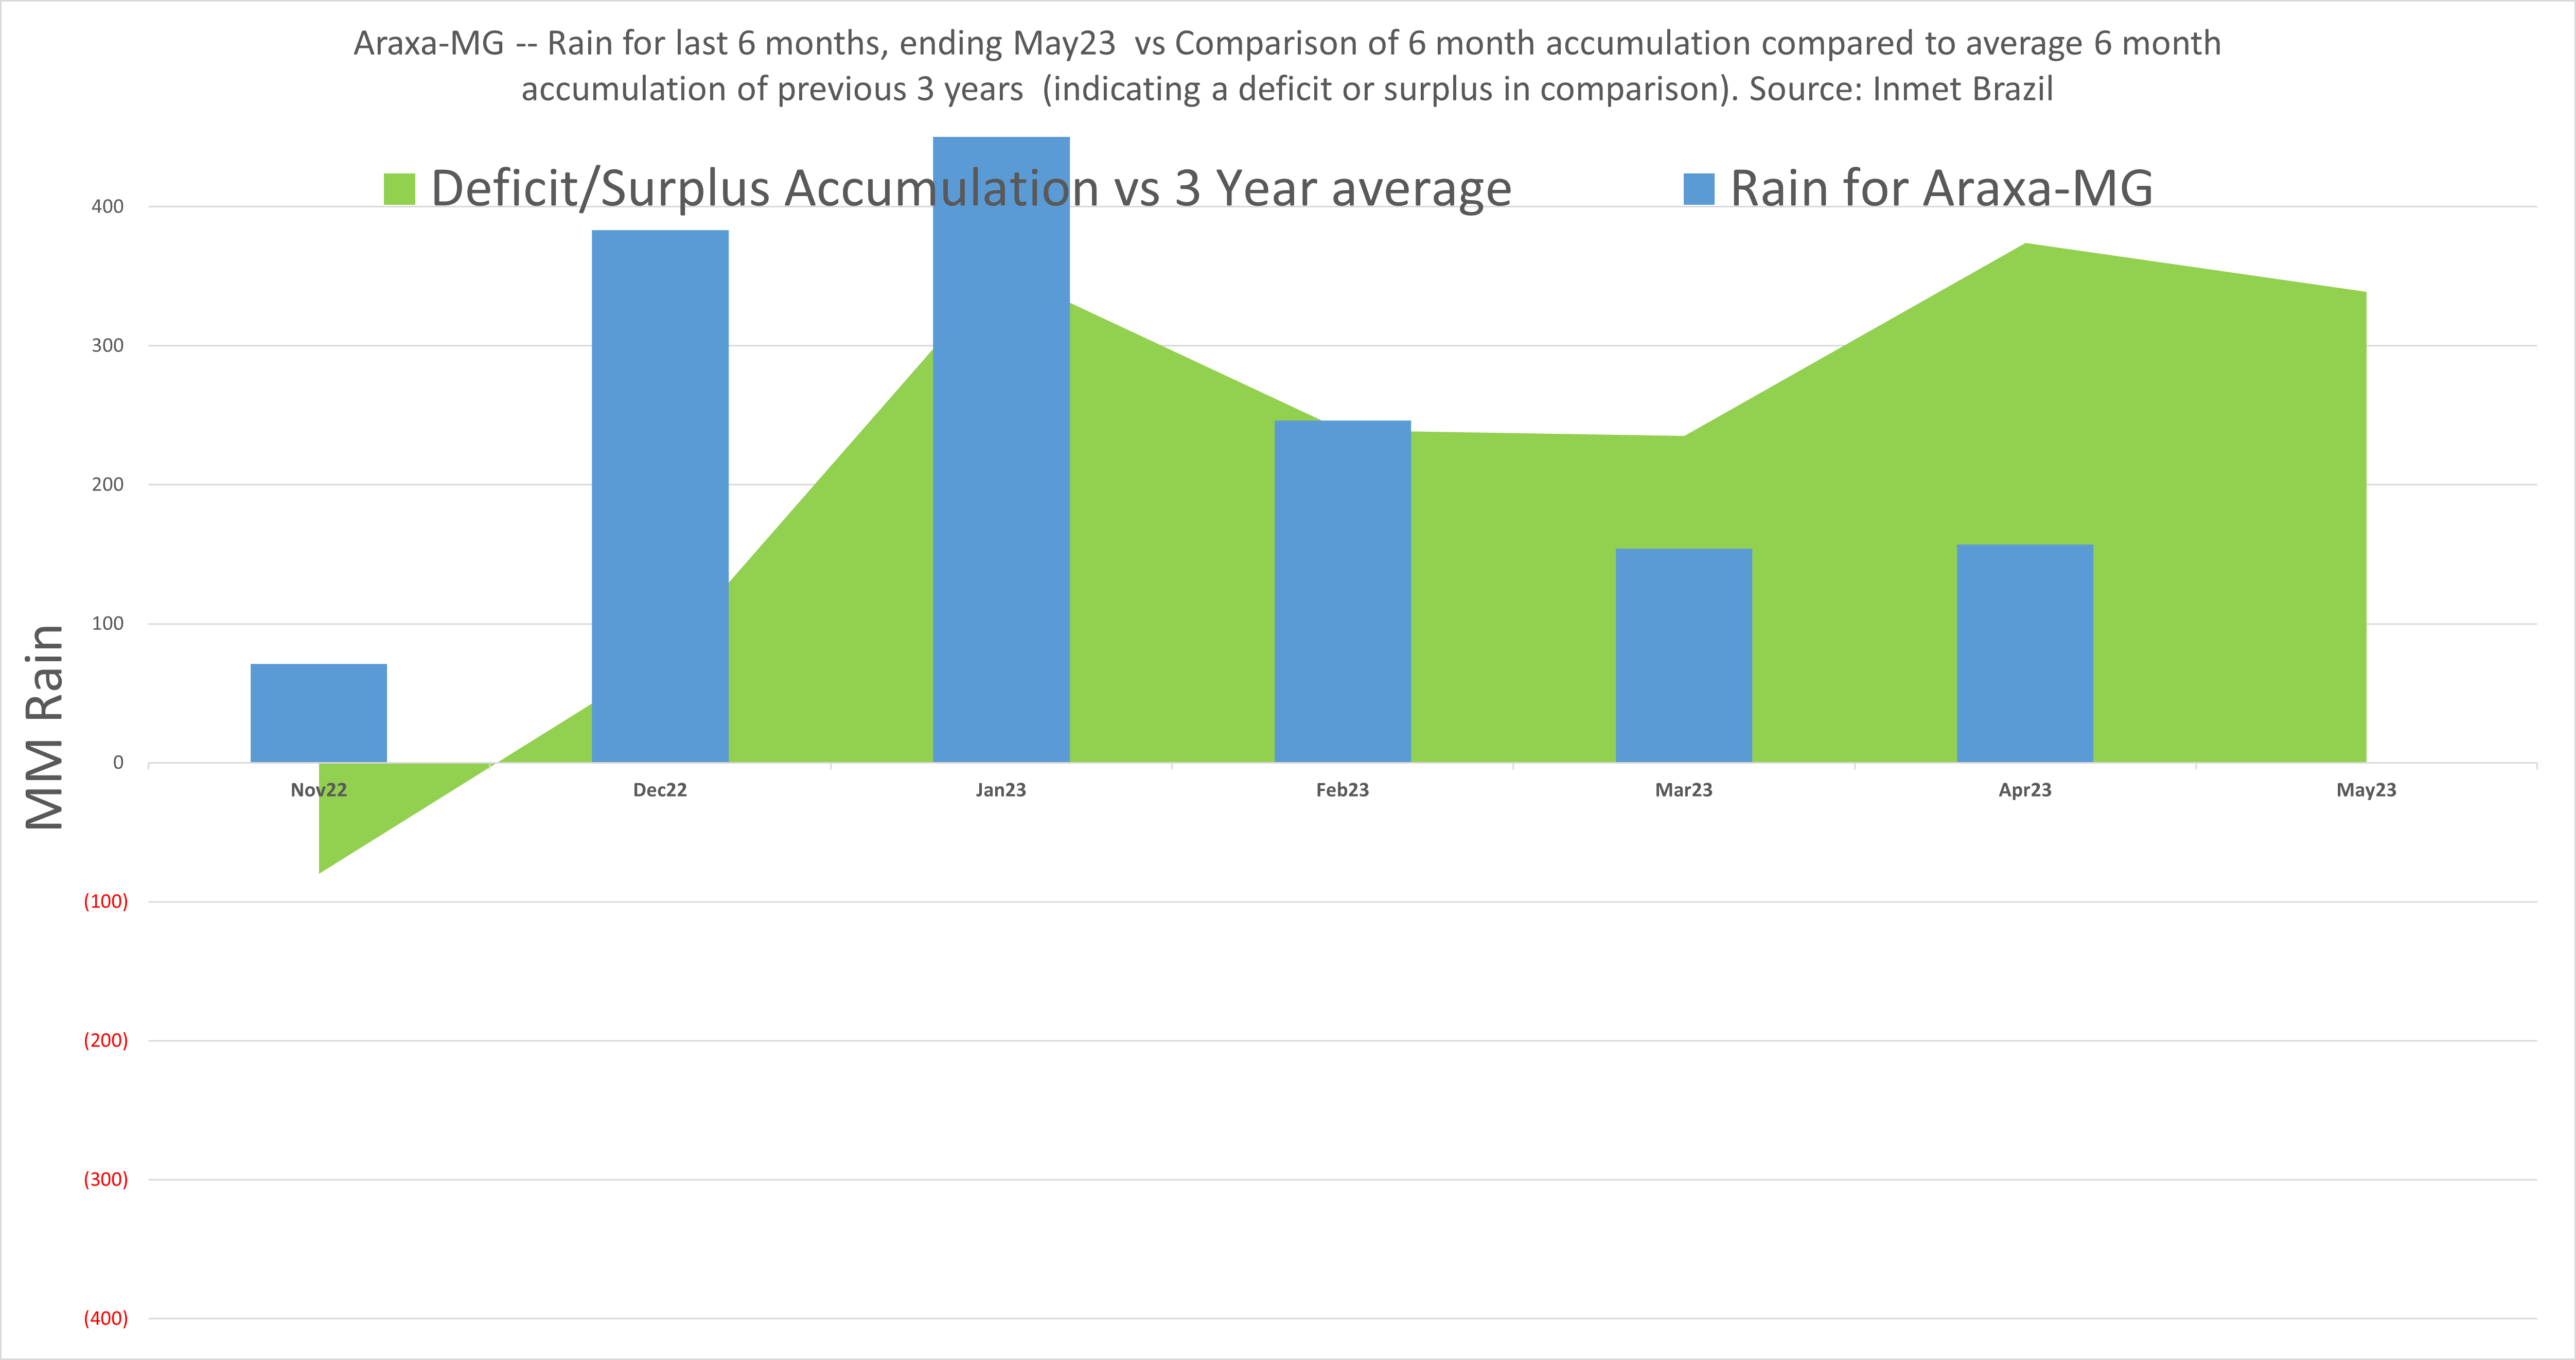
Accumulated
- Accumulated, through mid May shows that despite a dry May, the accumulation of rain over last 6 months has been good.
- El Niño may provide more rain in the winter which is potentiall worrisome for both quality and early flowering.


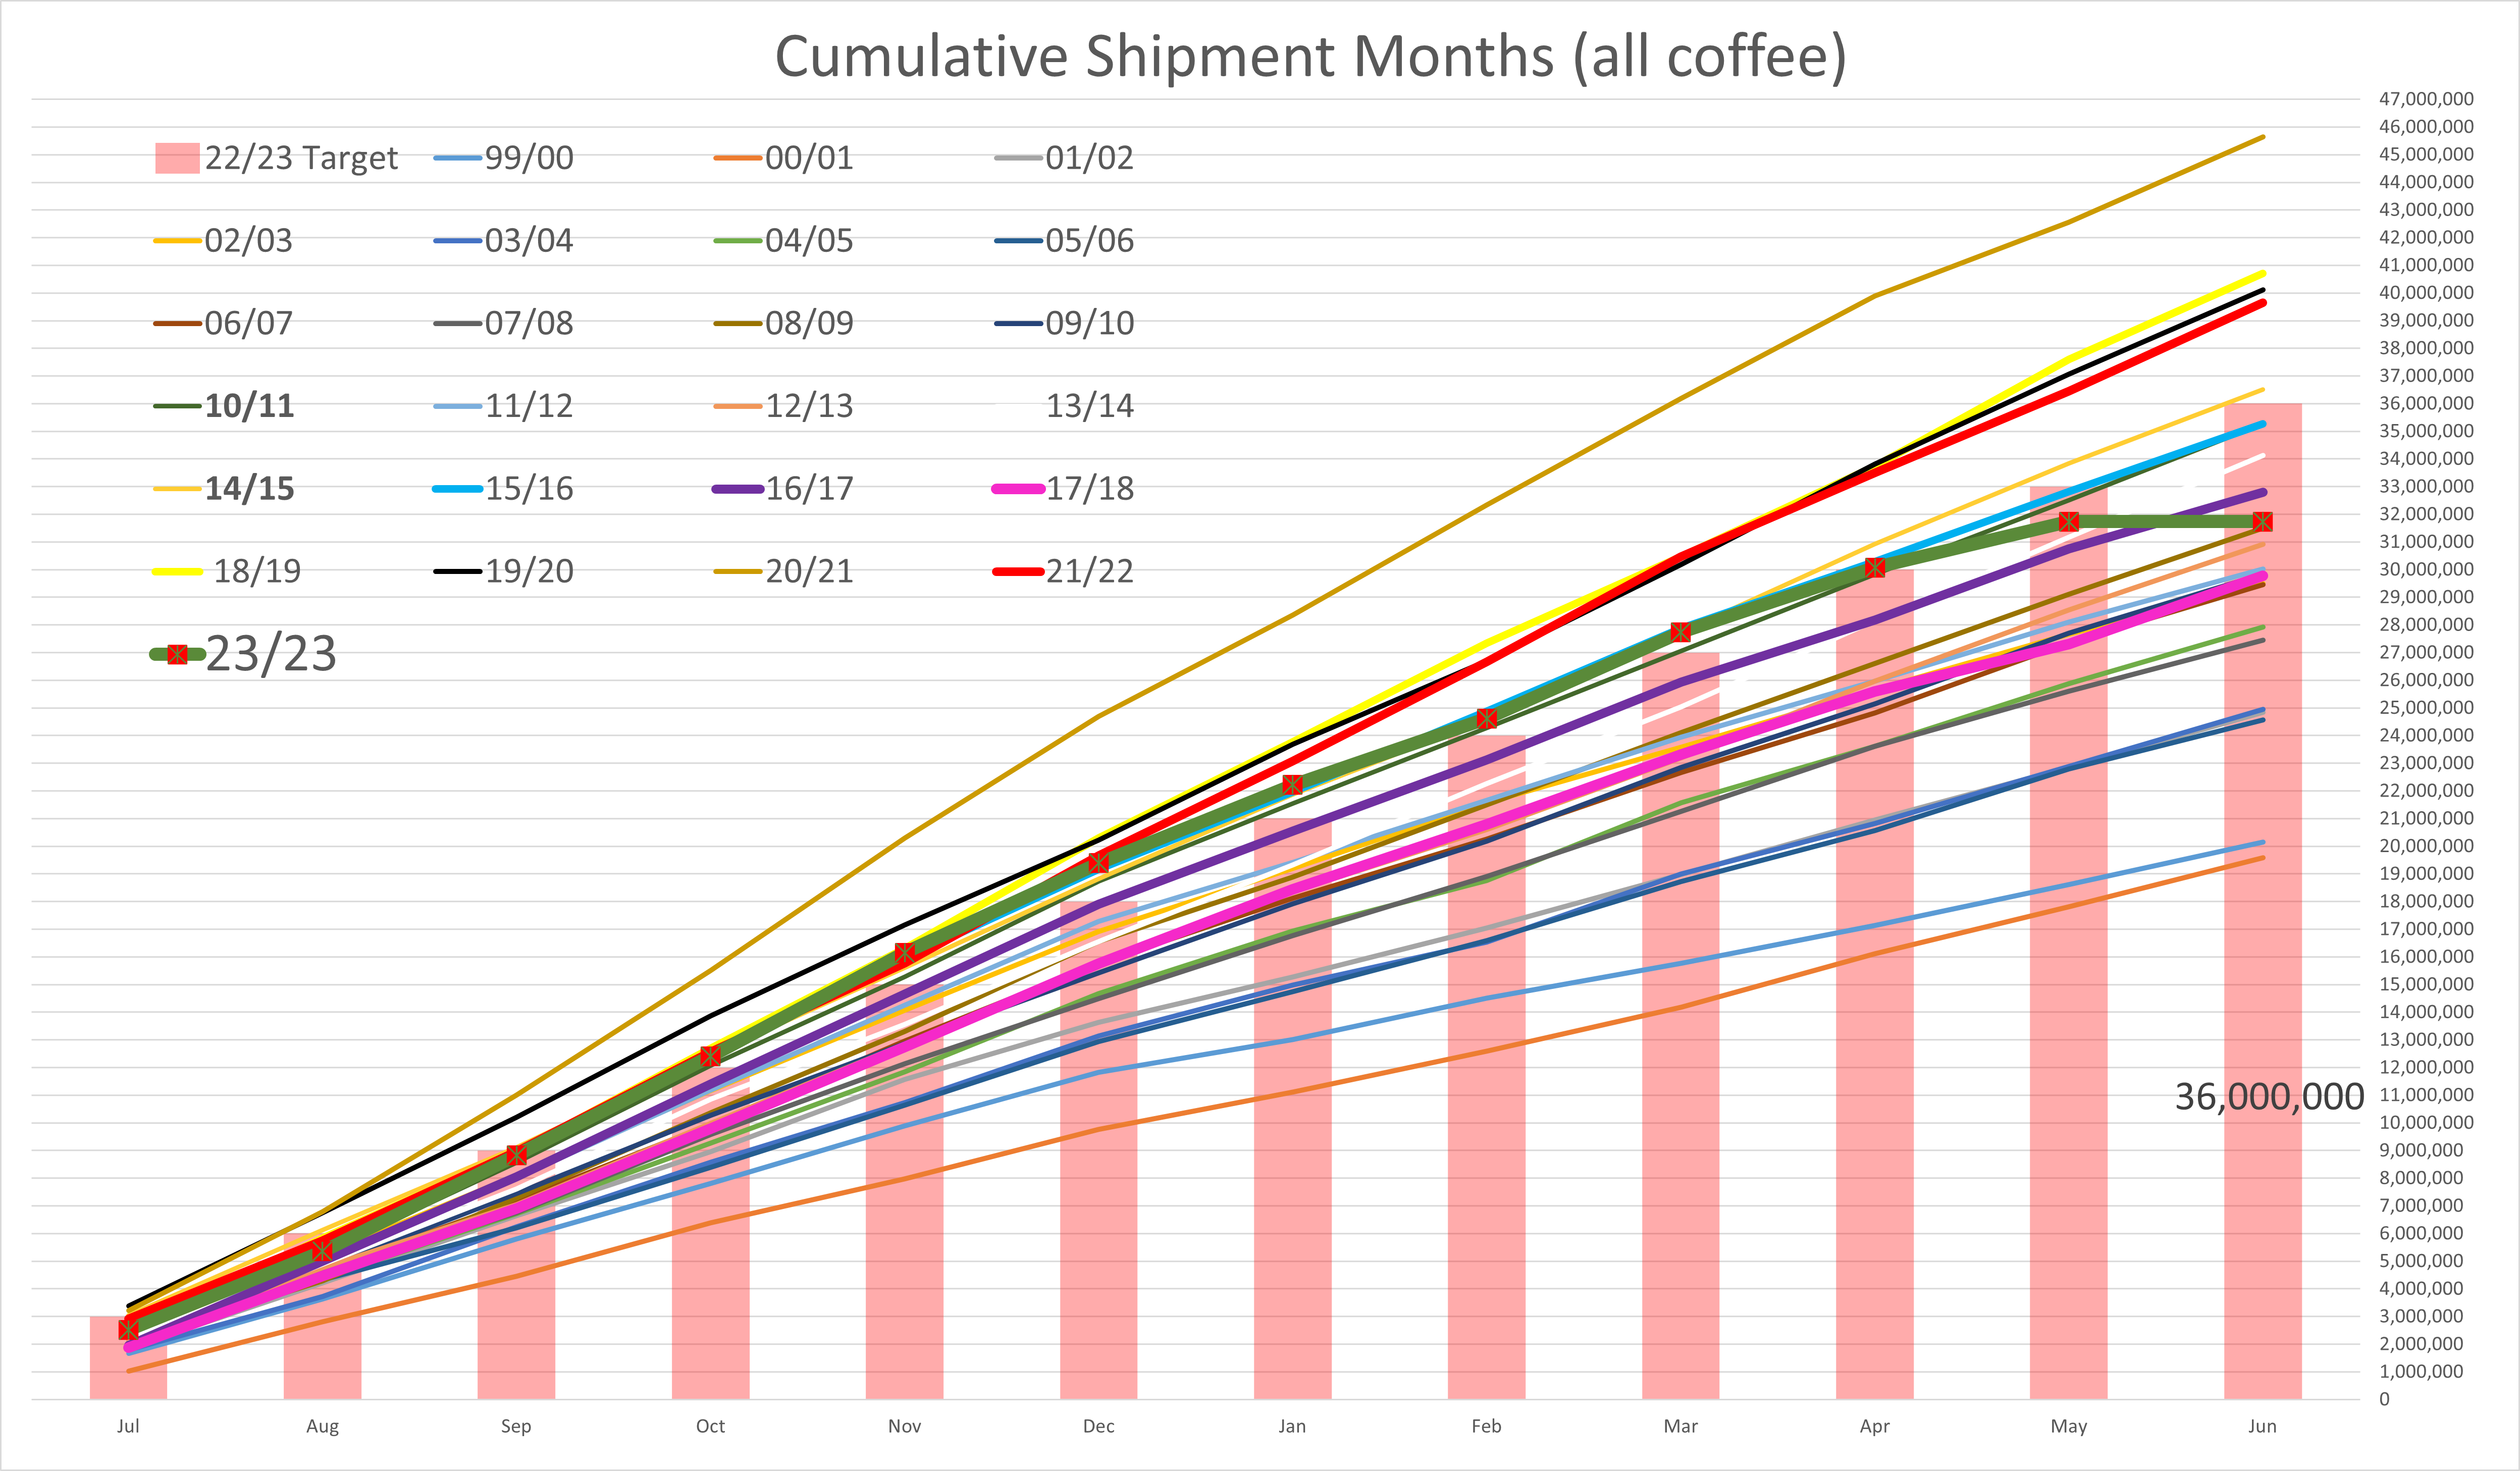
Brazil Export
- Point to 36 mm total for Jul/June, reflecting recent tightness and high diffs.
Brazilian Real
- 5.00 has been the line the sand for Real. It has been giving away and may lead to a higher valuation for the real. That would be supportive of the market. However, that were to be truly expected, it may also precipitate further selling of farmers believe it will strengthen.


US Dollar
- While it has rallied this month, I still expect it to depreciate another 10 % and that would be supportive of the market.
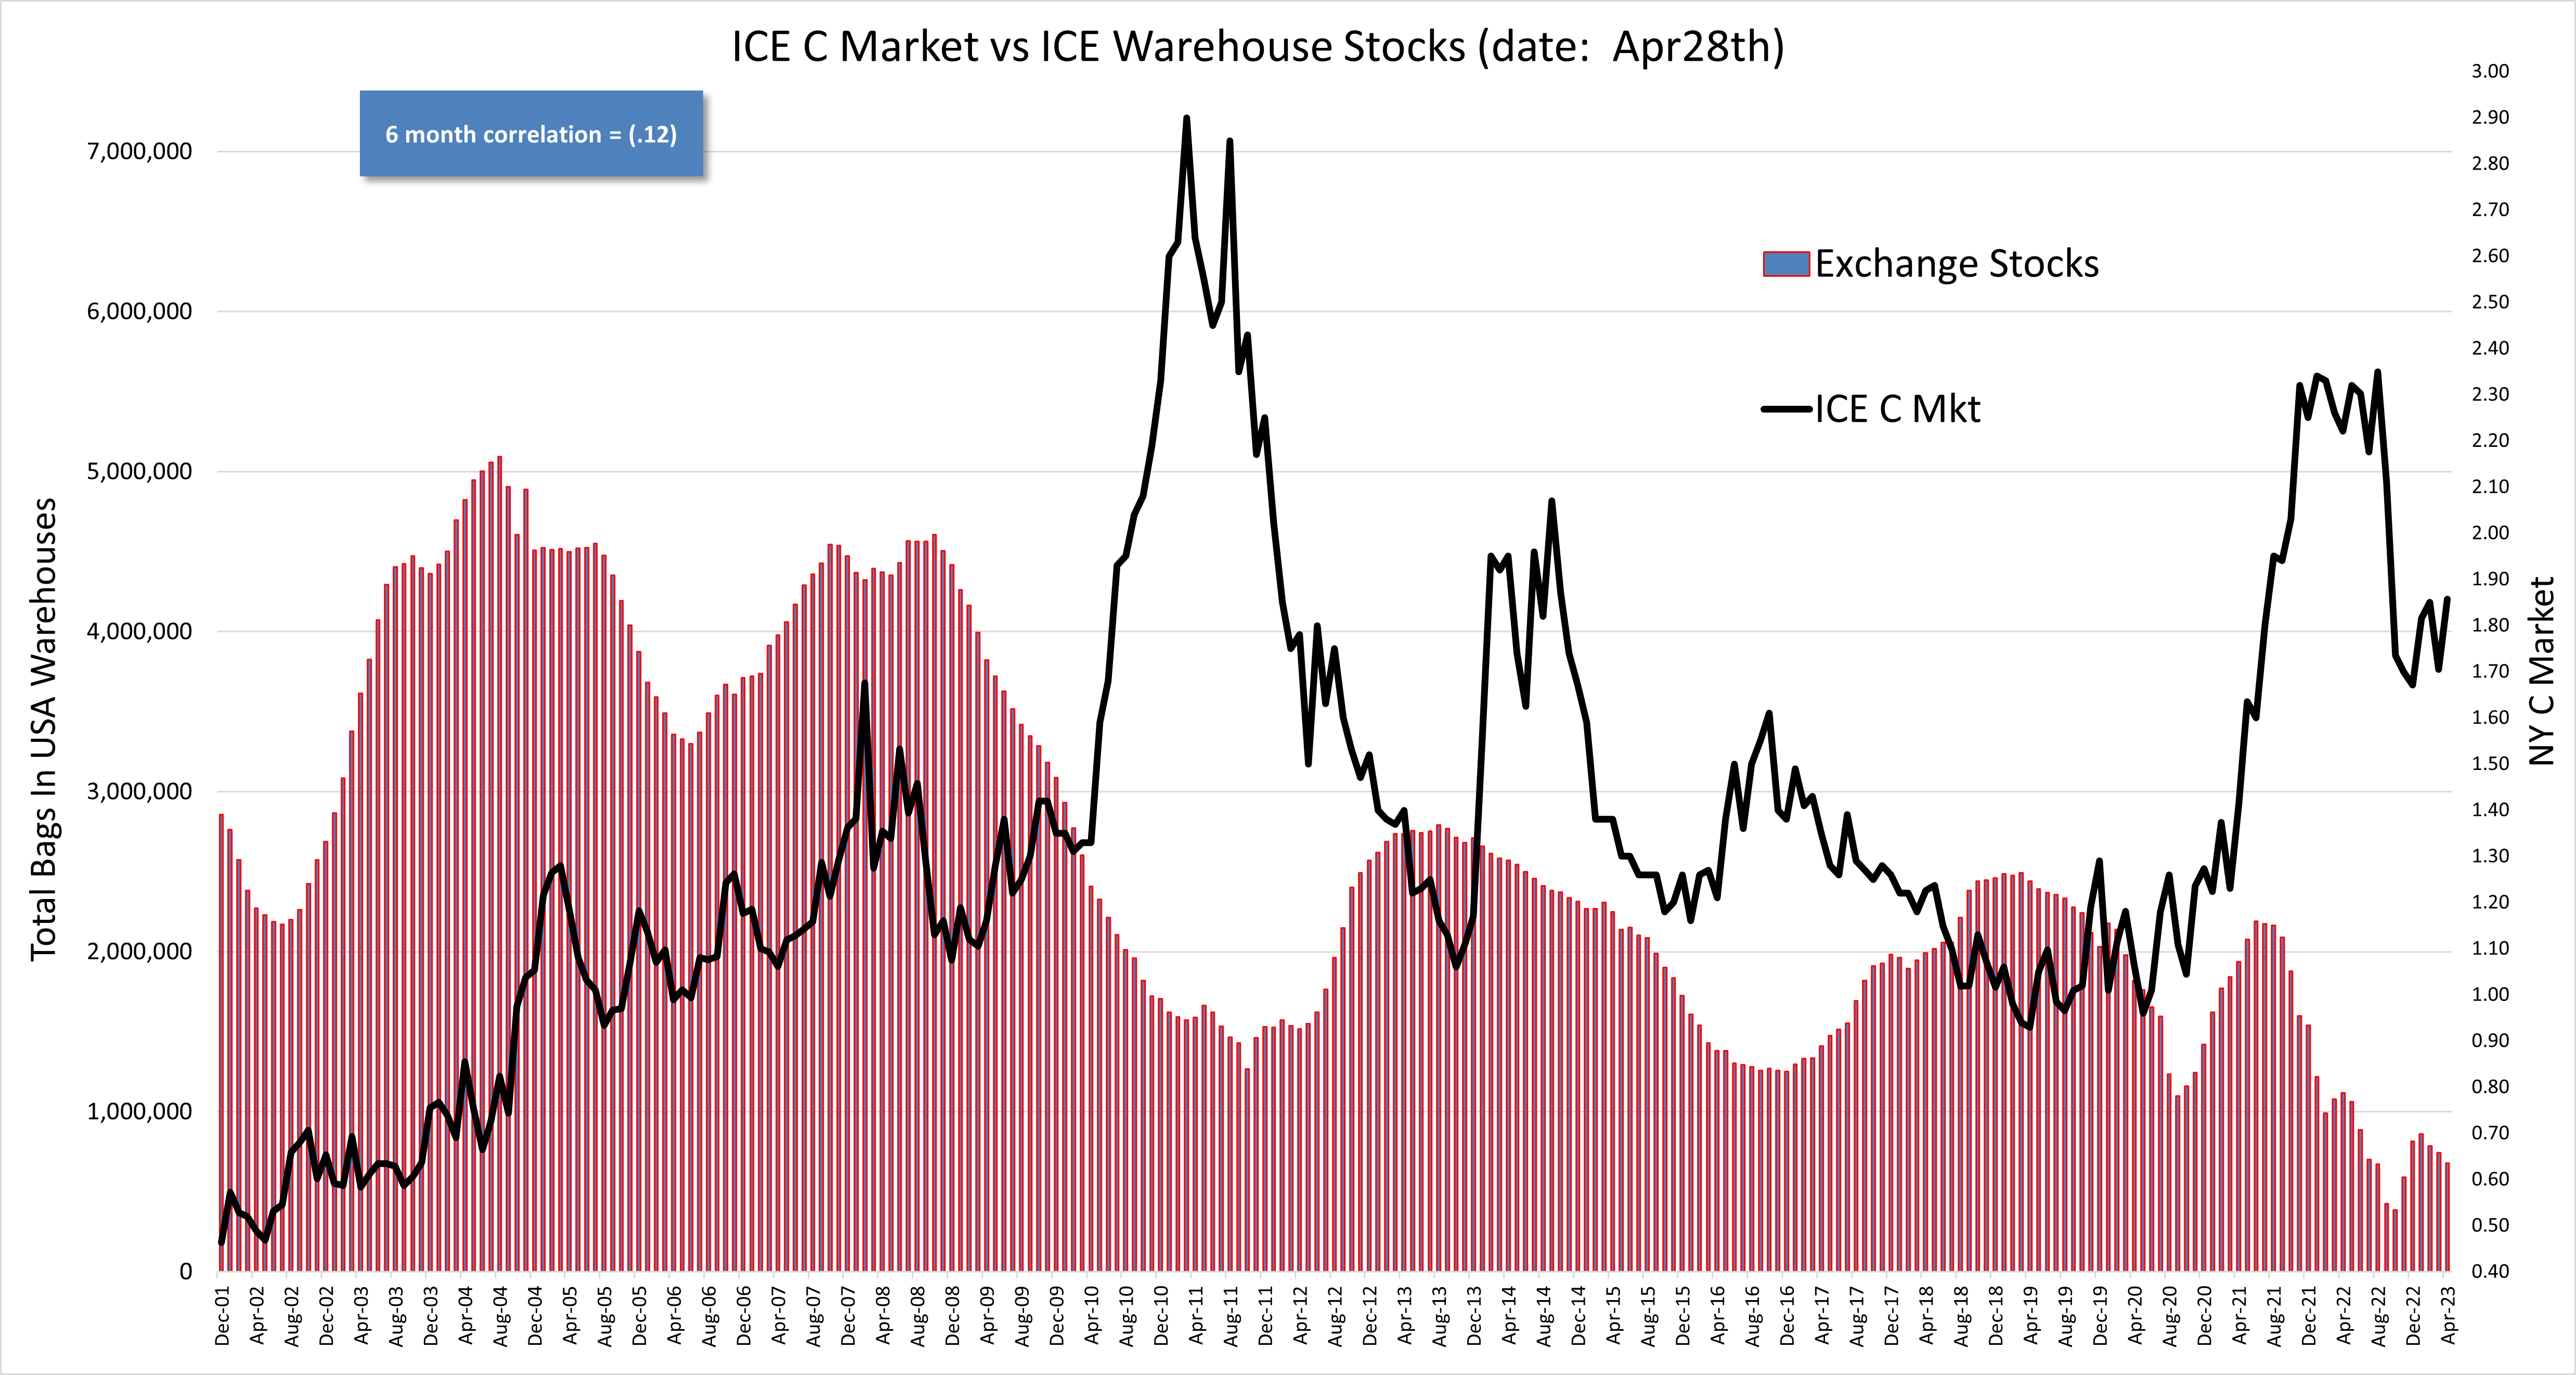
ICE Warehouse Stocks
- Stocks continue to dwindle.
- But difs are coming down and there should be a decent amount of Brazil 23/24 crop exchange grade available for delivery if the difs decrease enough or market inverts enough.
Summary
Expecting a lower market.