Market Report – Mar23
Summary
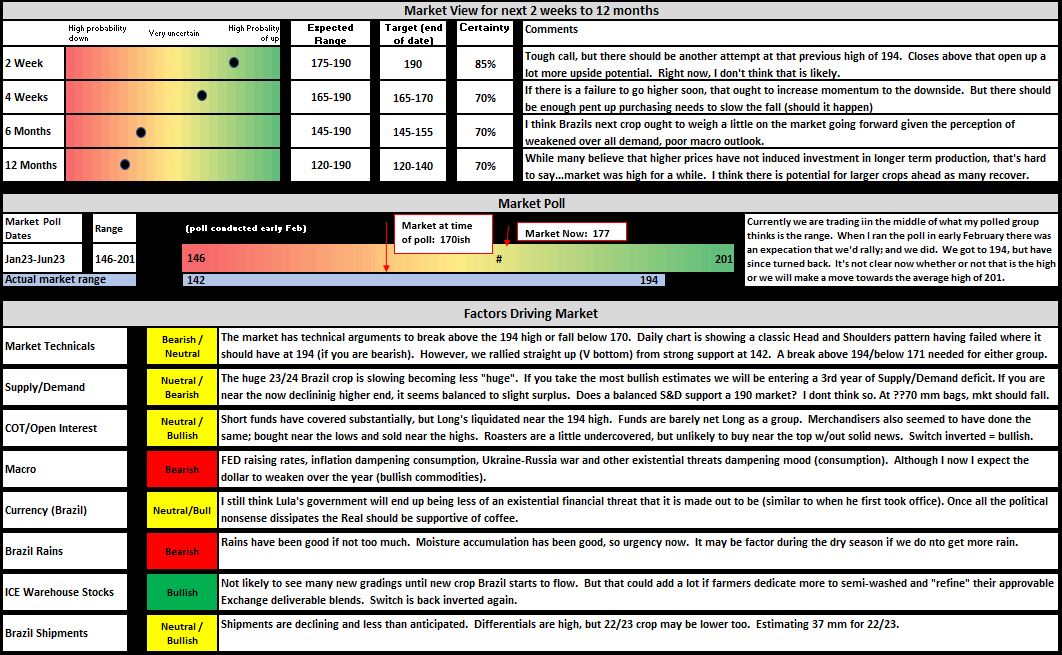
All of the following could be true and, maybe, equally likely:
- A break/close above 194.15 could take us to 220 +/-.
- A break/close below 171.05 could easily take us 142.05 low and below.
- Credible sources think Brazil 23/24 is 70 mm.
- Credible sources think Brazil 23/24 is 63 mm.
(note: last month’s market poll discussed below thinks its 66.6 mm)
- The “70 mm” group (formerly known as the 76 mm group) has dialed back their estimates over the months. (for the record, with the huge fall, I was leaning towards that number too)
- The “63 mm group” has held firm.
- We are heading for a crushing recession that will, well, crush demand (already weakened).
- Labor market is the strongest in decades and likely to limit any recession, thus, well, not crushing demand. (I always like to remind people that in 2008 with Spanish unemployment at 25 %, coffee consumption went up there)
A lot of competing ideas to keep the market interesting.
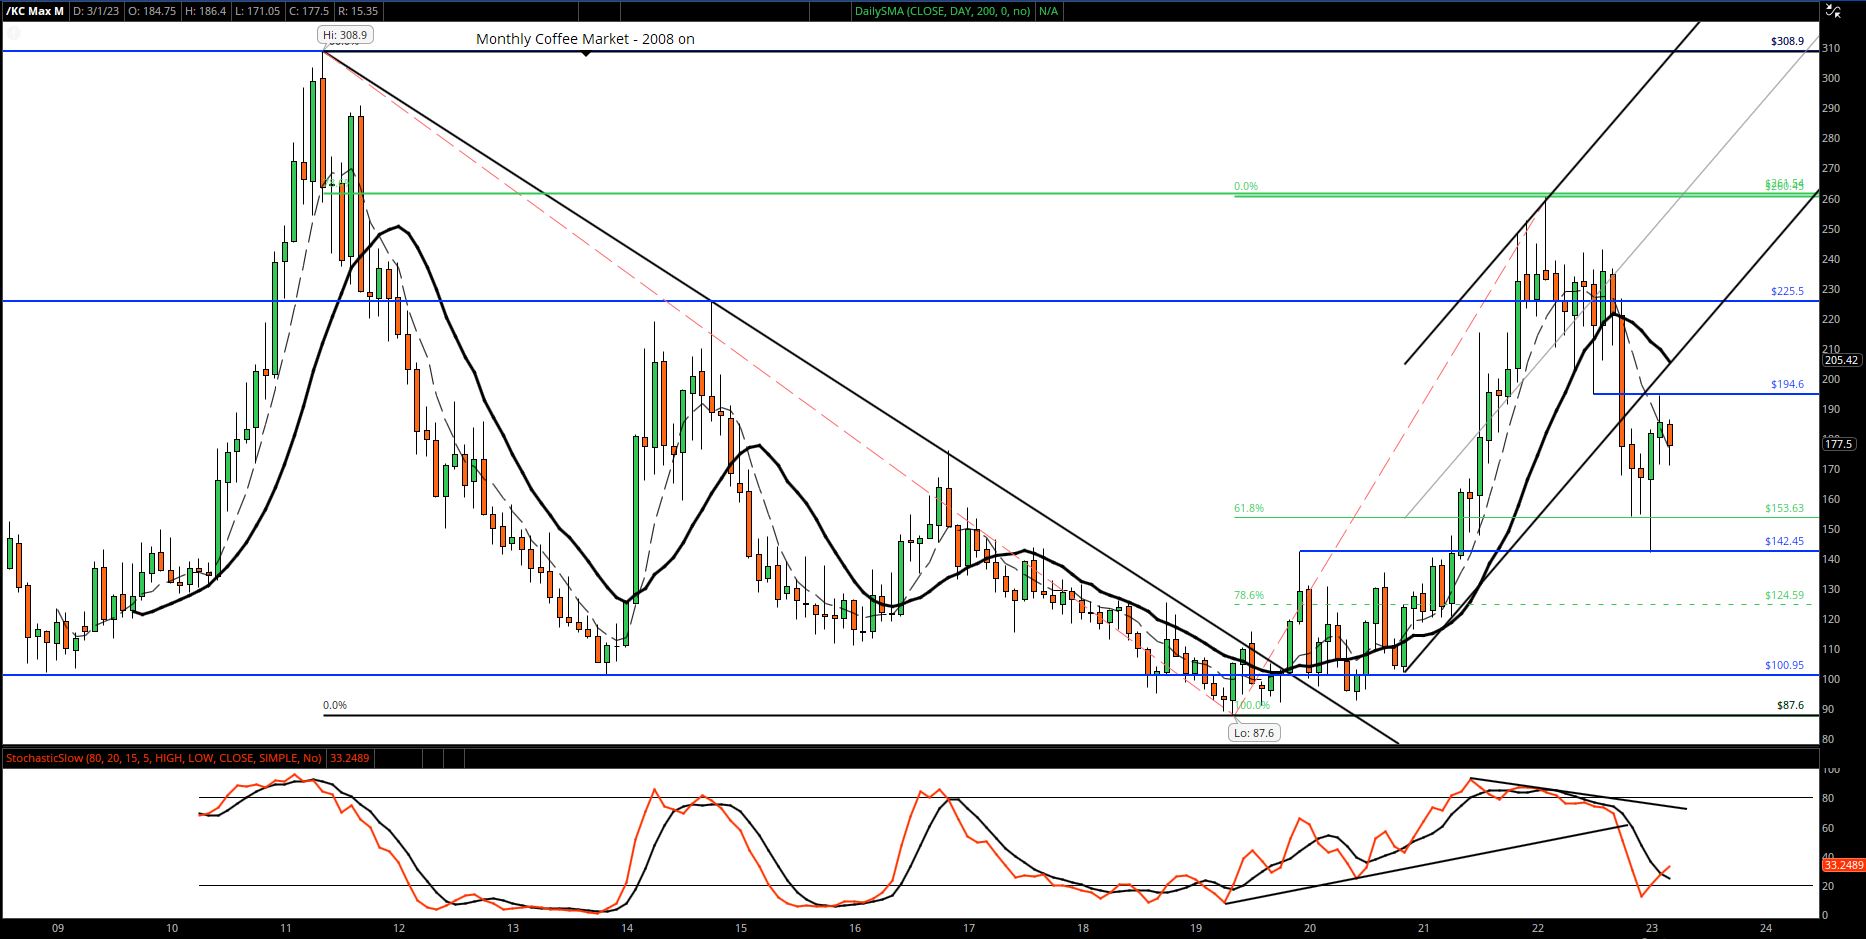
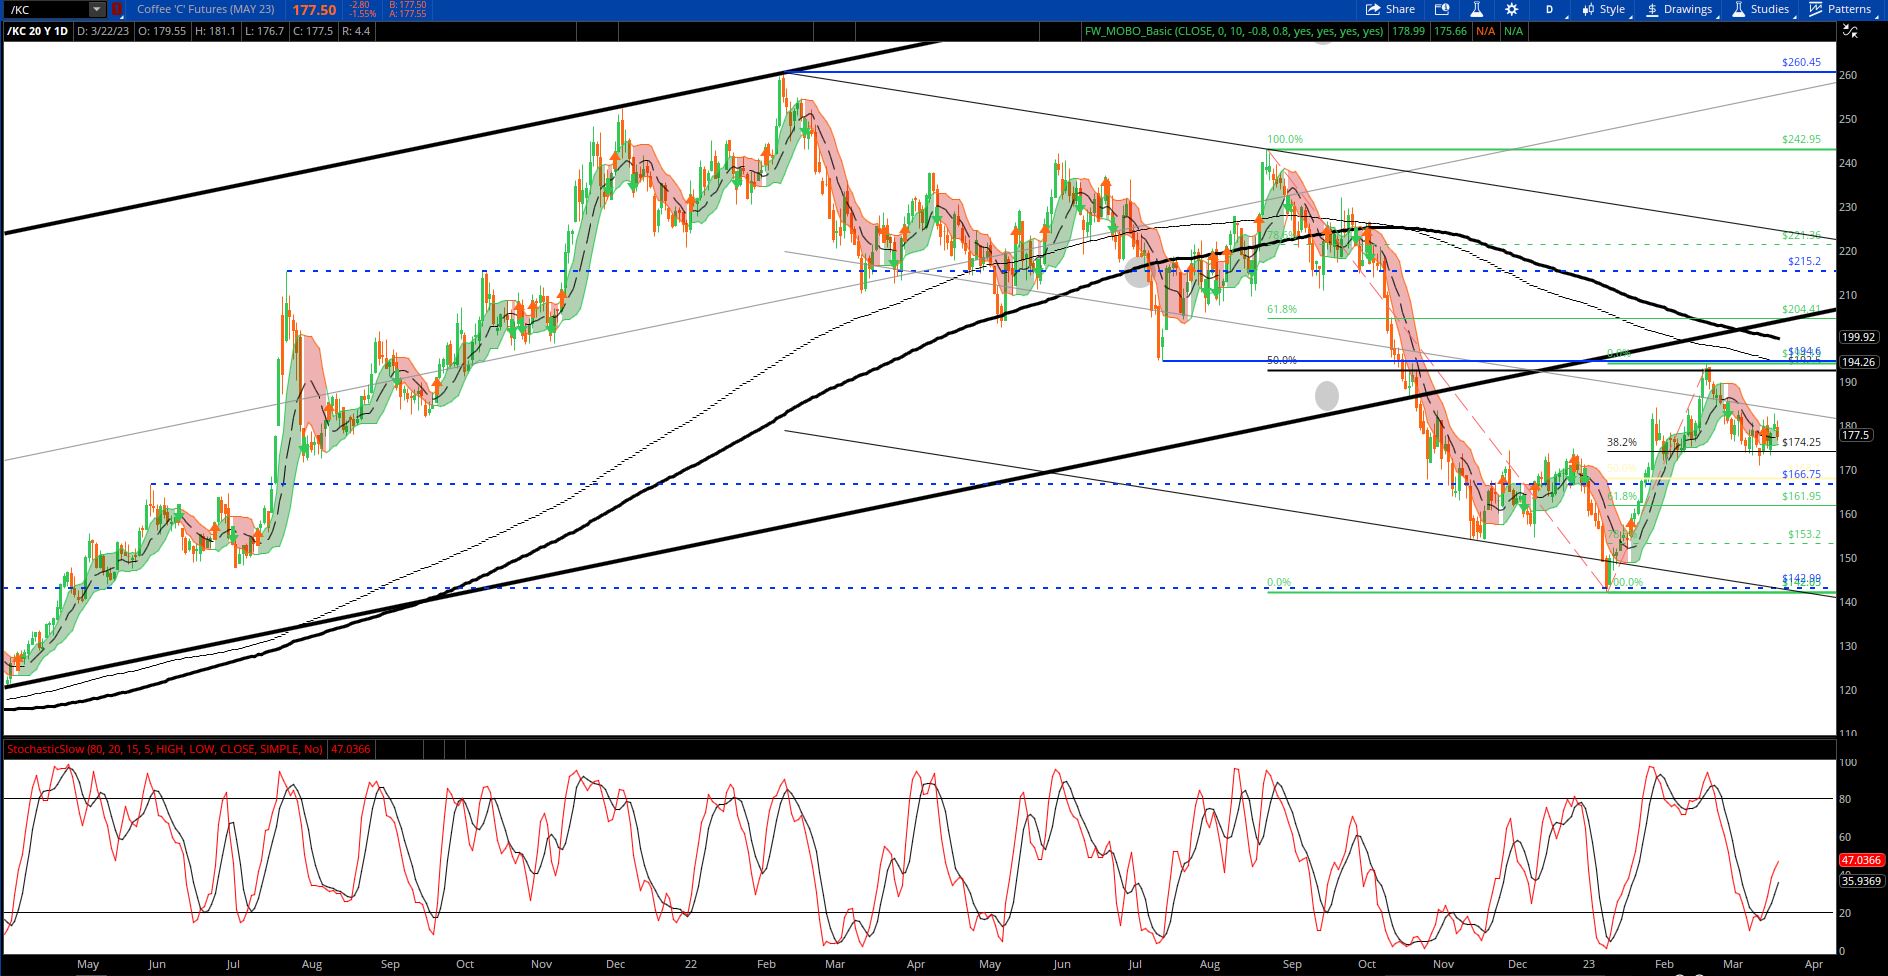
If I were to write a technical trading book I would use as an example the failure of the market to break 194.15 on the last rally as a textbook case of counter trend rally that needed to fail at the previous support from July22 (194.60) of last year to maintain the market in bear mode. That is what happened: 194.60 was the old support point that failed. Furthermore, this last rally was nearly a perfect 50 % retracement of the 240 to 142 collapse last Fall.
If I were to write a book that highlighted a textbook case of the end of a bear move, it would have been the Jan23 low of 142.05. That was also the exact breakout point of the previous rally. It also keeps in play the idea that the huge fall to 142 was just a correction; ie, we might have another leg up.
So, take above with a grain of salt. Point being, there are solid technical arguments that we will fall or break higher. As discussed below, there are also solid fundamental arguments to support both sides (as always and why coffee is so much fun).
To cut to the chase, and despite so many unknowns and competing theories, I am still more bearish than bullish, but positioned slightly long as there may be some more short-term factors that provide support and suggest at least another attempt at 194.
Recommendations
Last month I recommended to clients short term call spreads vs selling 162.50 puts that so far has proved well advised.
Since I am still slightly bearish I am hesitant to be aggressive with any buying strategies. But, given “frost” season and the general tightness in Brazil, I would likely recommend similar strategies if the market dips a bit. I think it’s unlikely that we fall straight down again in the short/medium term. And I would still like to protect against the possibility that the whole move to 142.15 was just a correction against a longer term bull market (that is possible). Maybe a Sep195/225 call spread vs Sep 150 put; that might be close to even money.
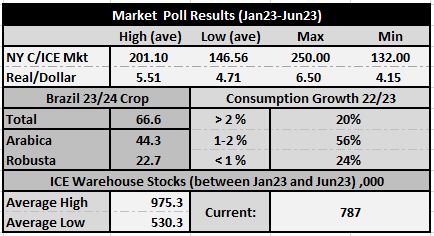
Market Poll – Jan23-Jun23
- Results from market poll conducted in early February.
- Highlights:
- Participants expect a market range of 146 to 201 between Jan23 and Jun23.
- Brazil 23/24 crop of 66.6 mm
- Consumption expected to be in the 1 % to 2 %.
- 25 % think it might be below 1 %.
- ICE stocks are expected to stay between 530 and 975.
Summary Graphic
- Below graphic summarizes my longer term views.
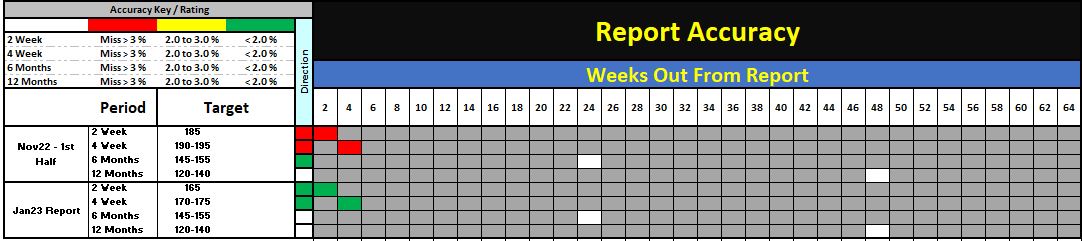
Market Prediction Accuracy
- As always, I am updating my predictions vs. what actually happened.
Supporting Graphs
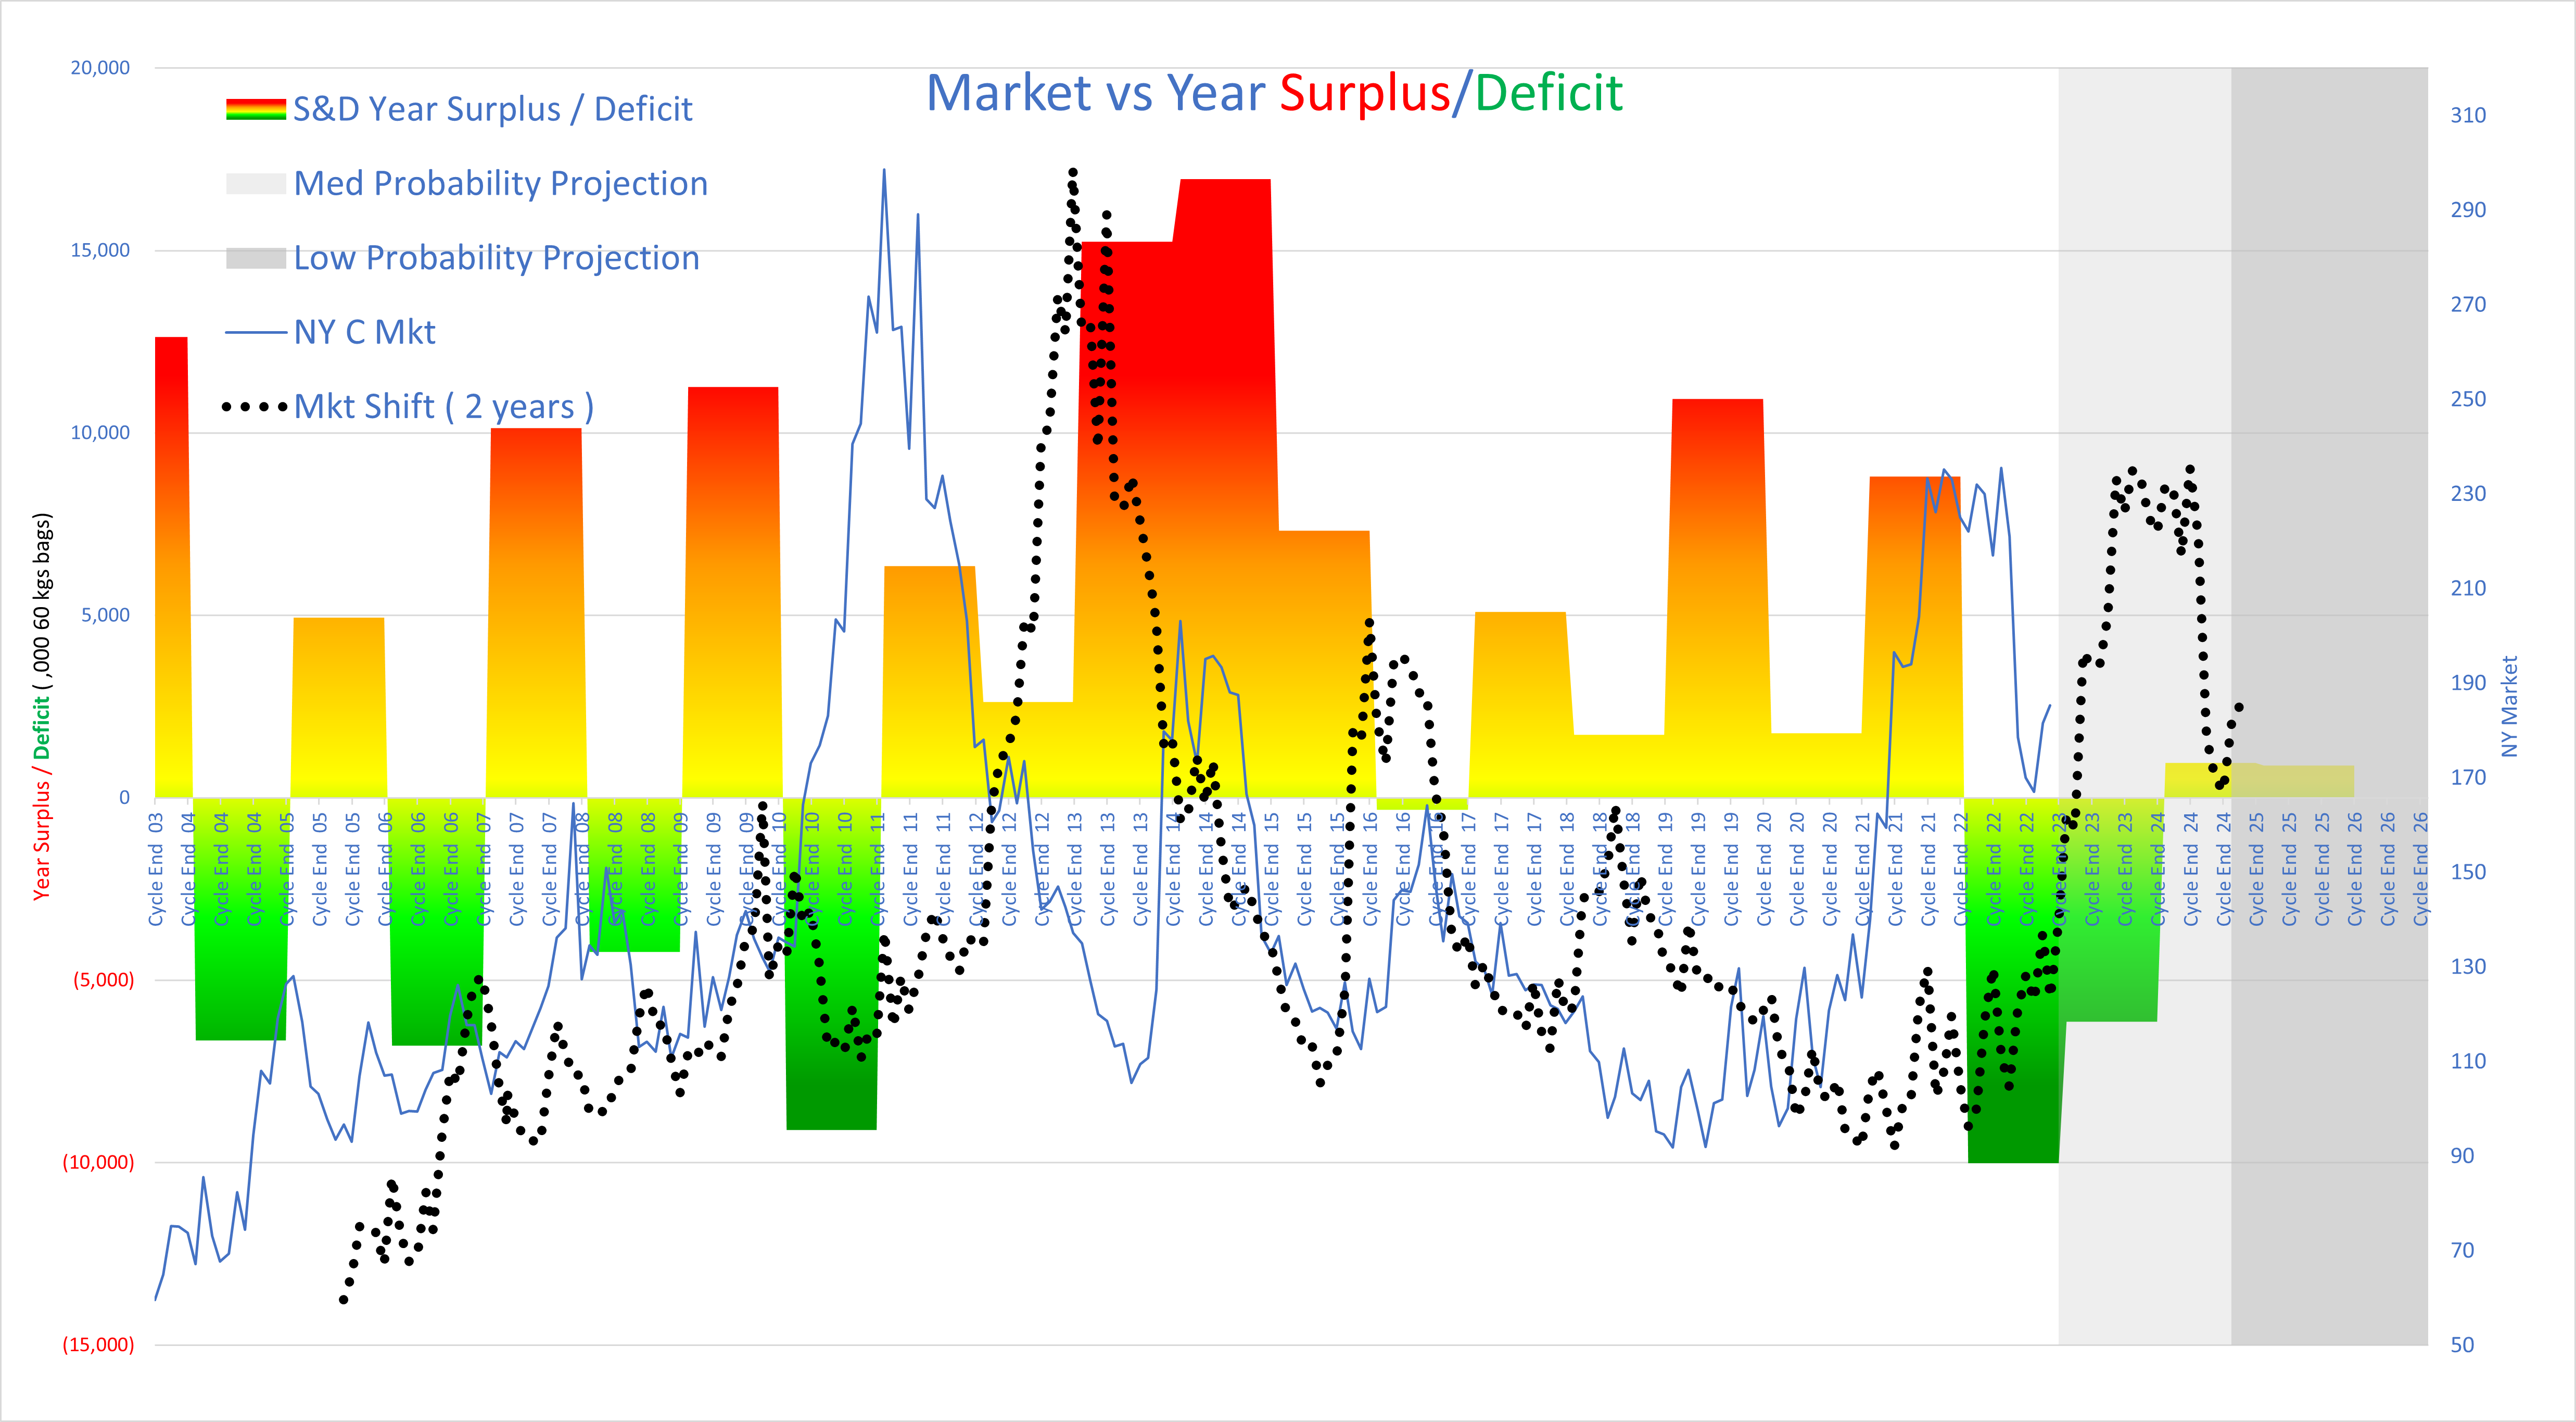
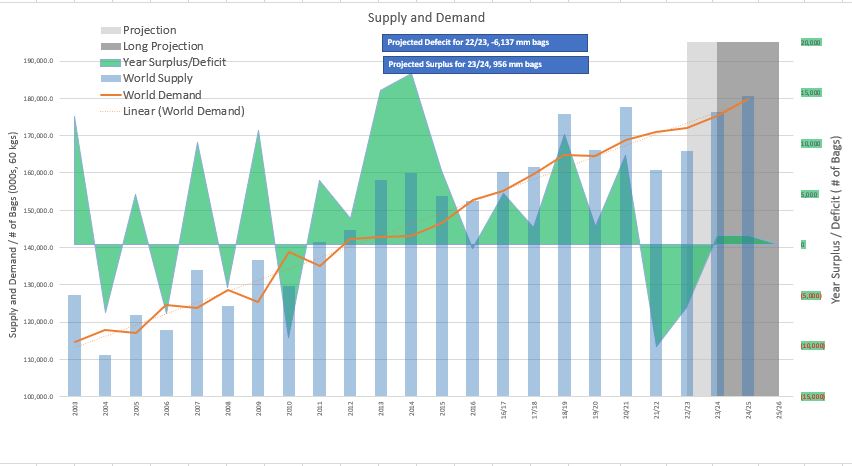
Supply and Demand
- The first graph superimposes the market that is shifted 2 years forward over the yearly Surplus/Deficits (dotted black line). The 2 year shift tends to line up bull markets with deficits and bear markets with surpluses. Forward guestimates right now suggest either tightness or slight surplus. Some are suggesting a 3 year of deficit for 23/24.
- As my graphs suggest it’s not very bullish or bearish, but the market is also at 180 which is high. Even with balanced supply and demand, market should creep lower.
- However, if it turns out to be another year or two of deficits, then we ought to see another good leg up.
Market Graphs
- What really stands out is the failure to break 194.60. That now becomes THE LINE IN THE SAND. Closes above here should change the perception that we are going down.
- However, since the market failed there, it adds probability to the idea that we are in a bear market and ought to see lower lows this year.
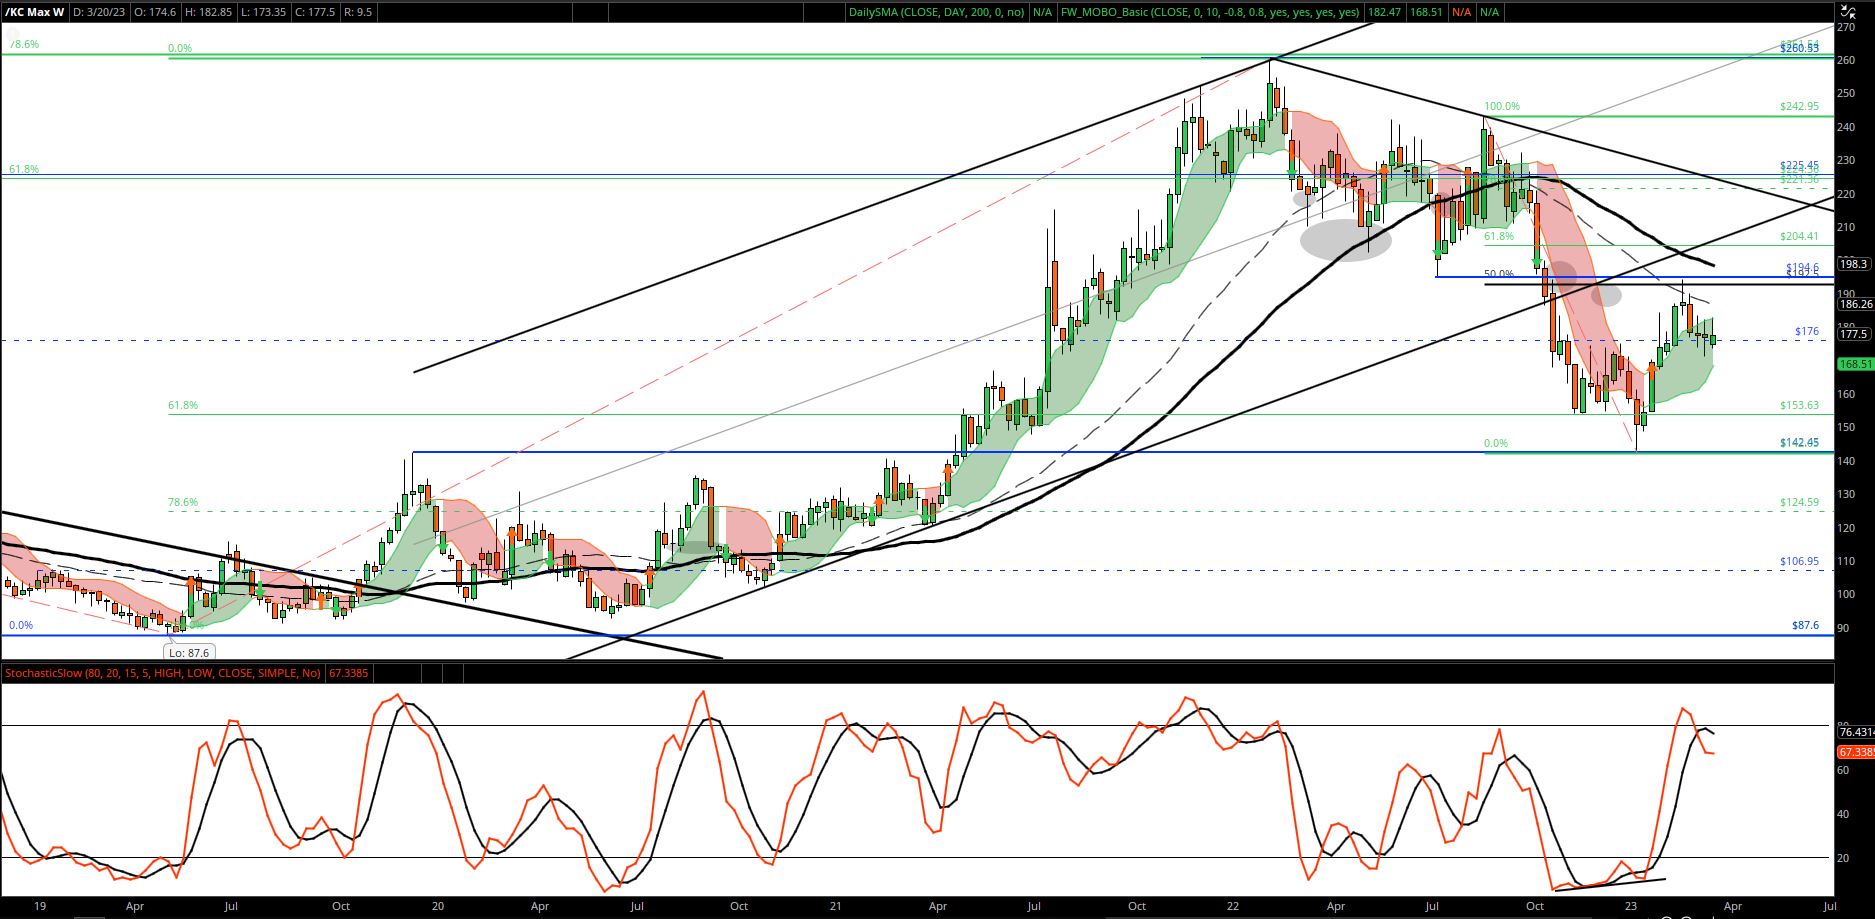
- Weekly is still trading within the green shaded area which is supportive. But the recent weekly highs have been capped by the upper band (not supportive of further highs).
- Weekly also has a strong bearish gravestone doji candle pattern at the top.
- Daily shows well the amount of technical resistance the market will find around 194 to 200. That would break the 194.60, but if we do make there and it can’t be sustained, then I think that all but guarantees lower markets this year. That is the playbook from which I am operating currently
- Monthly – Weekly – Daily
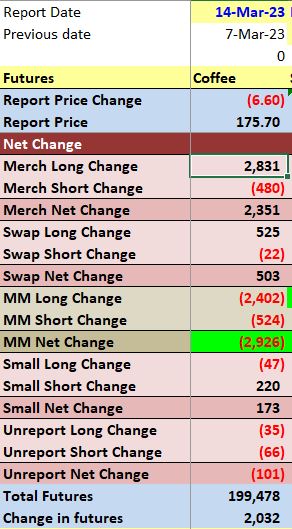
COT Open Interest
Weekly Summary
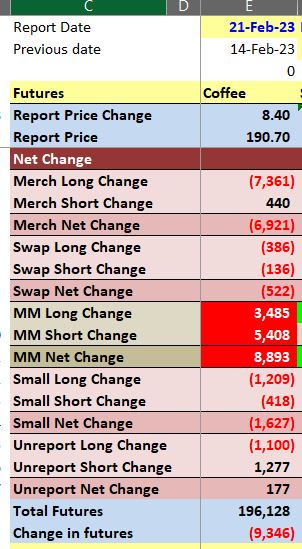
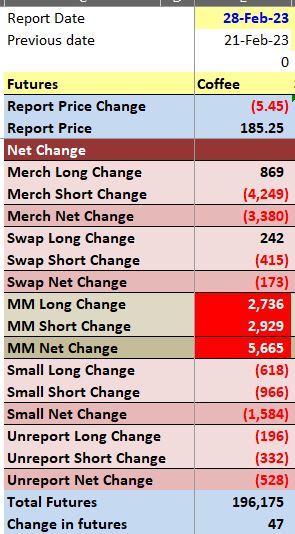
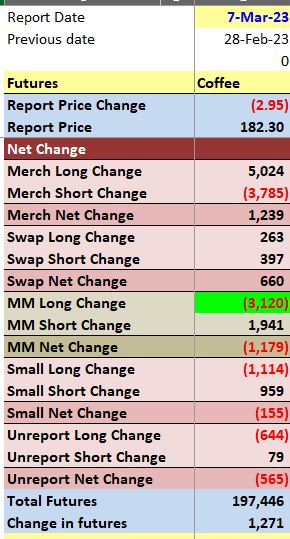
- Below shows the weekly changes beginning on Report market date (Tuesday) for Feb21.
- What stands out is the willingness for Merchandising side to sell into 190/194, including “roaster” column.
- As the market pulled back from there you see increased shorts in the “producer” side: ie, they liked selling there.
- That big run up probably ‘spooked” roasters as they started buying again on the dips lower.
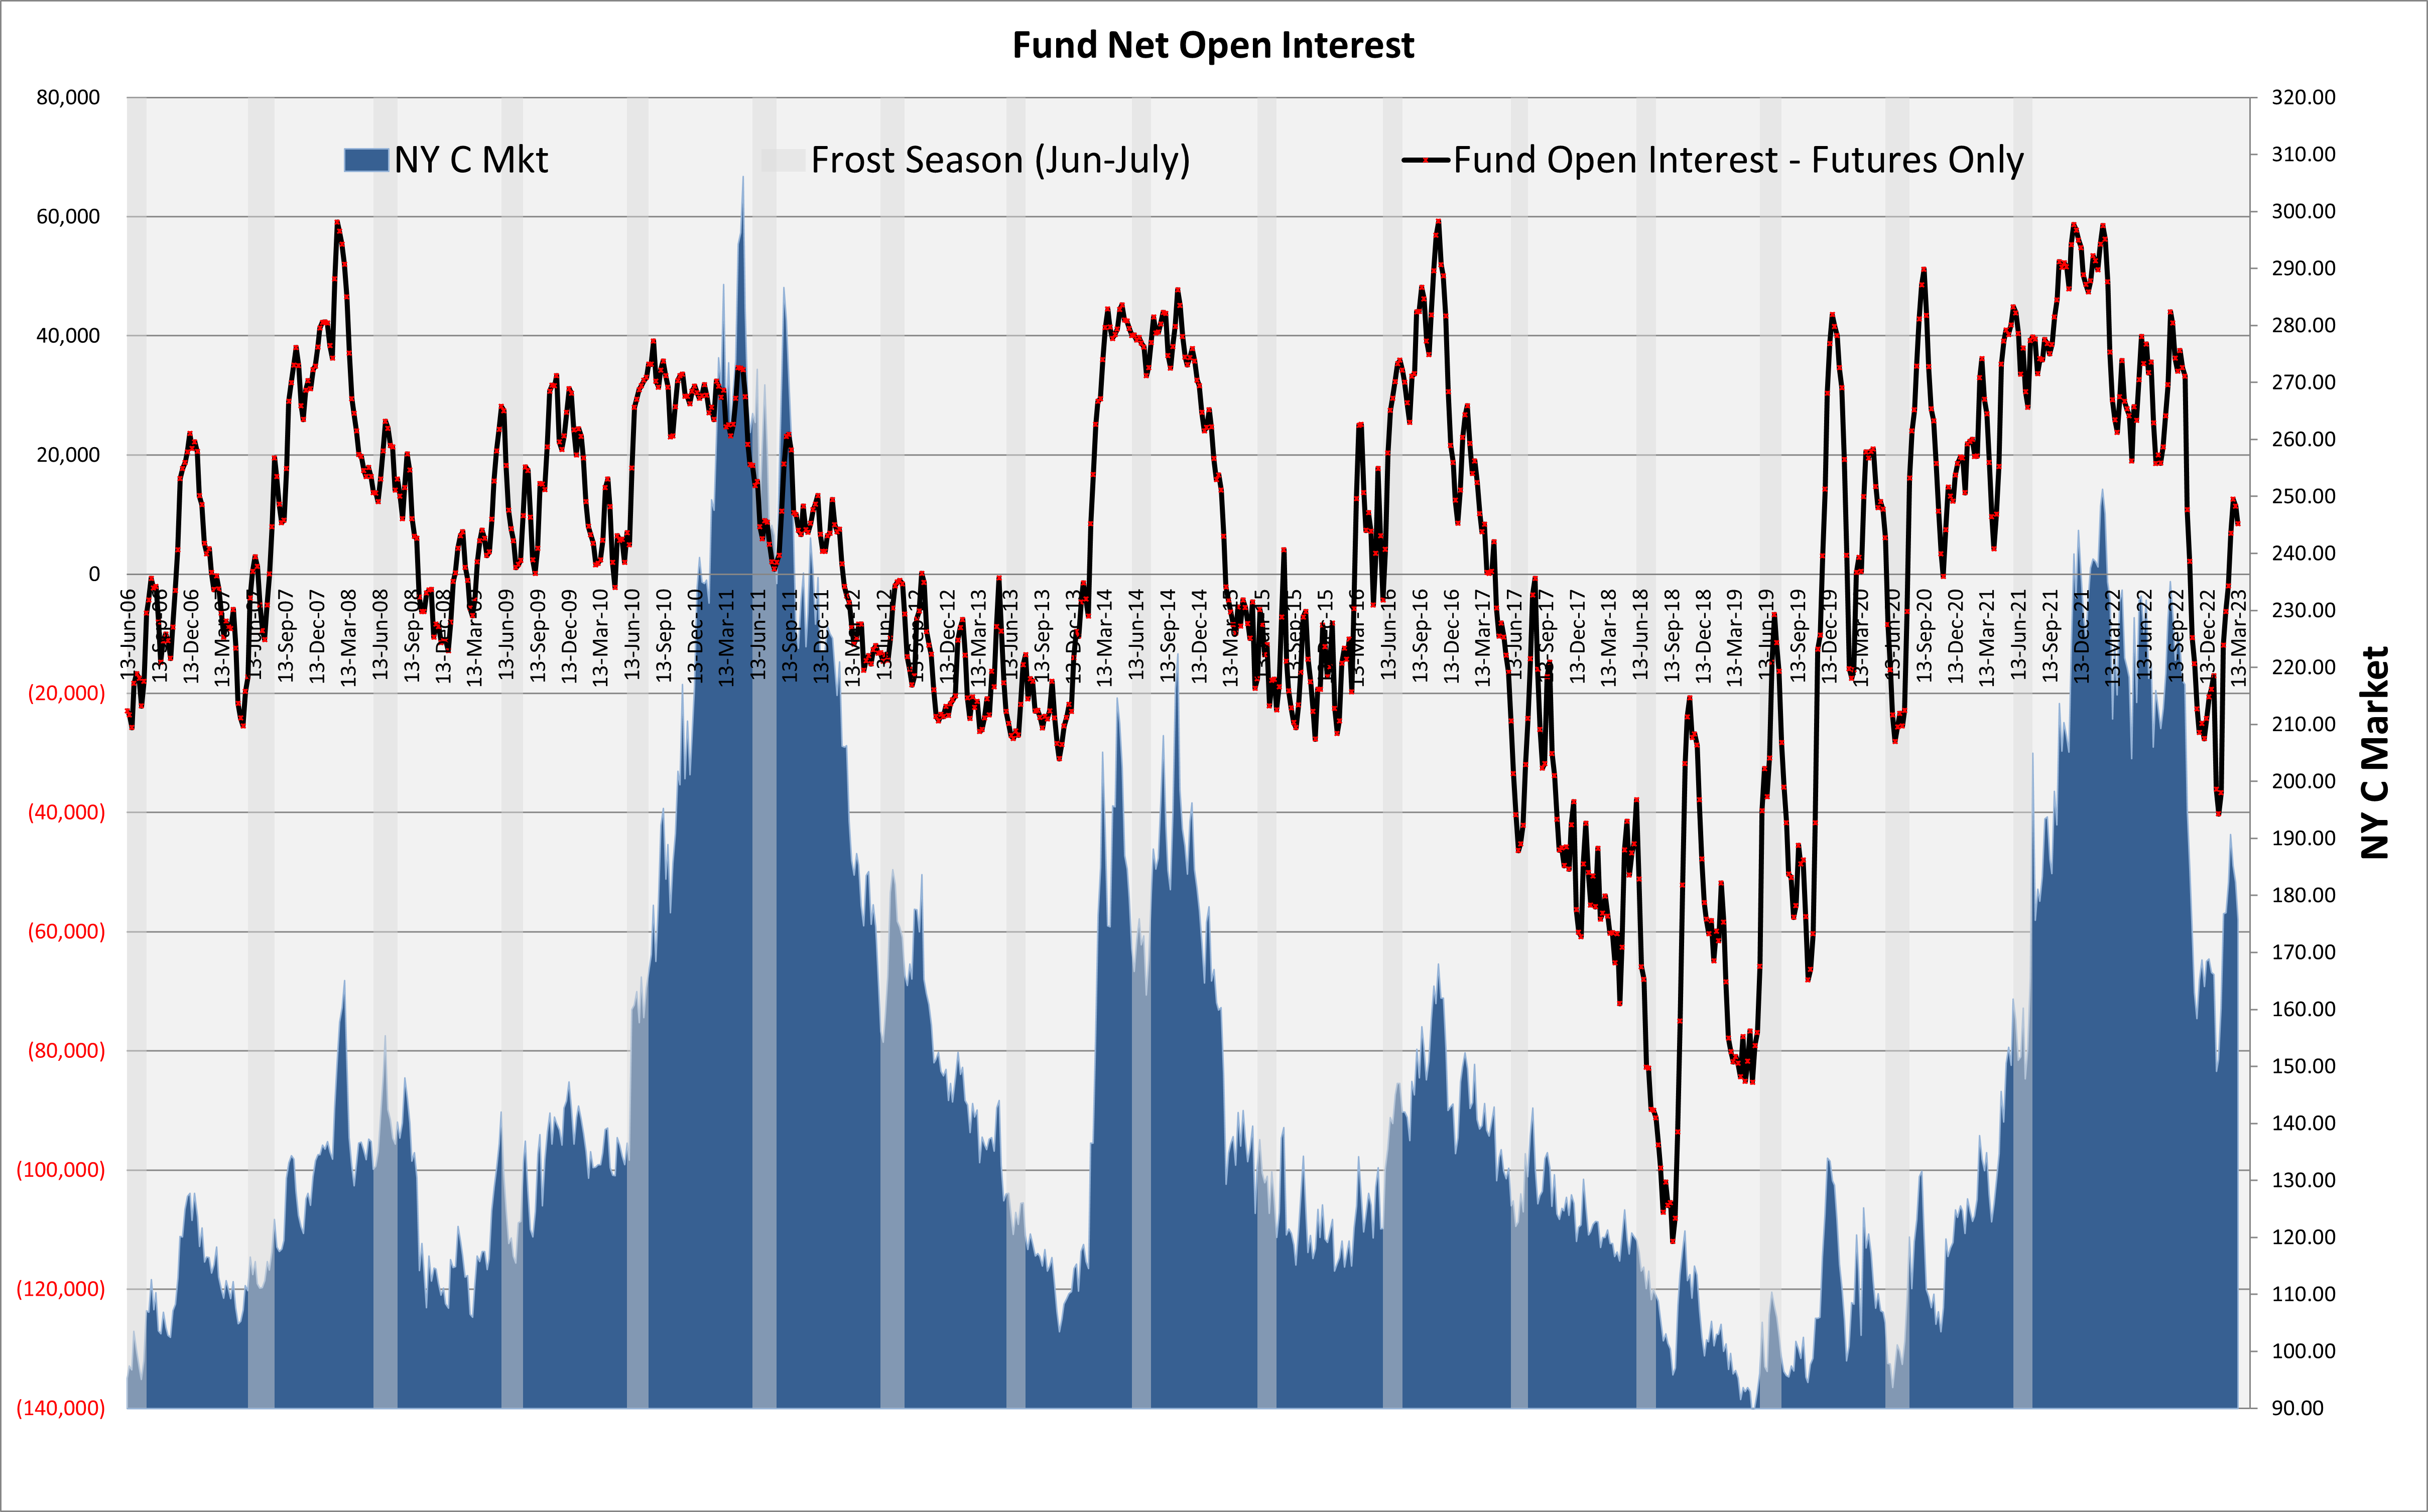
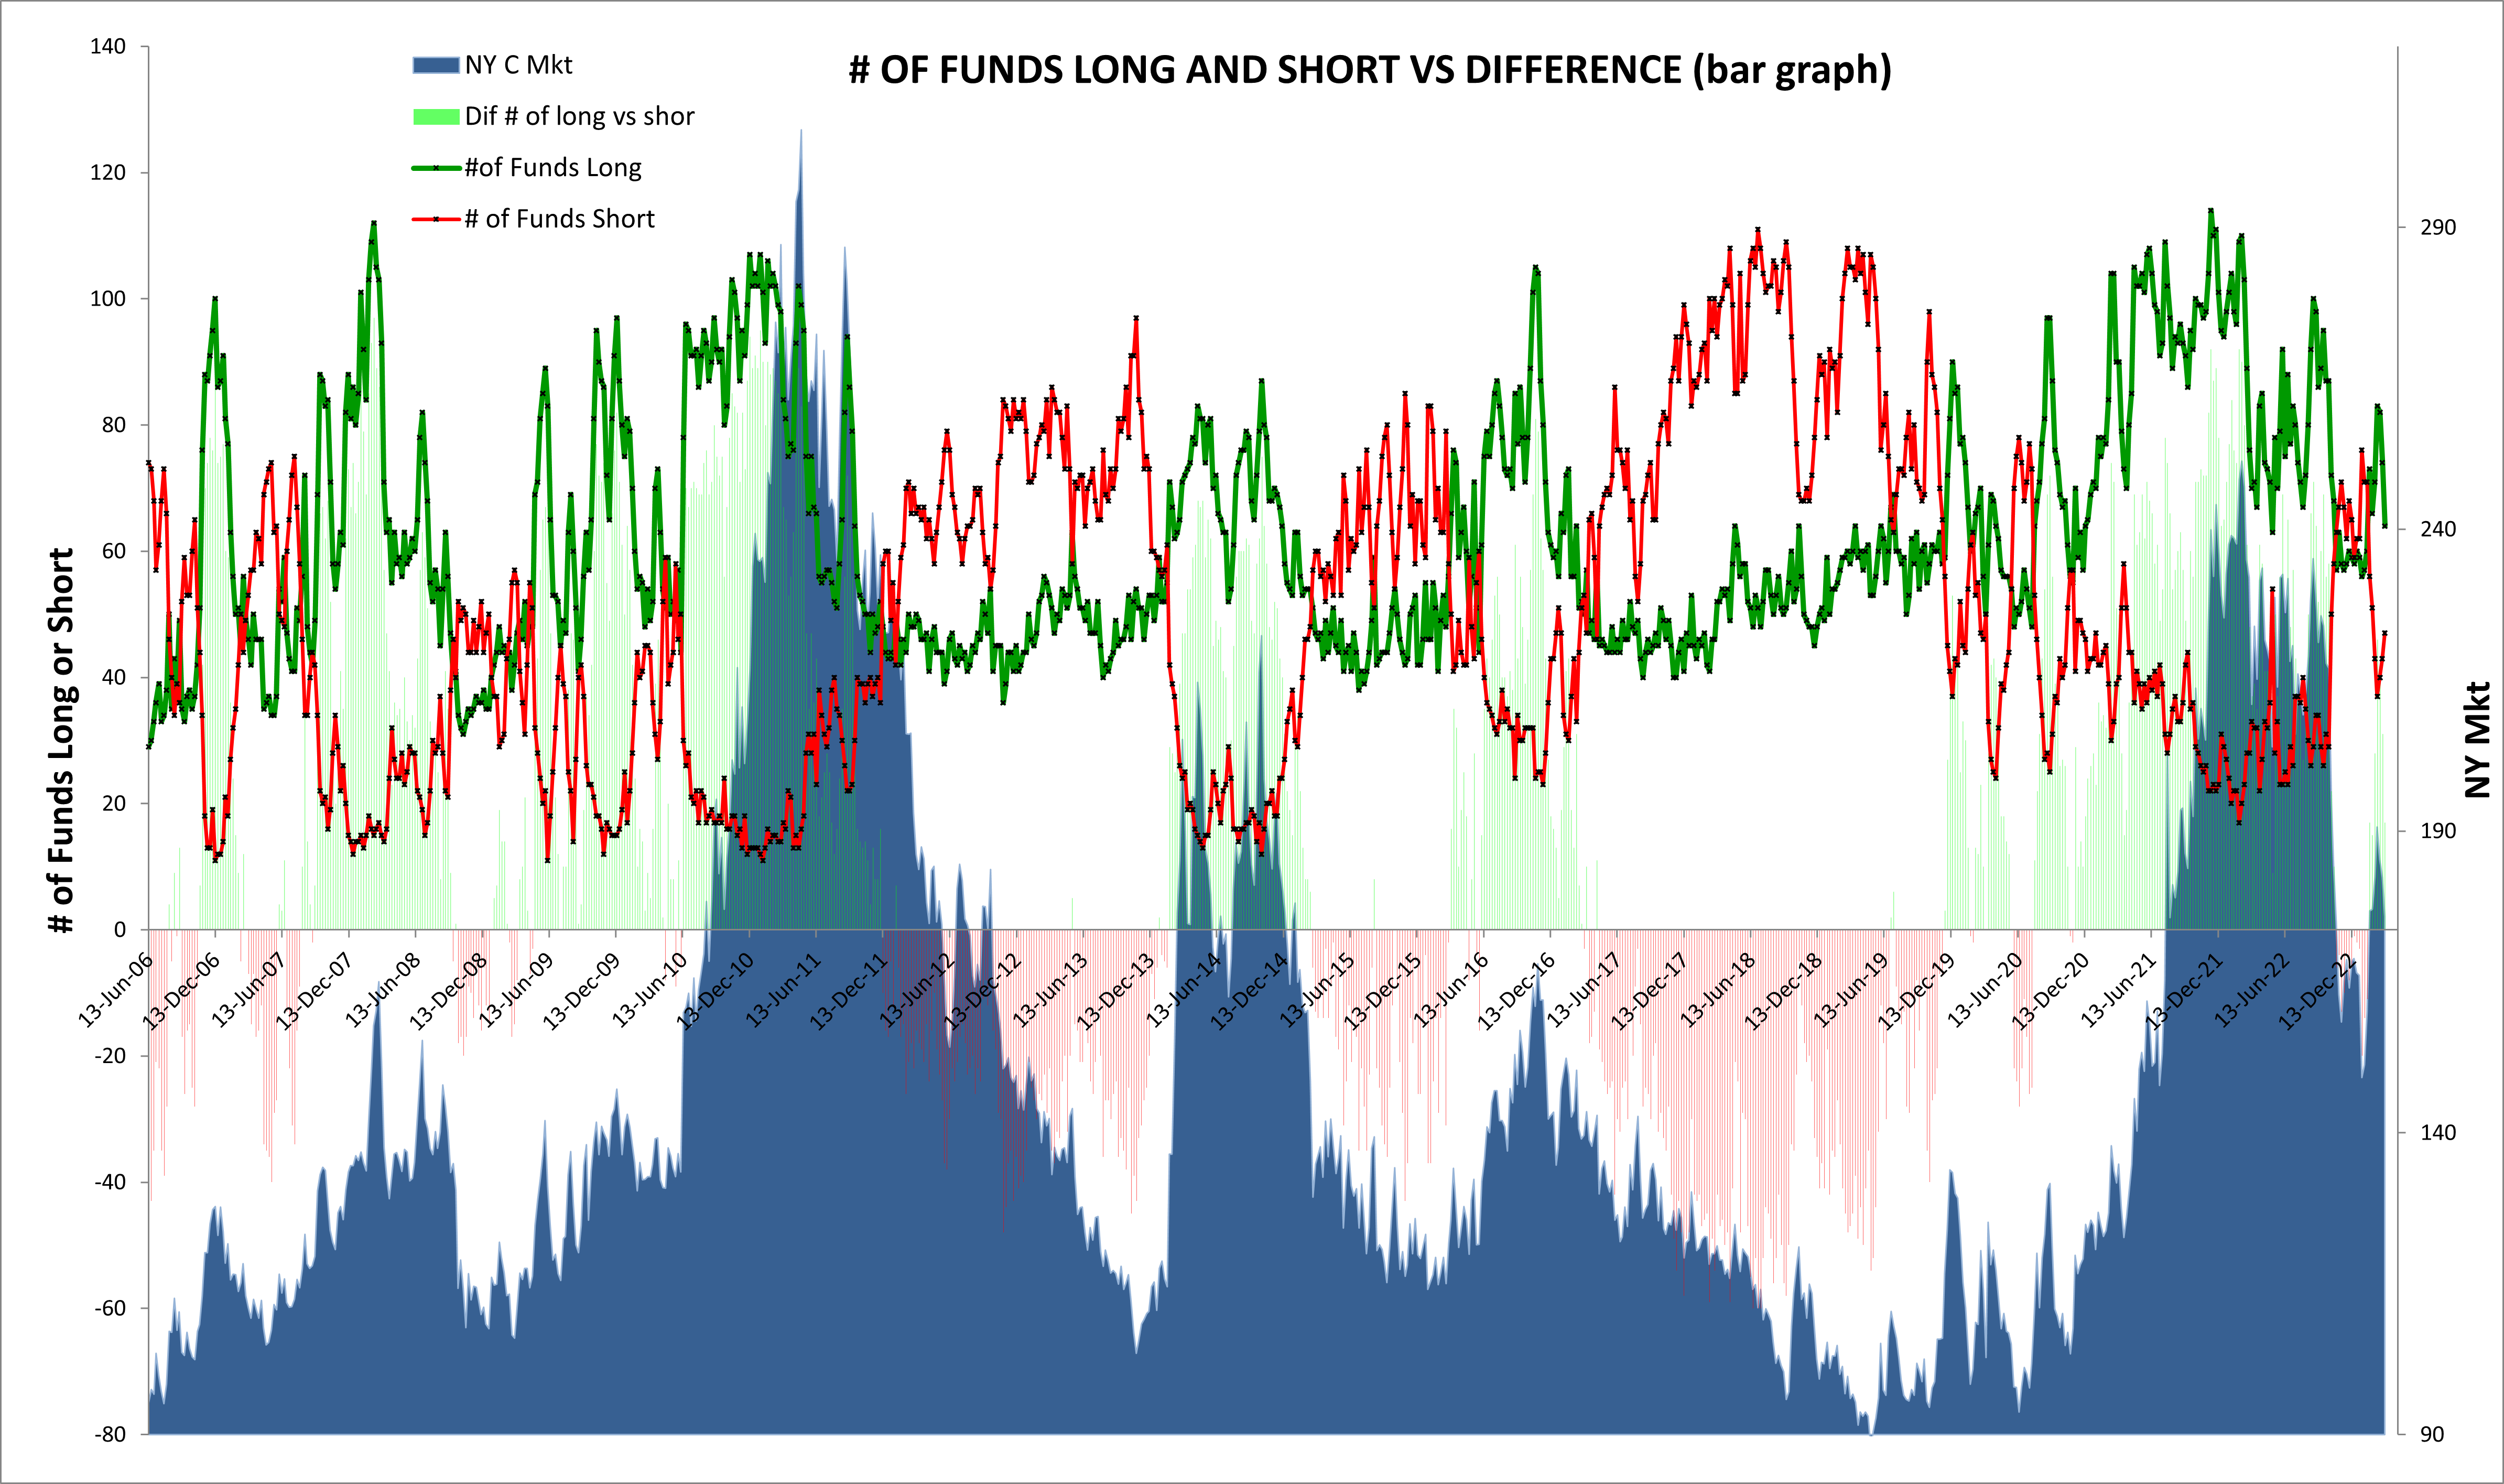
Managed Money
- MM Gross short covered in a big way which is fairly quick reversal of opinion.
- MM Gross long was driven out into the mass liquidation in the Fall, but started getting a bit longer until we reached the 194 top.
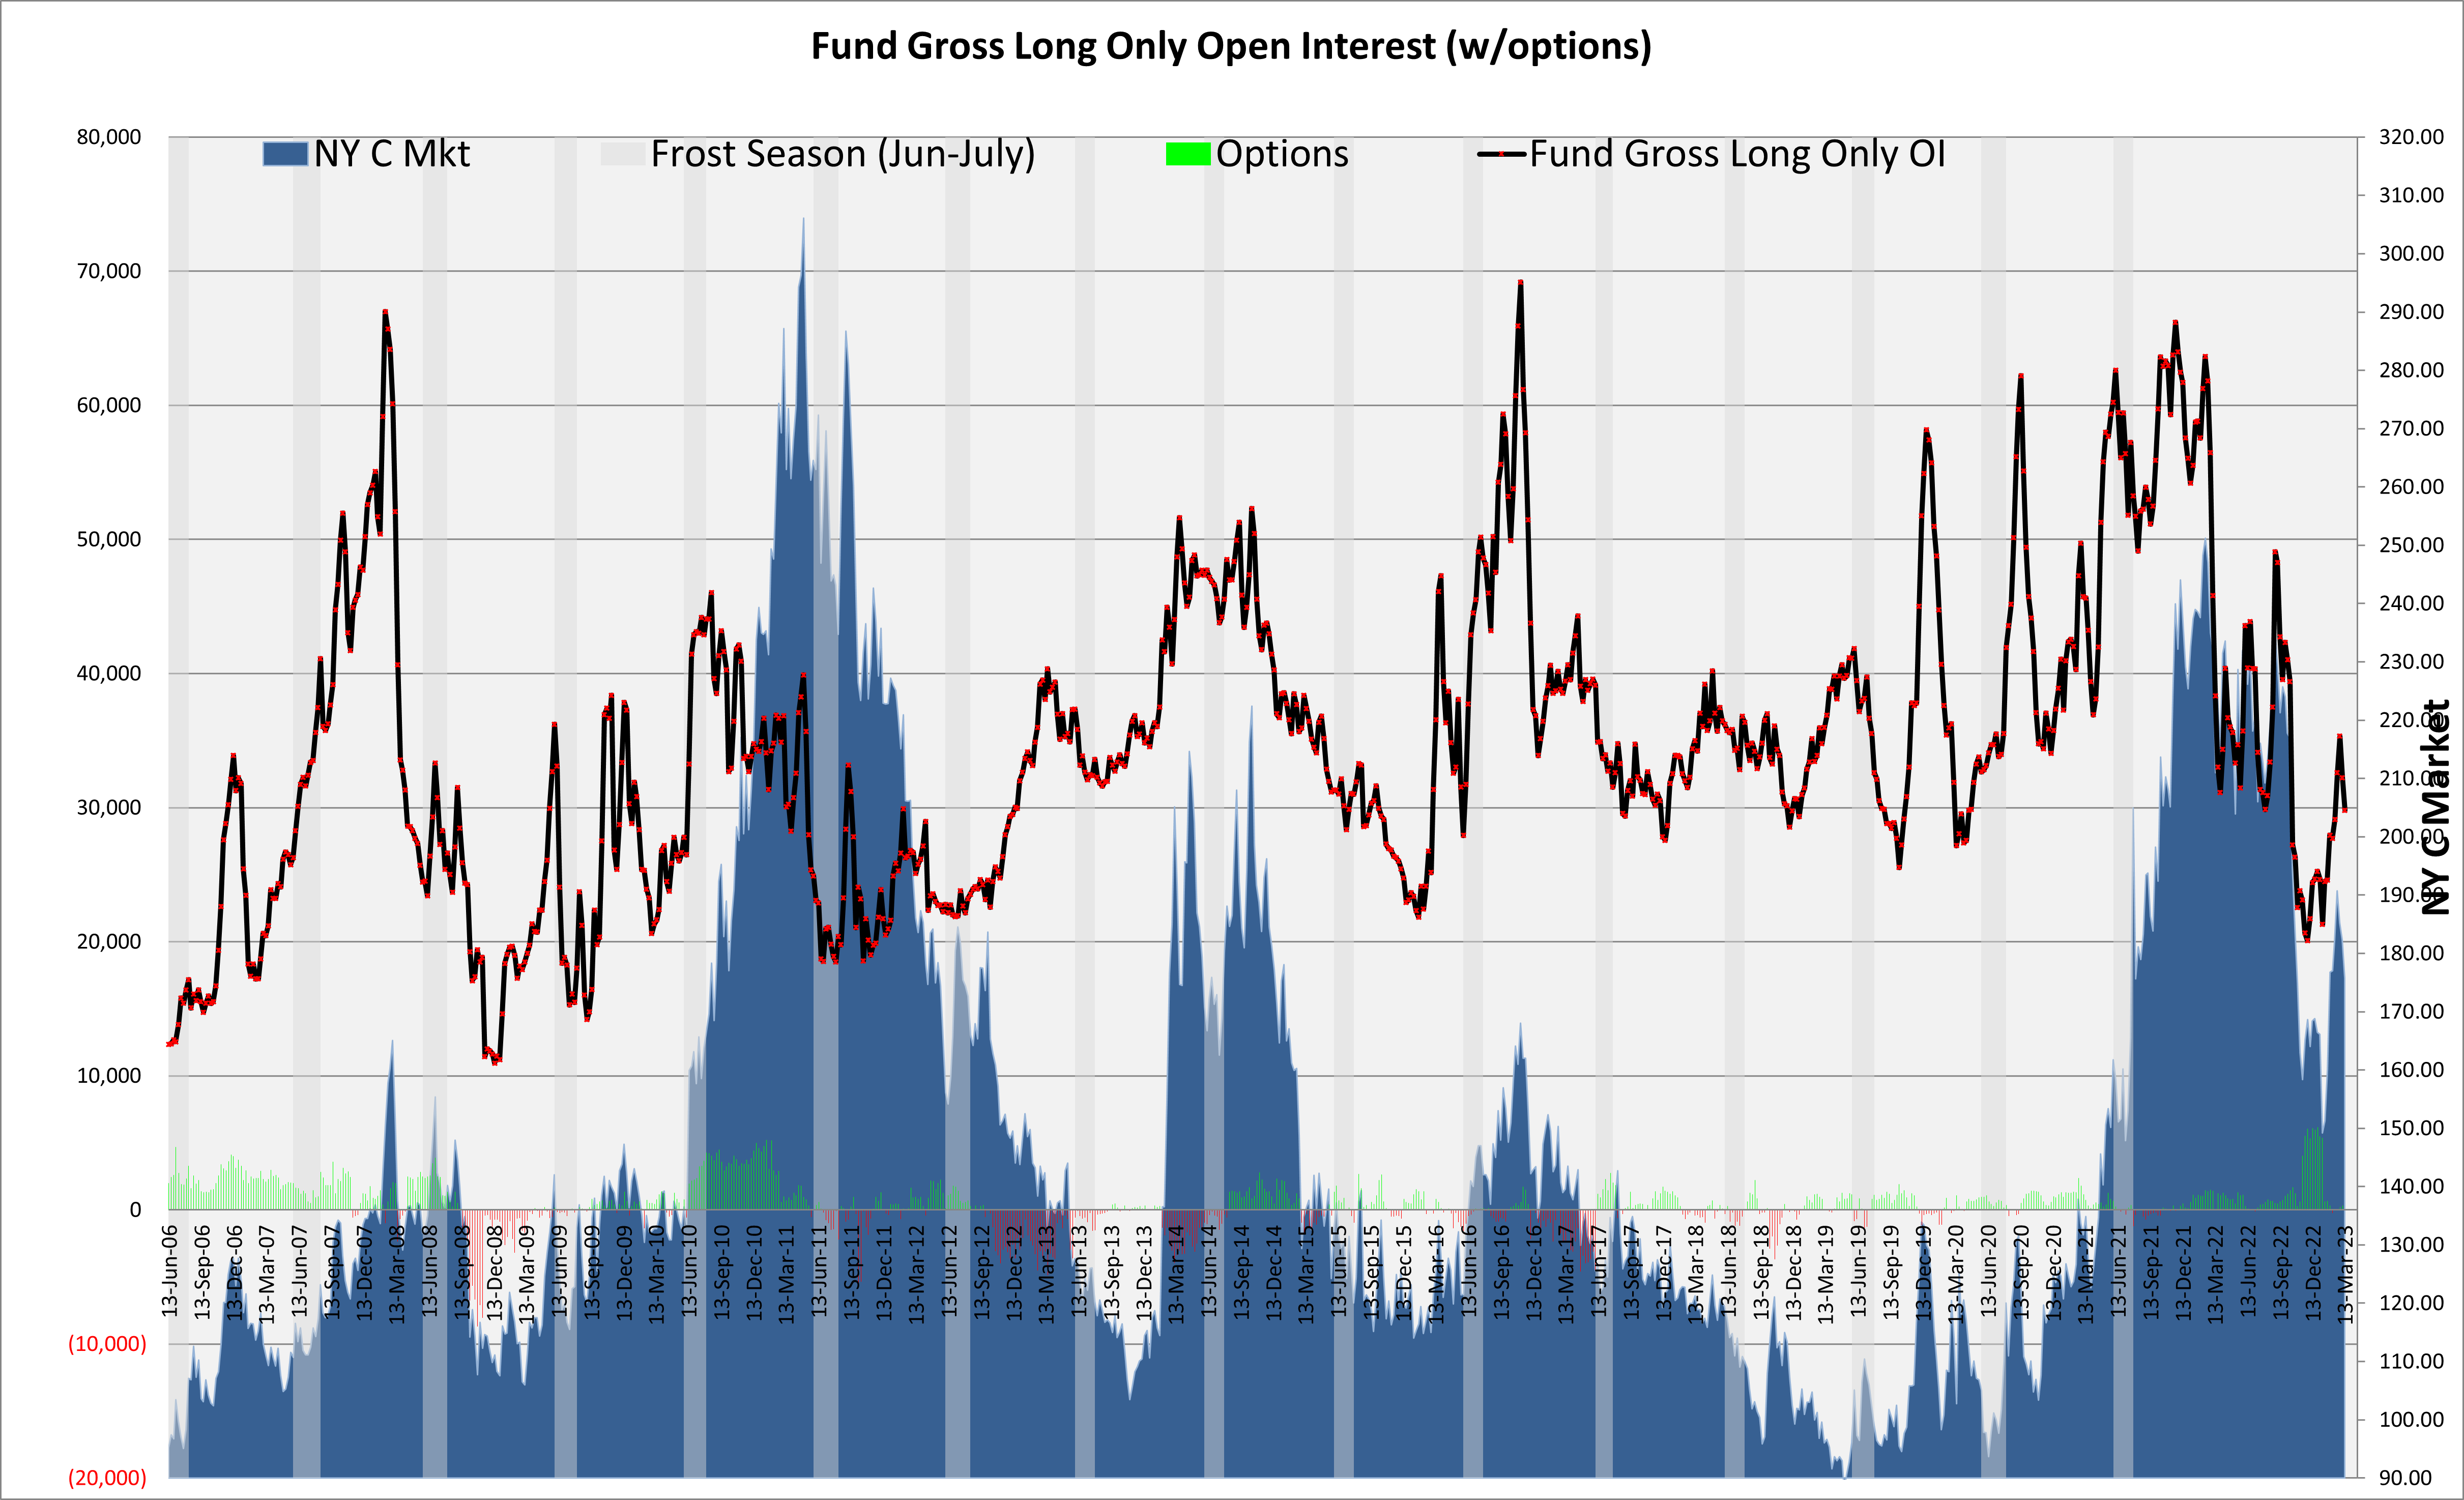

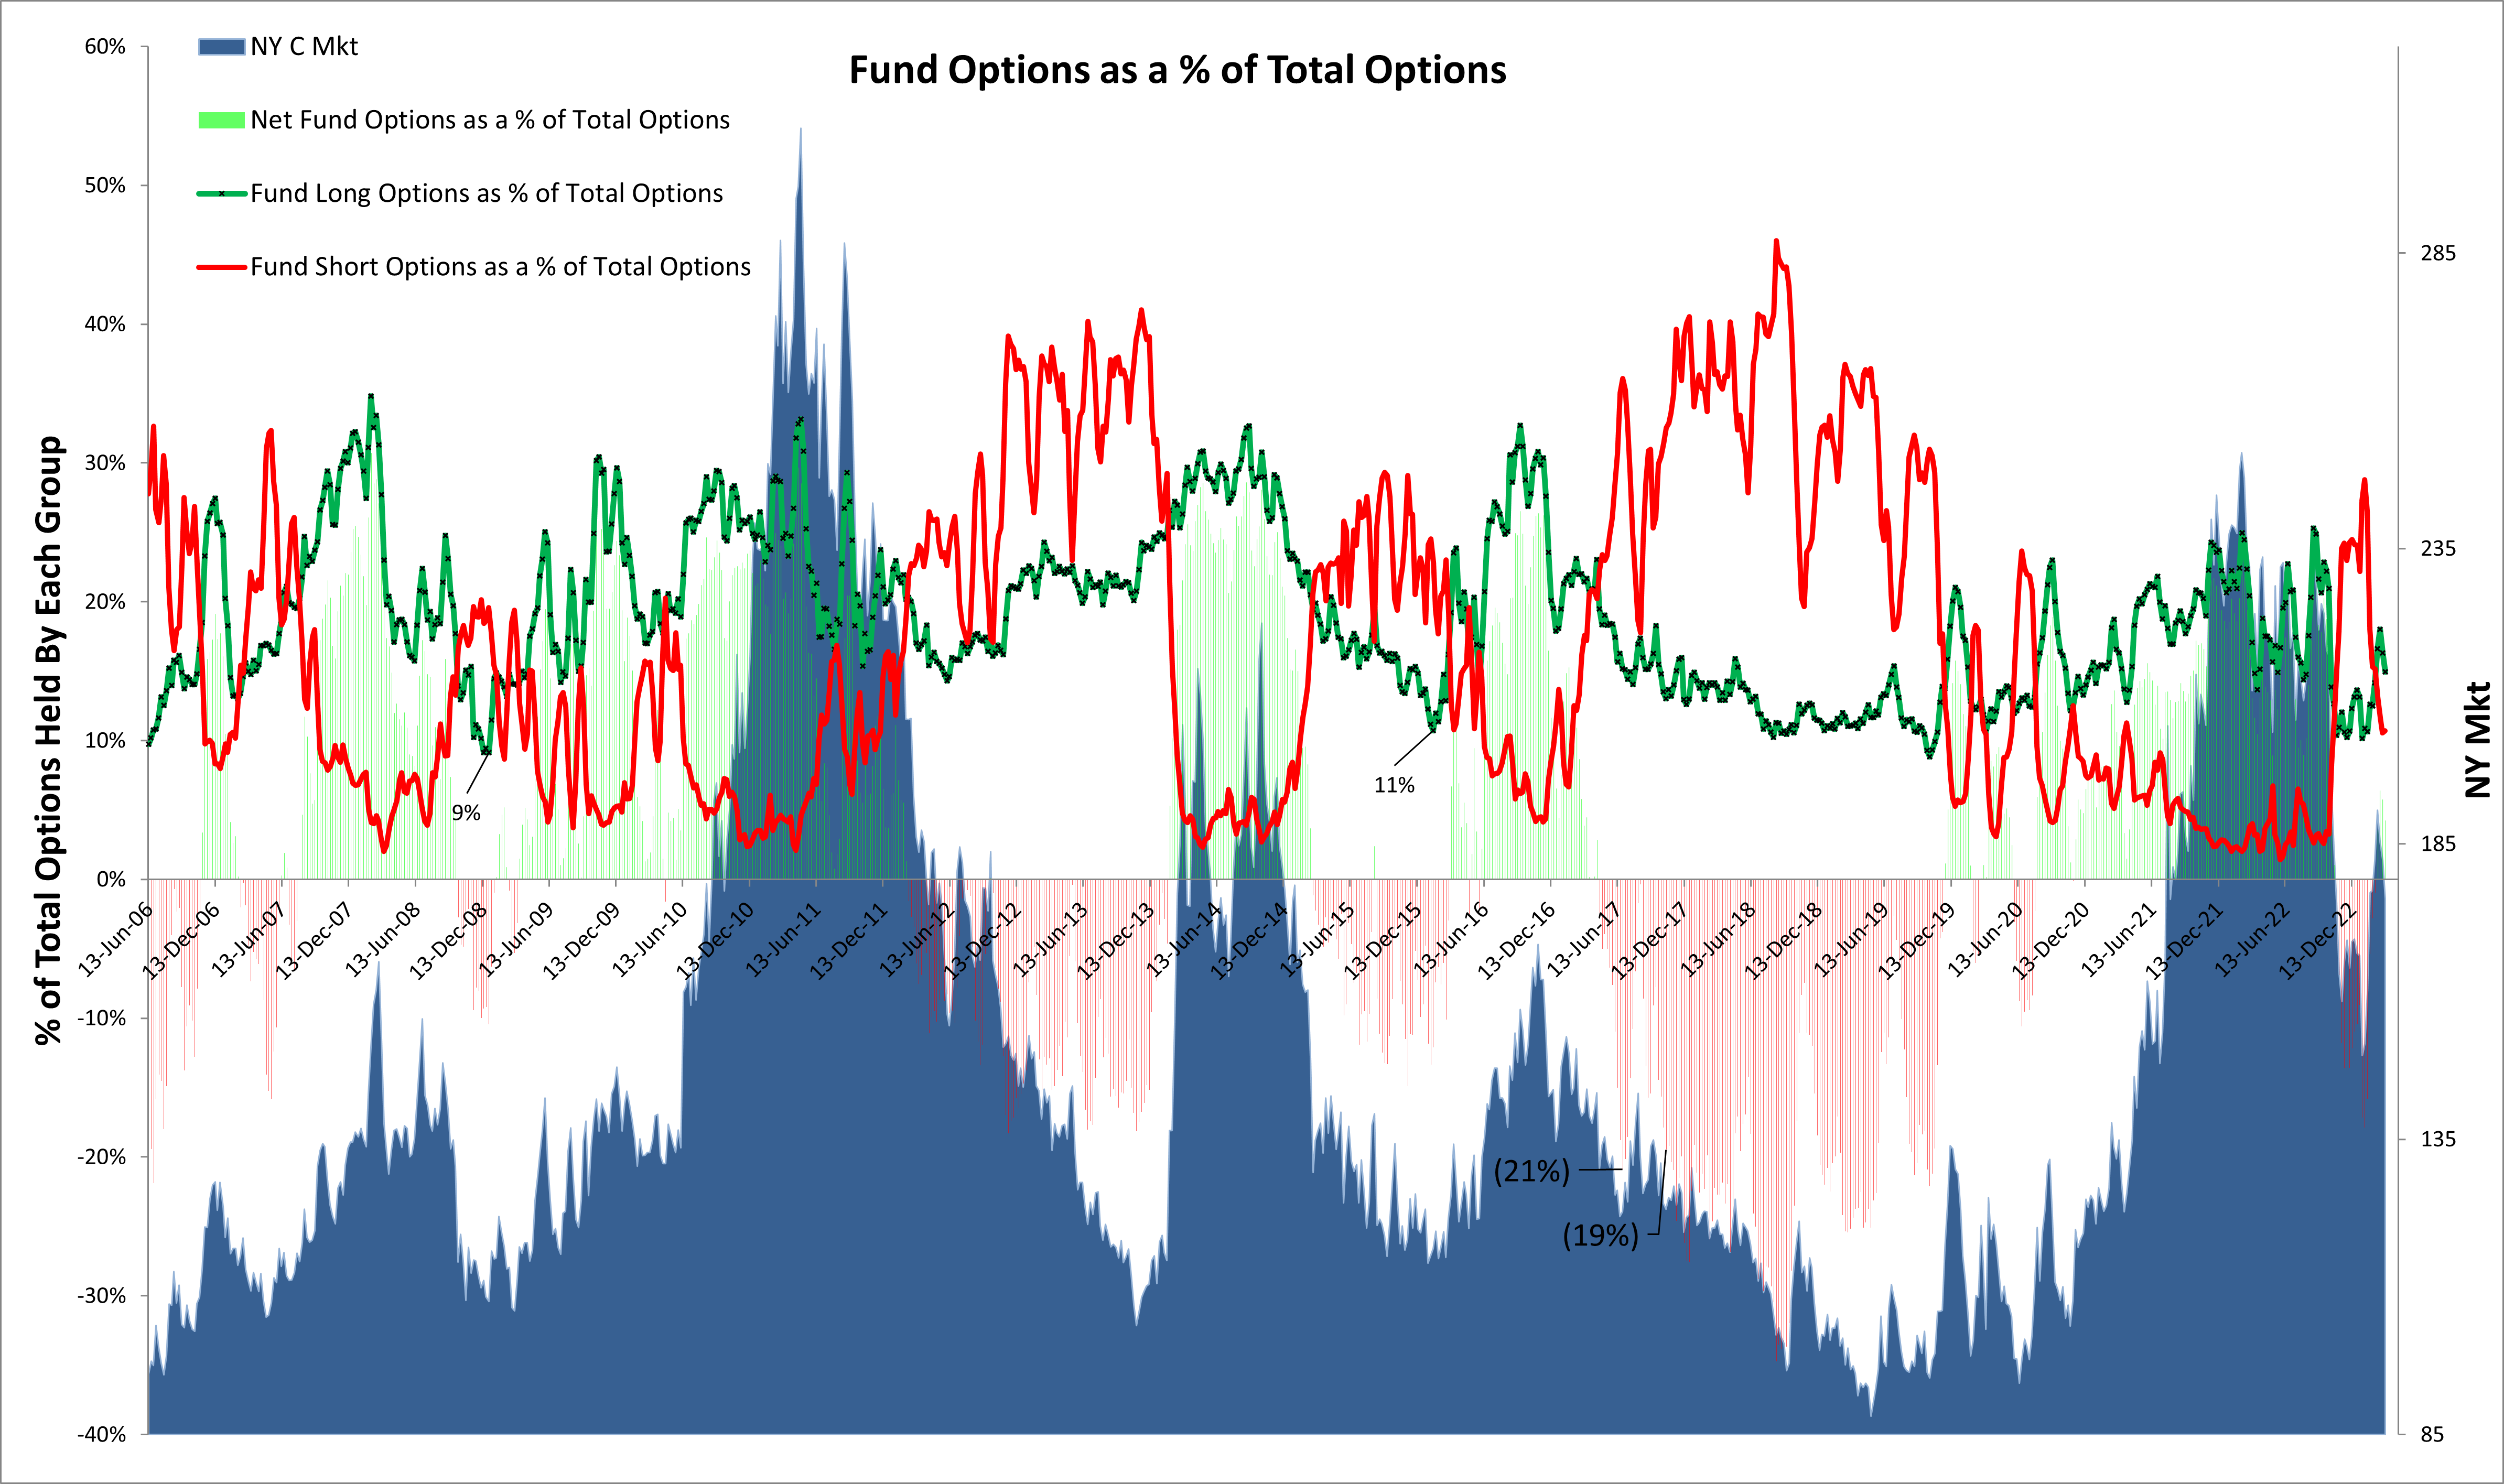
Managed Money – Options and # of Participants
- These graphs have generally been good in capturing longer term shifts. Not so much this time.
- Not much to glean form this right now other than Gross Short sentiment seems to have changed (ie, less bearish).
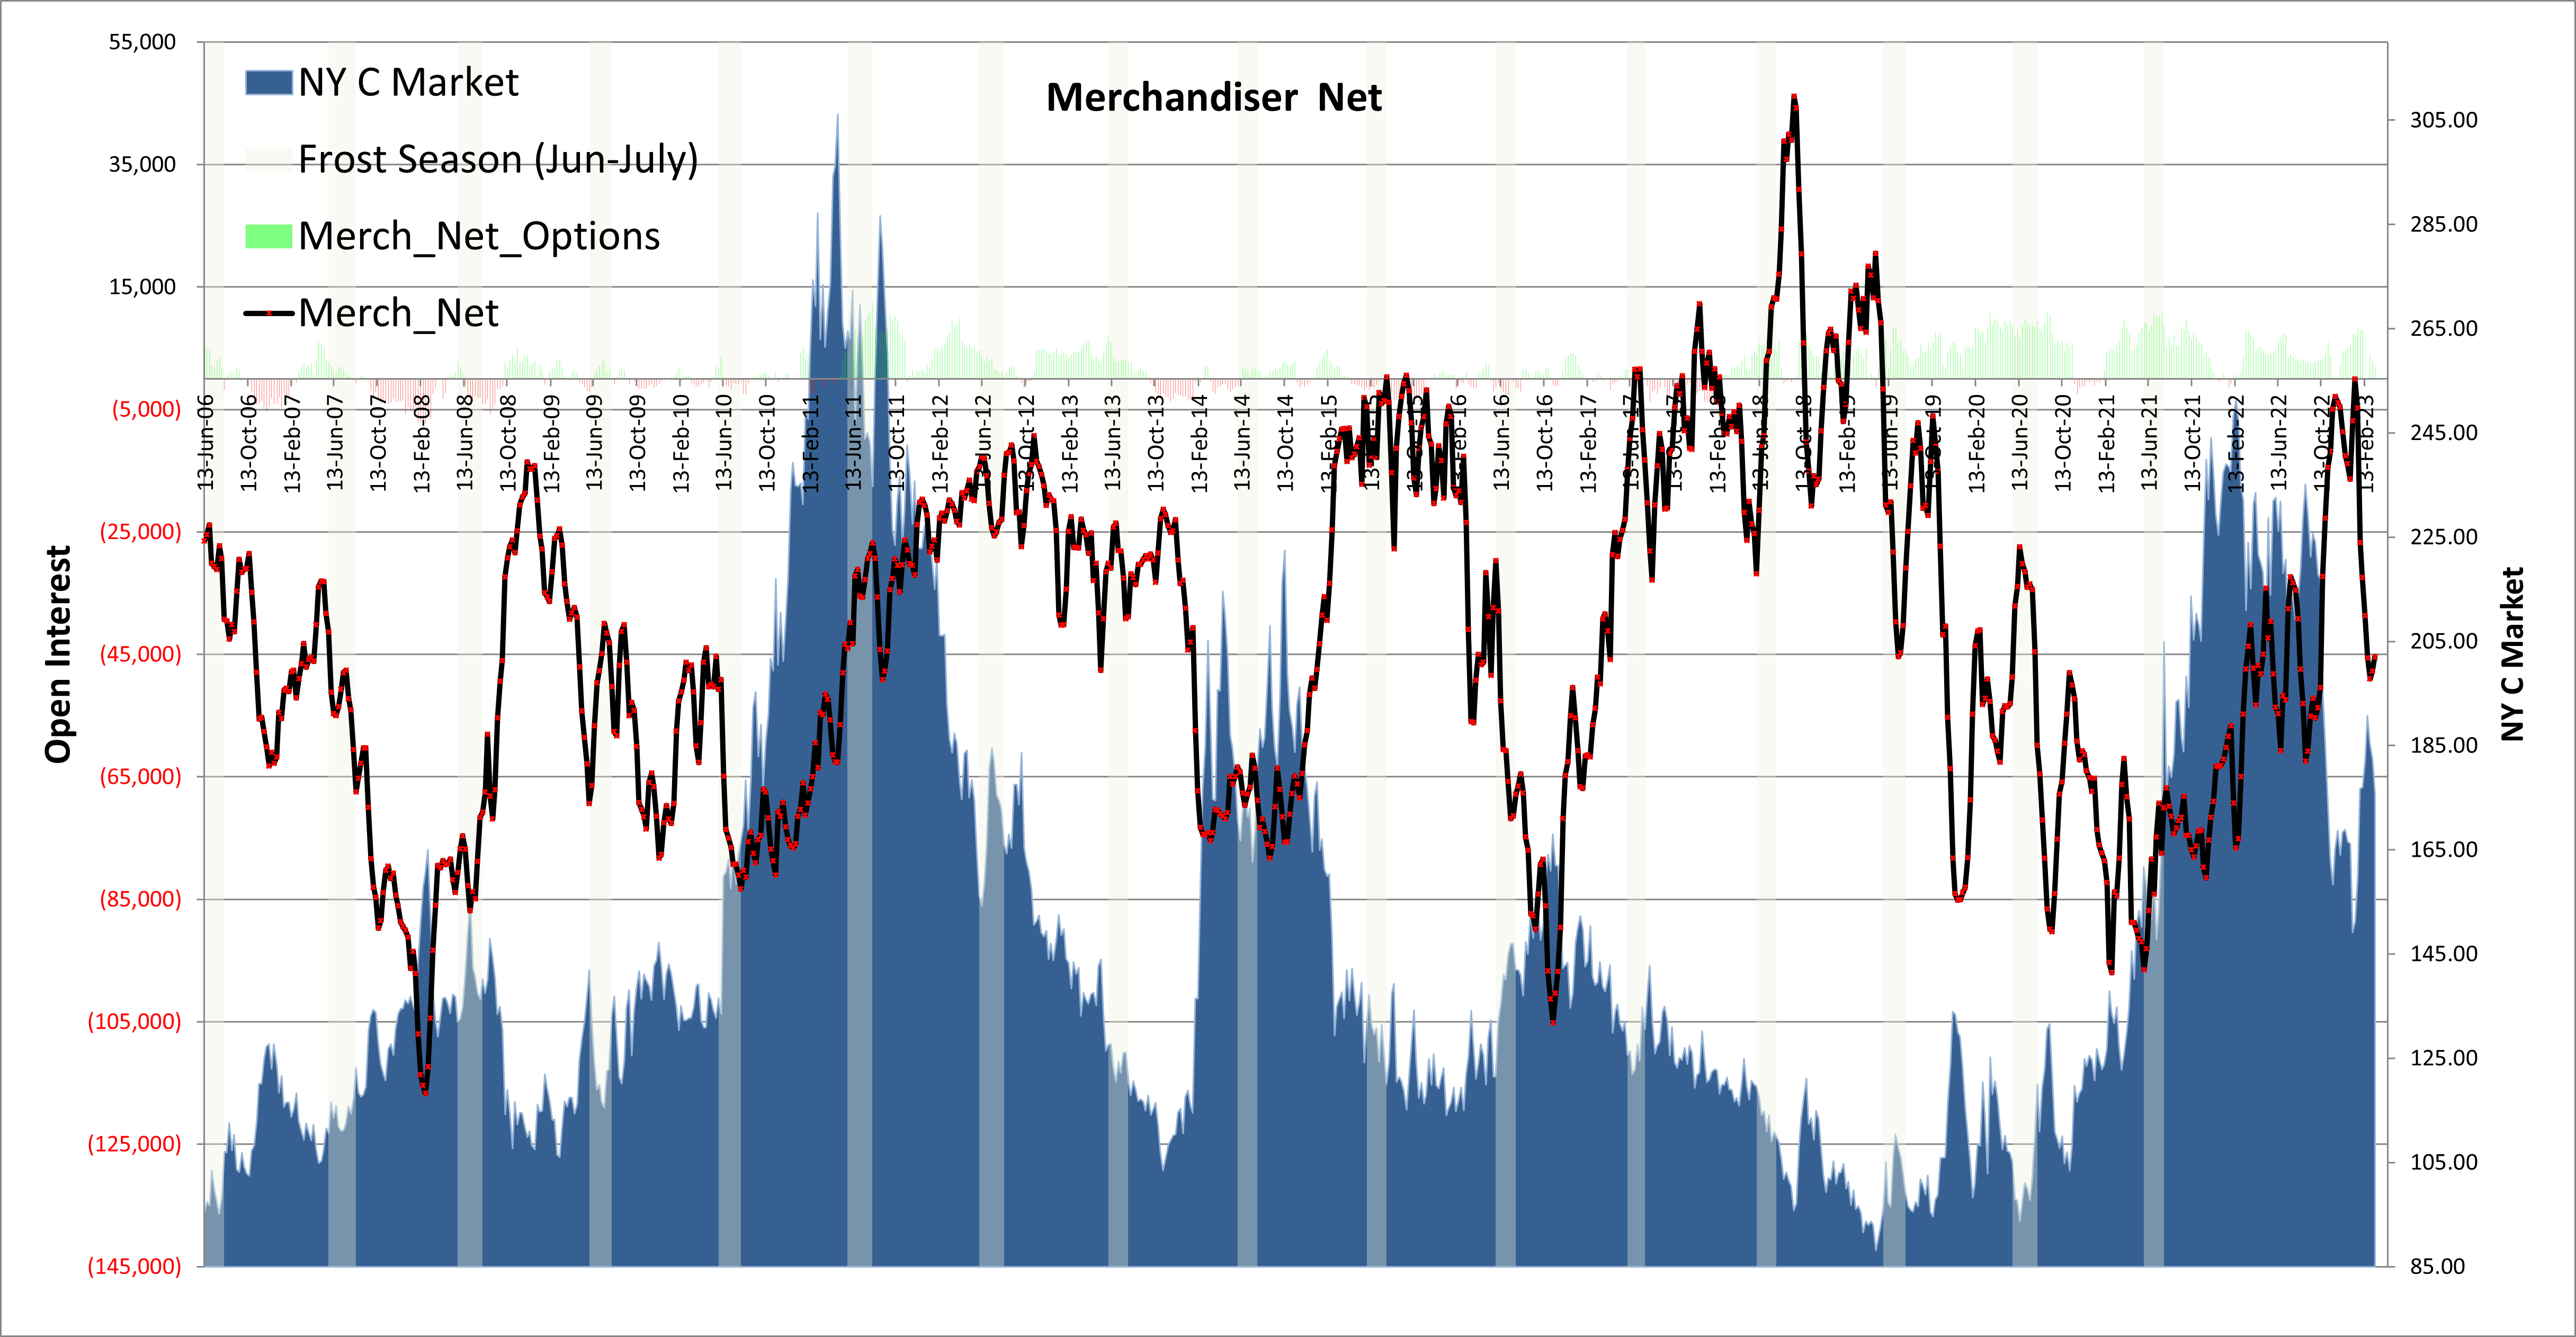
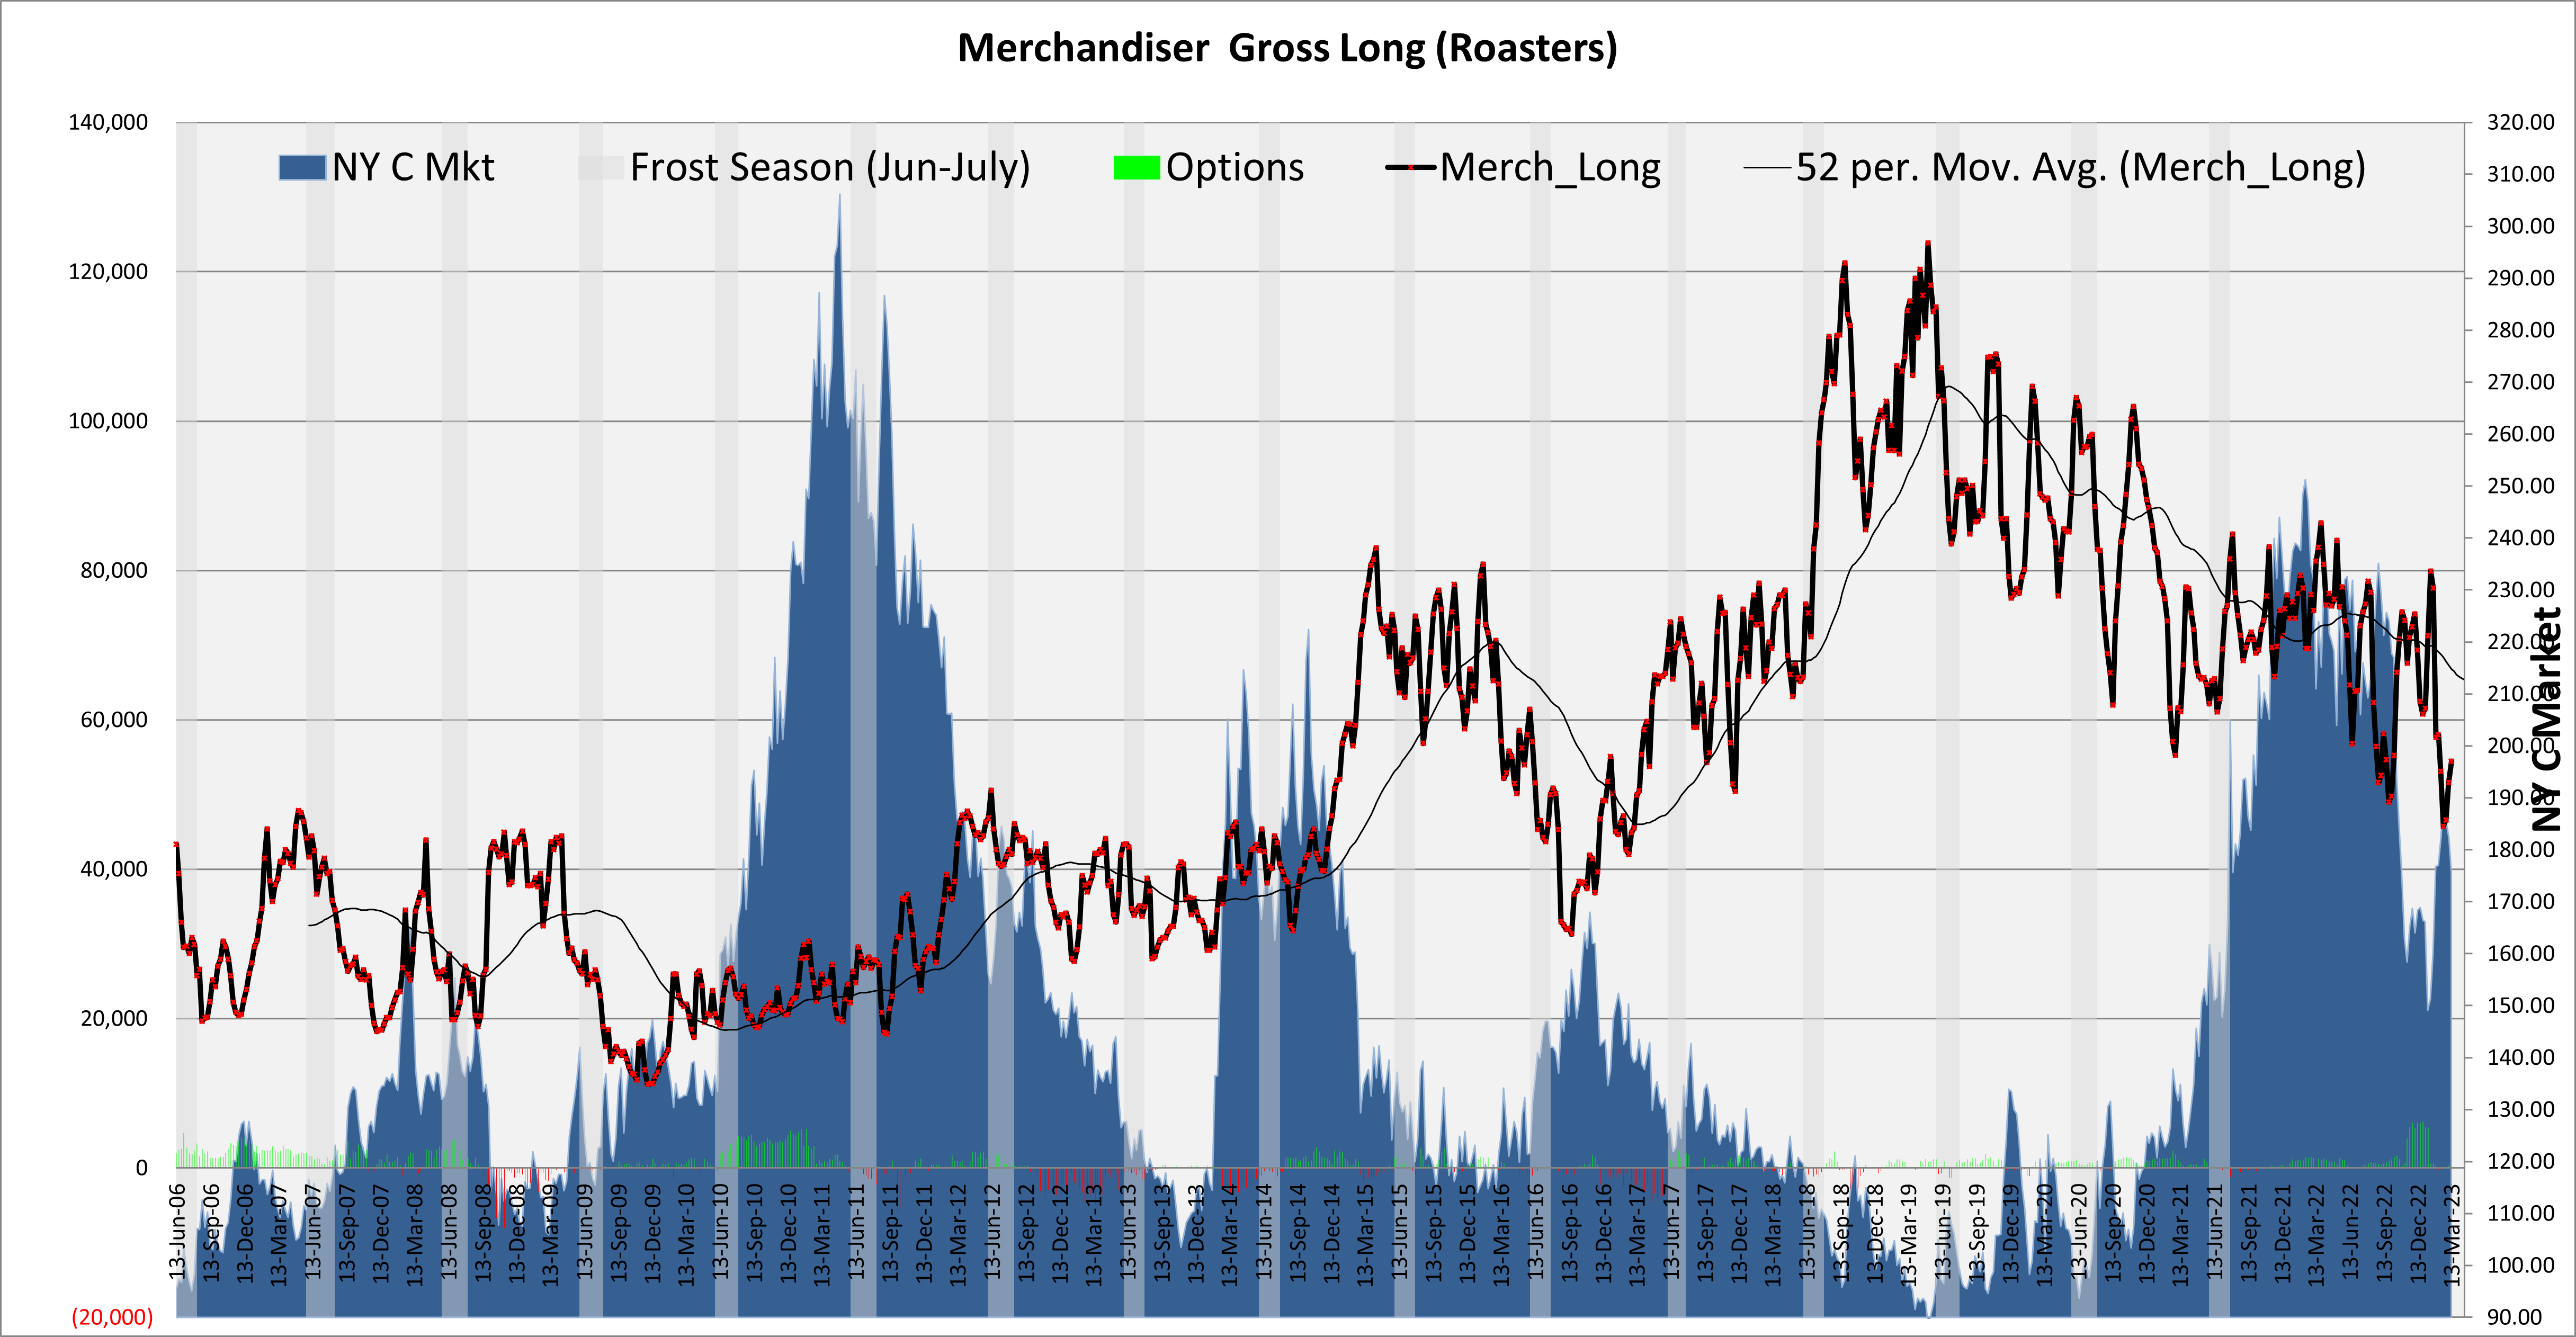
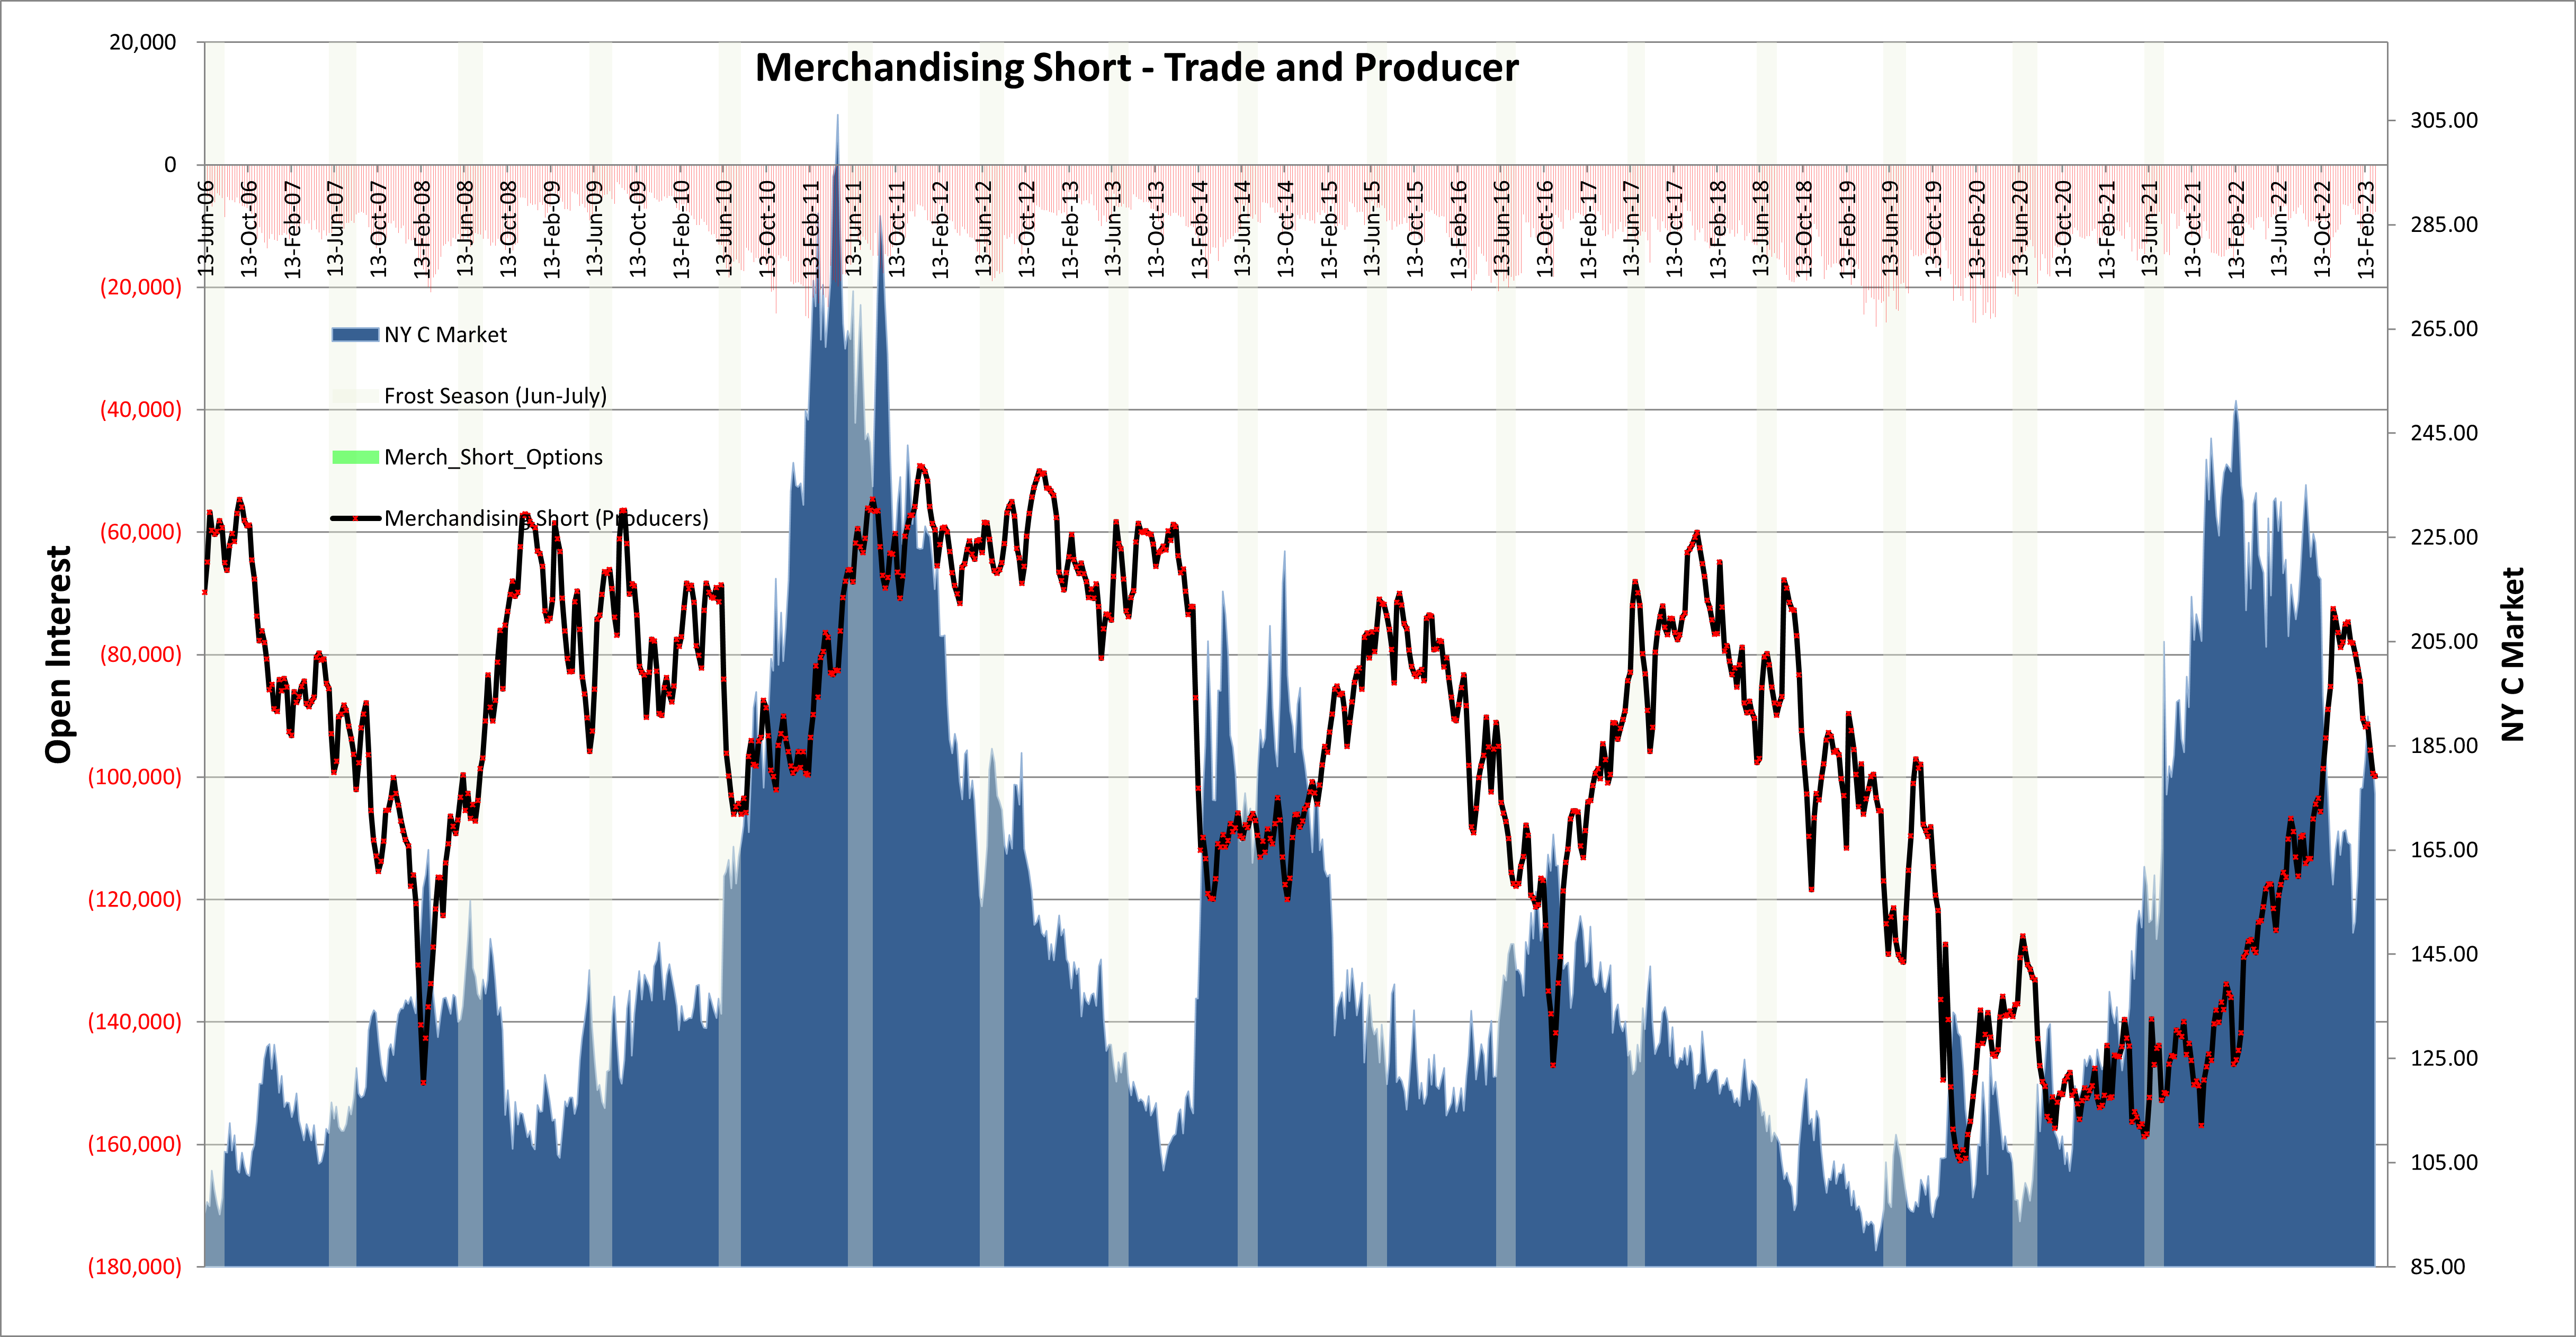
Merchandising
- Net position went briefly net long on the lows, but then sold consistently on the way up.
- Producer/Trade – Gross short decreased substantially as the market approached 142, but it also sold heavily into the 194 highs suggesting points of support and resistance in the near term.
- Roaster position did similarly, but is also showing some willingness to get some coverage since they are poorly covered now. This ought to provide near term support.
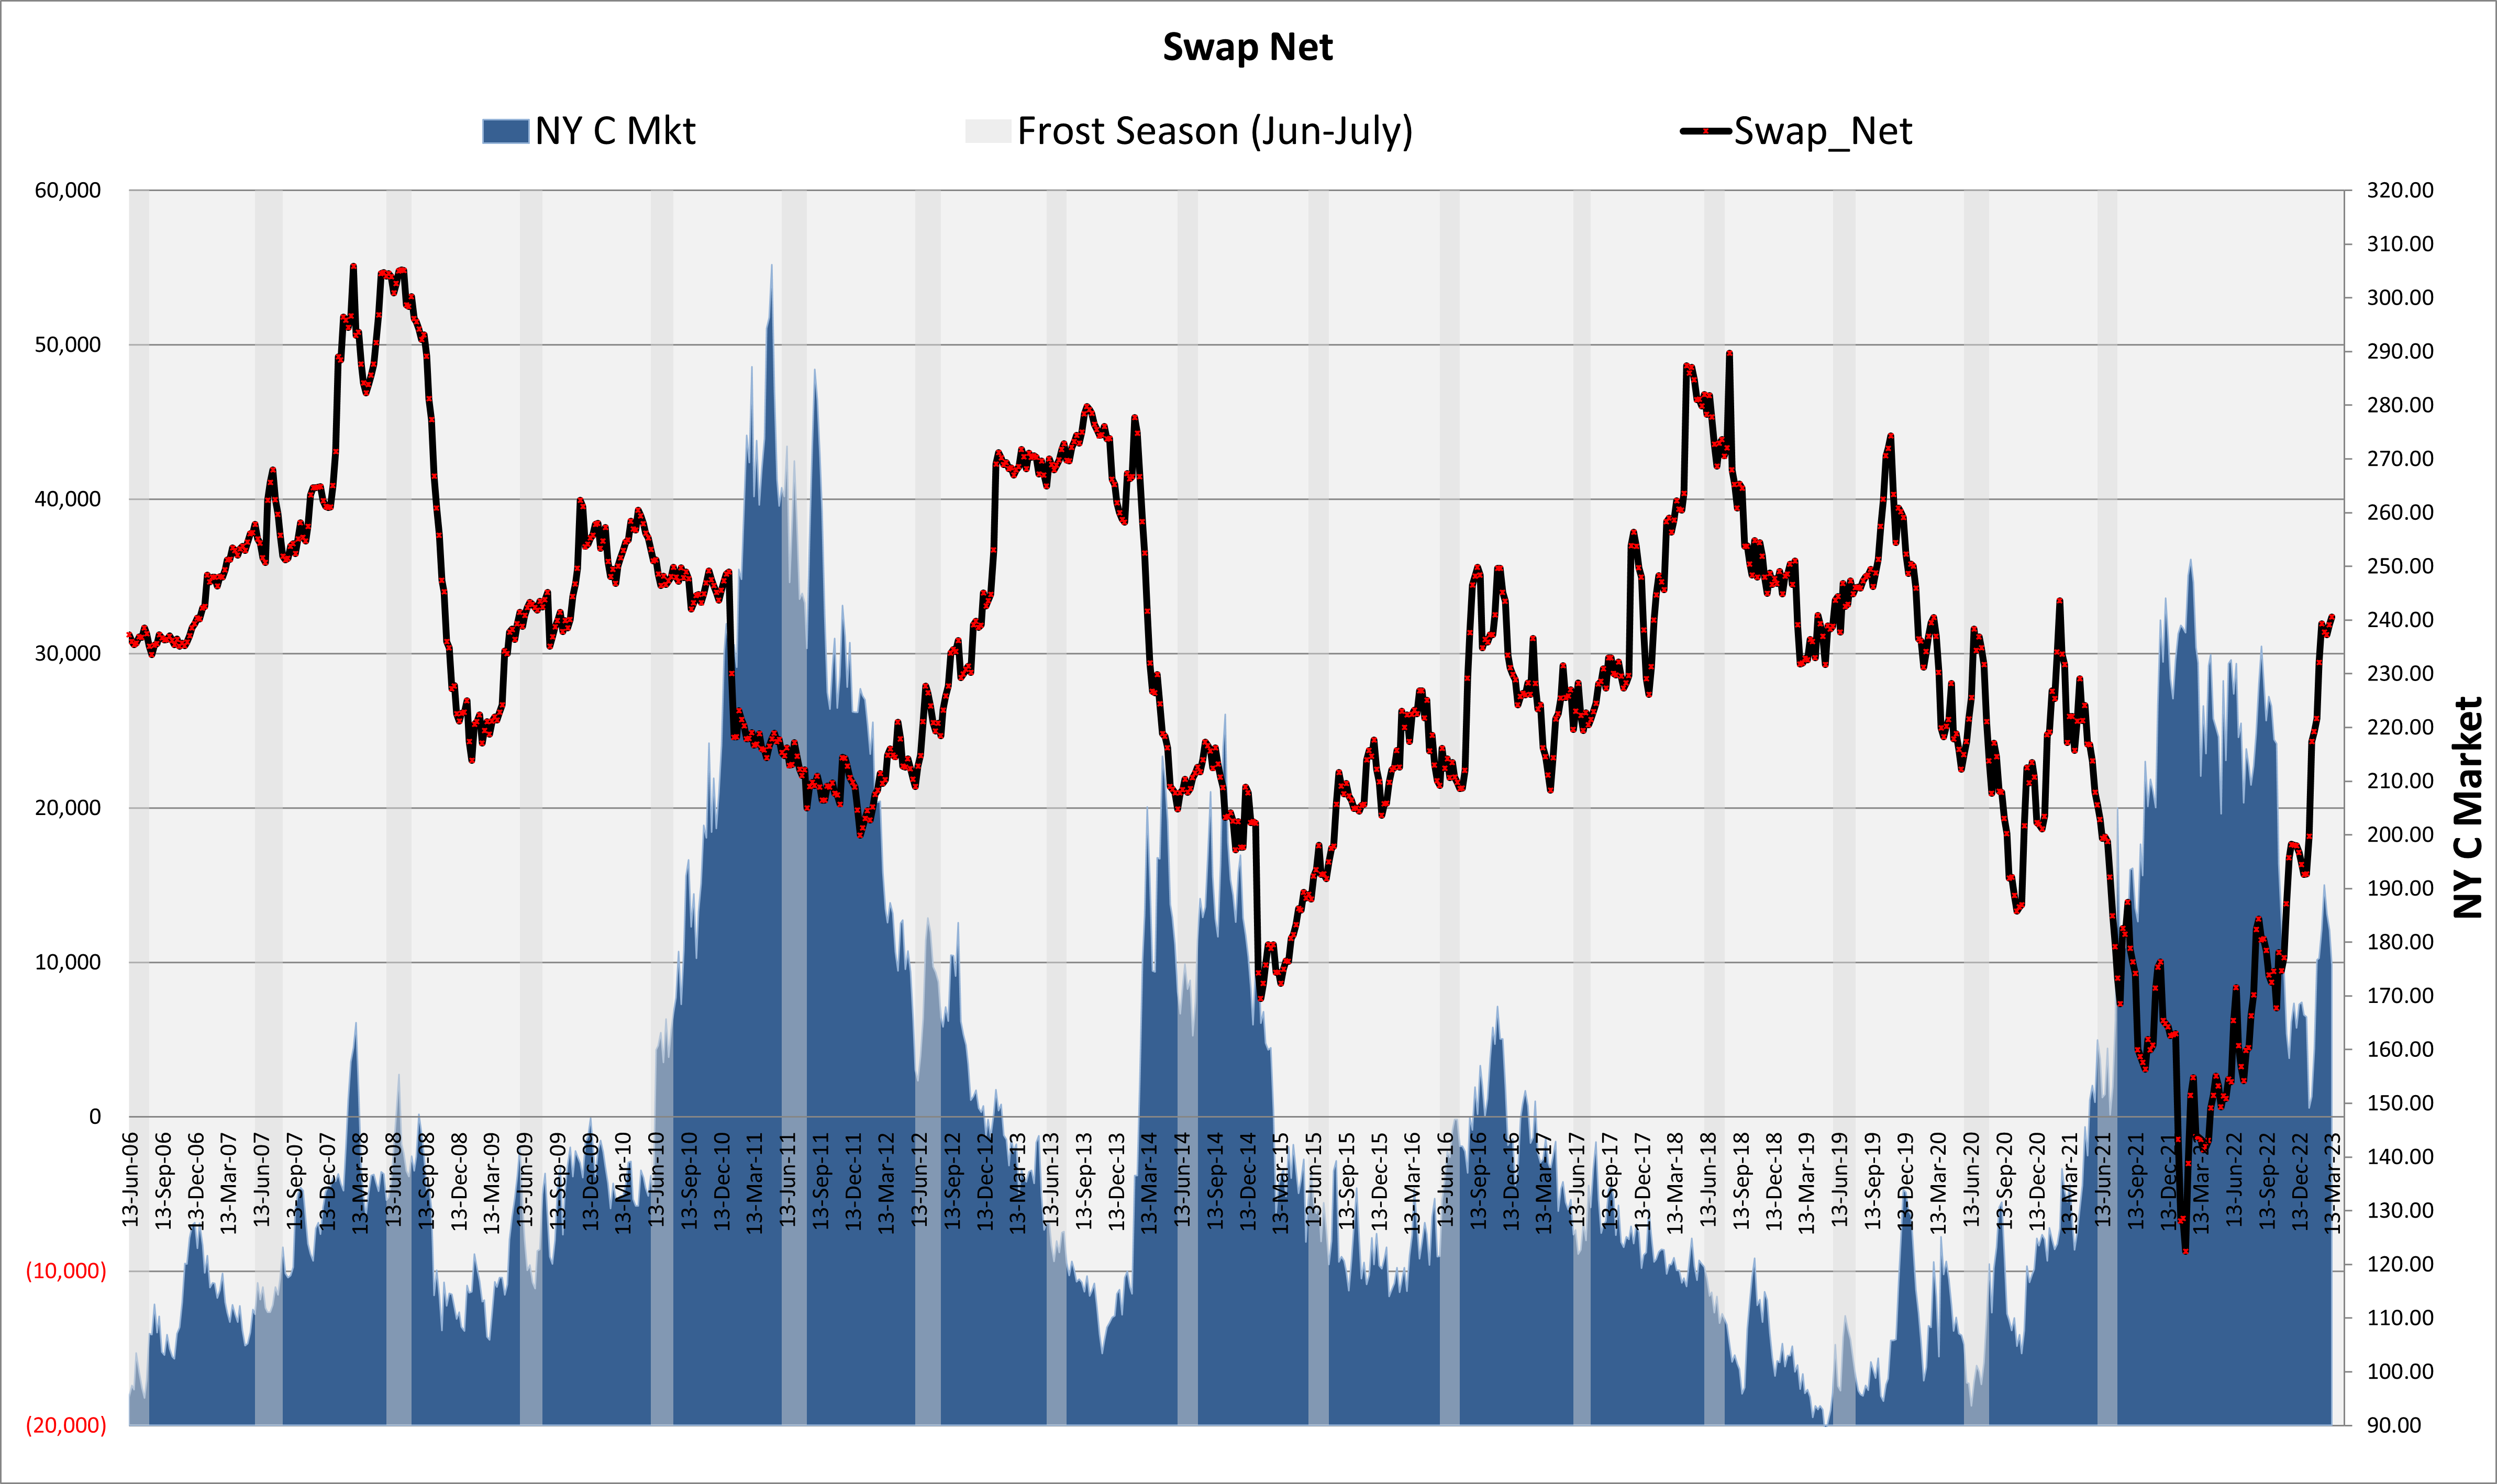
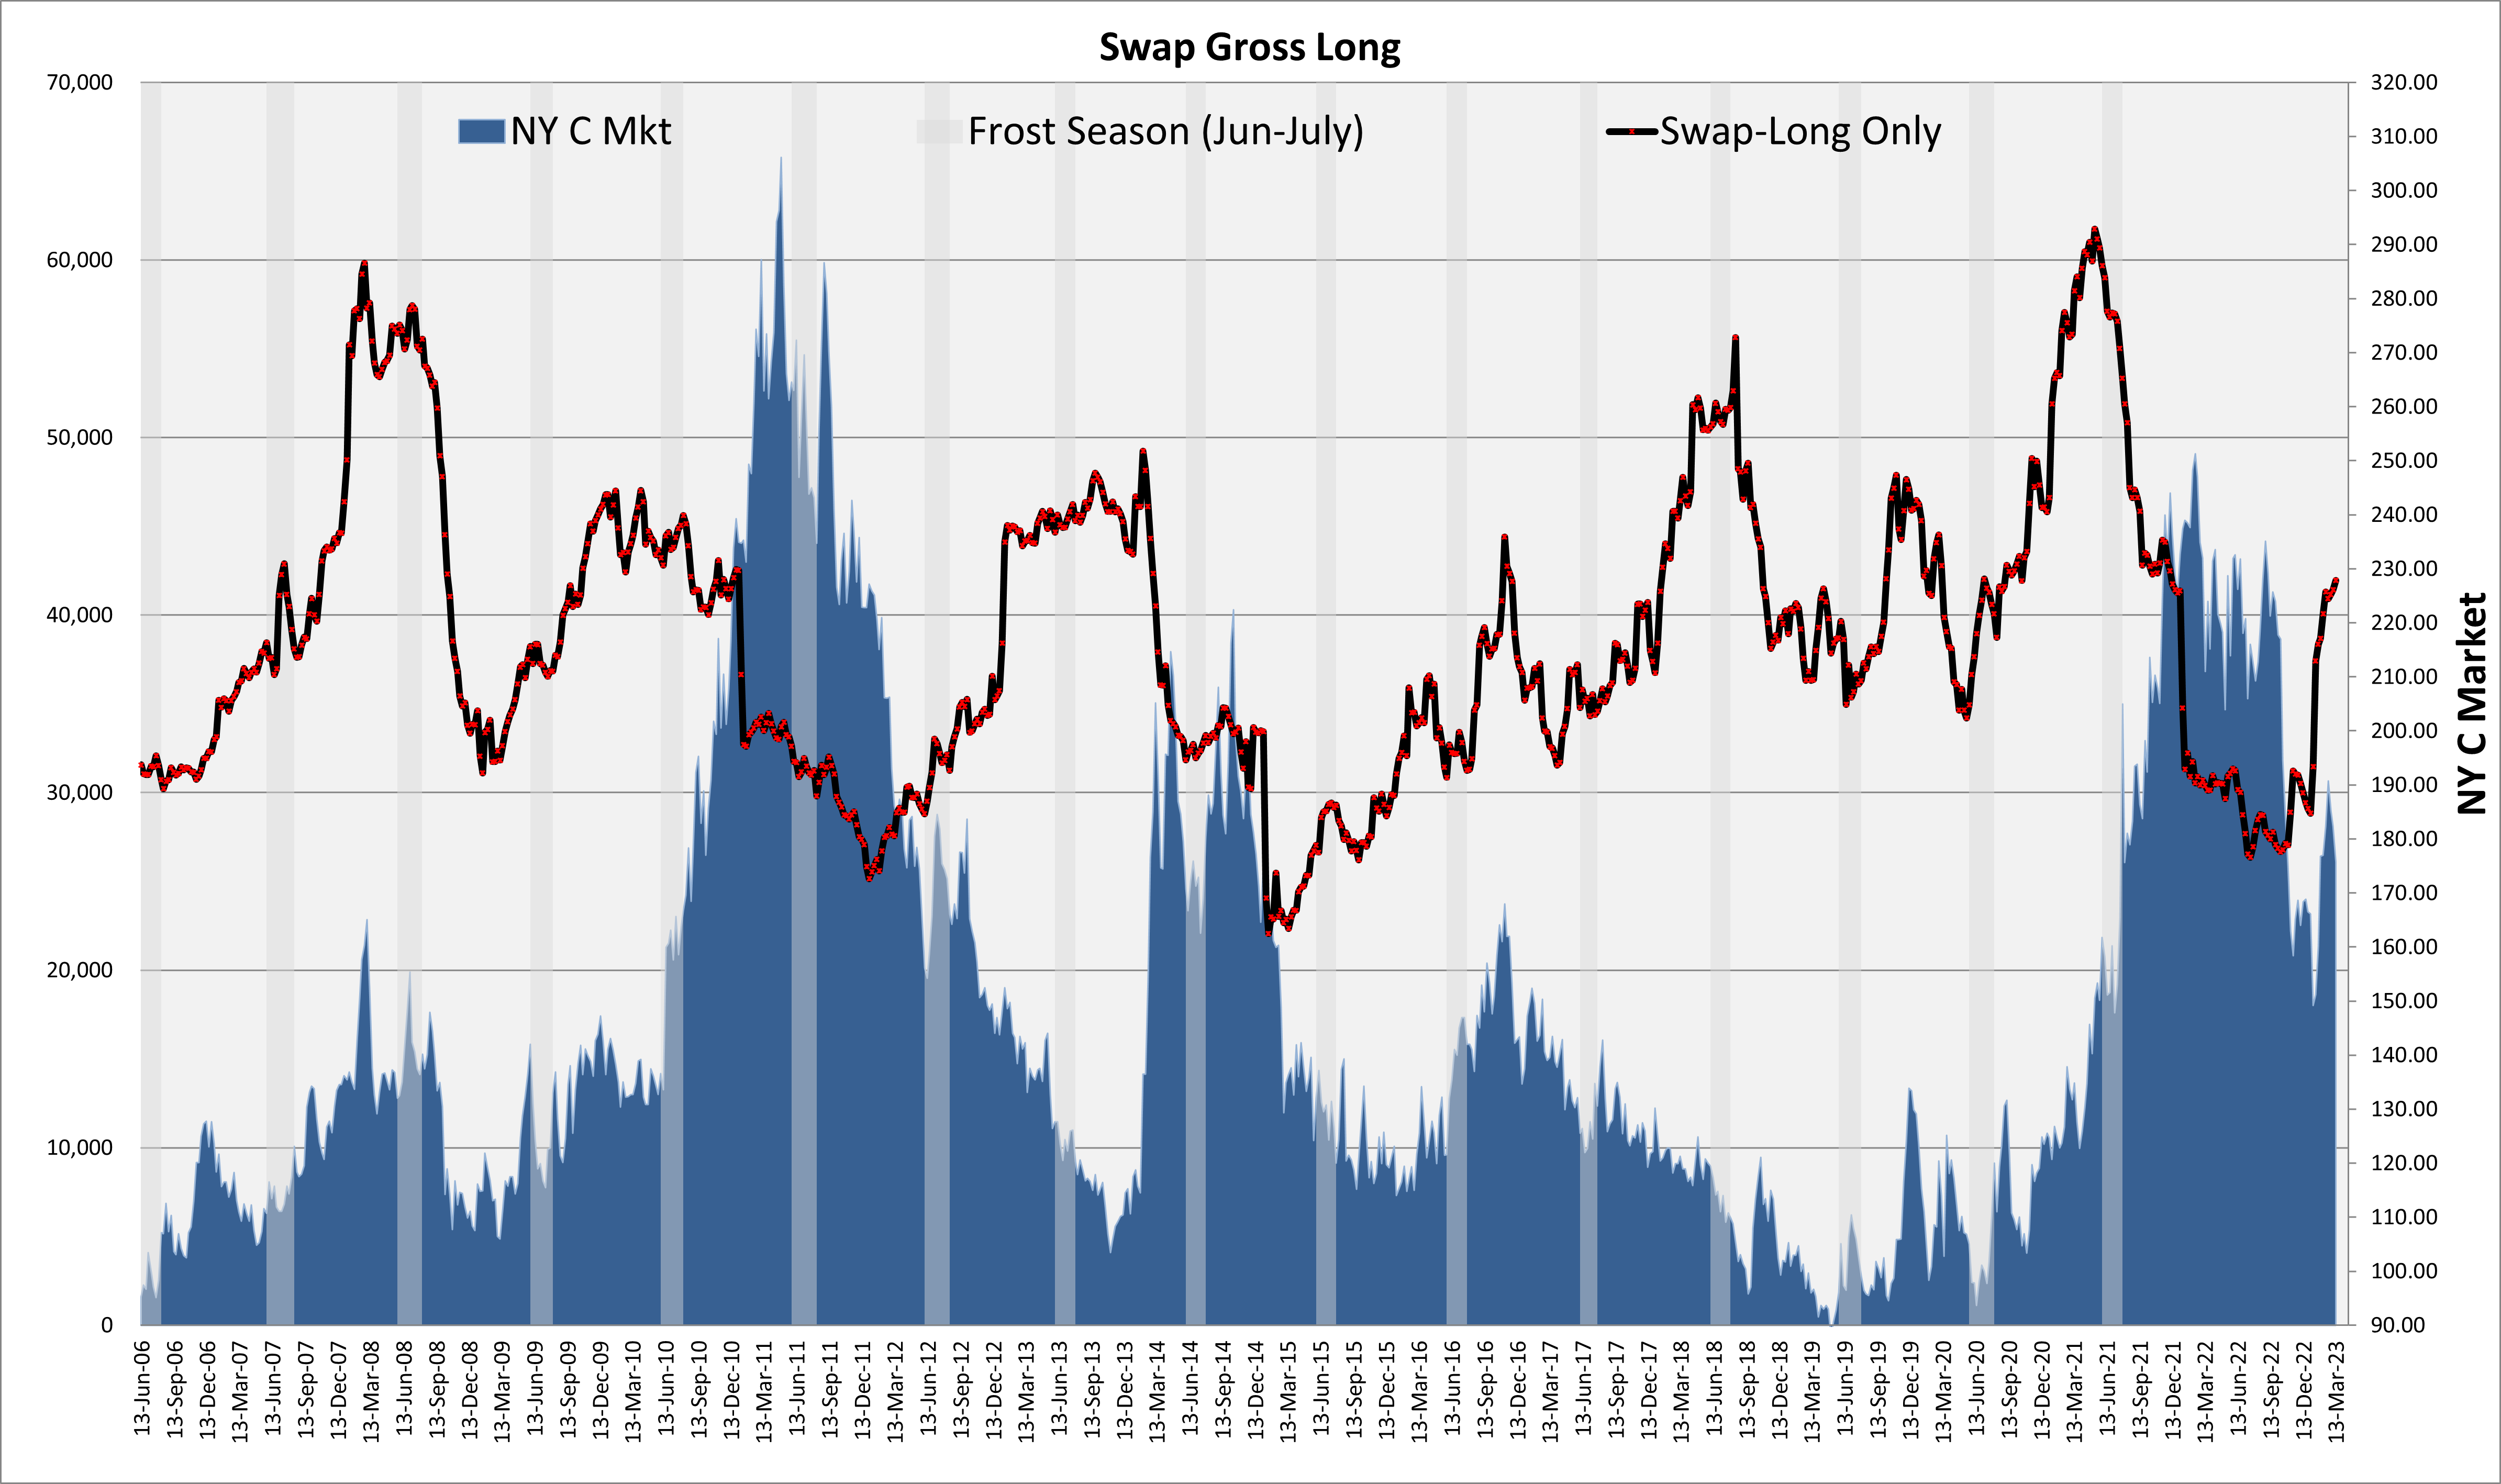
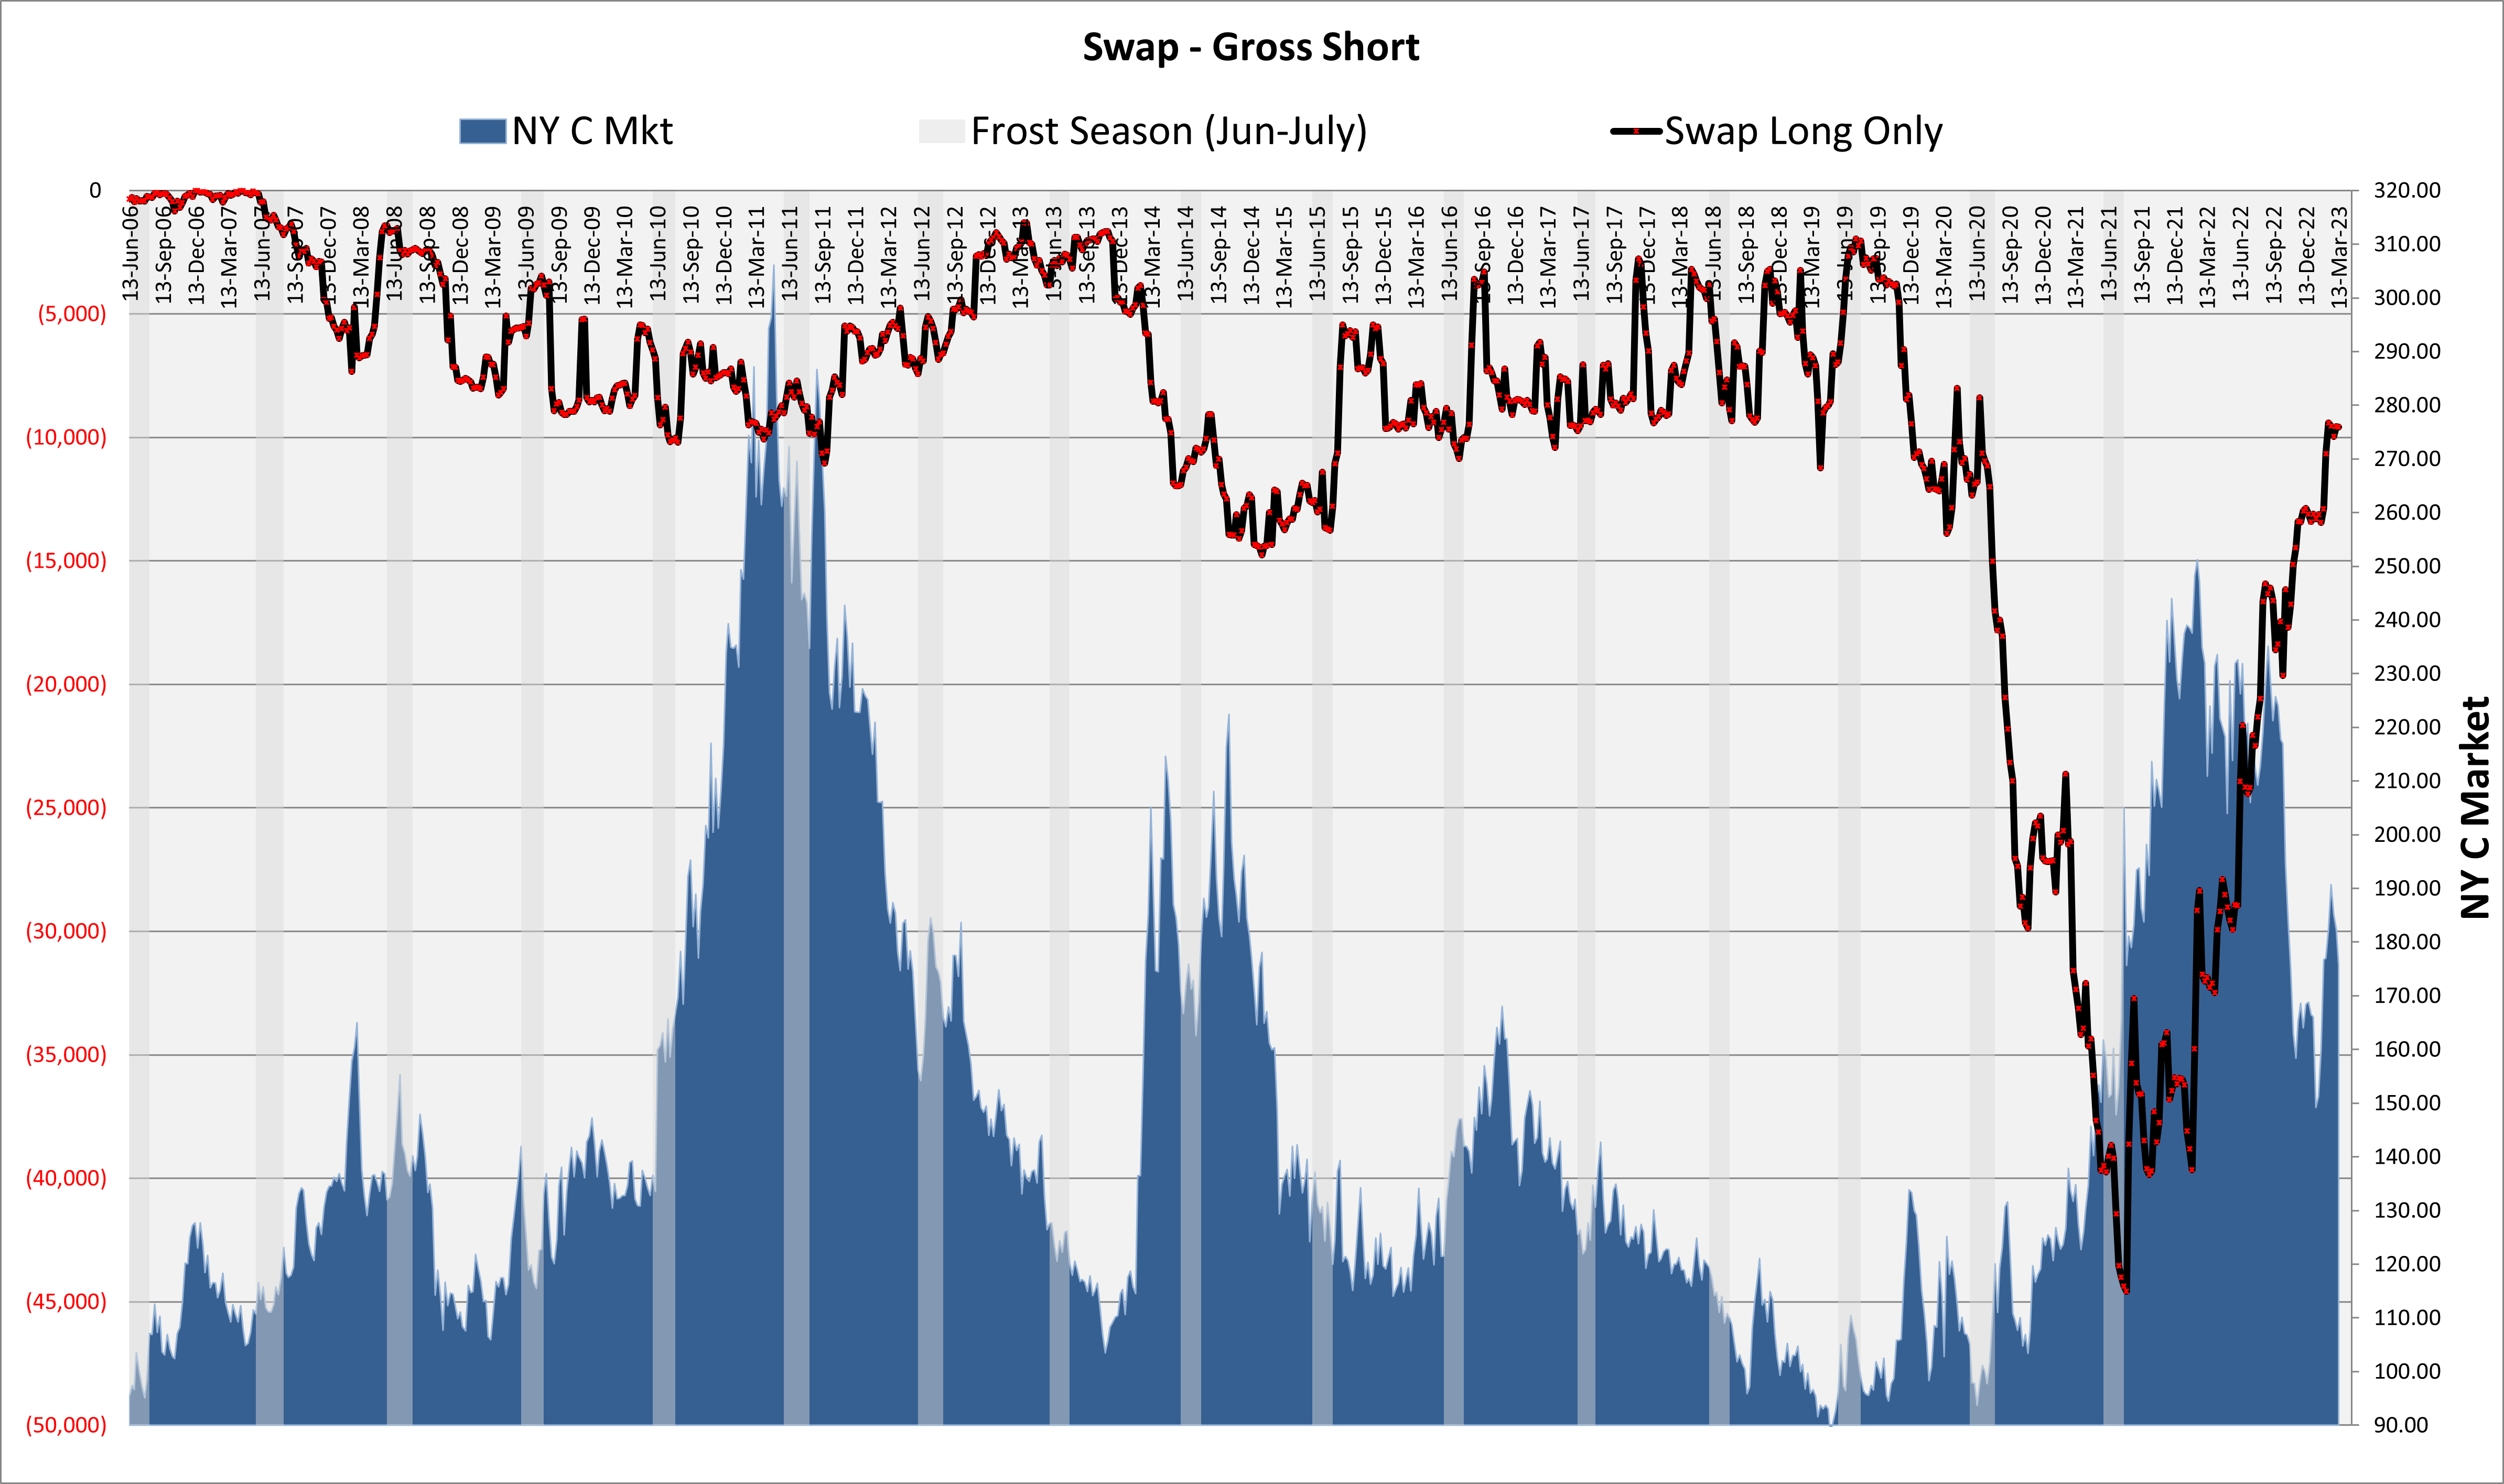
Swap
- Swap Gross Short never made sense to me as it was historically 3 to 4x times it’s normal gross short. Their covering added to the rally last year.
- Swap Gross Long also bought off the 142 lows but has slowed here near the top.
- There arent many instances where this group moves aggressively in one direction and then quickly turns in the opposite. So I would n0t expect selling pressure.
Dumb Money
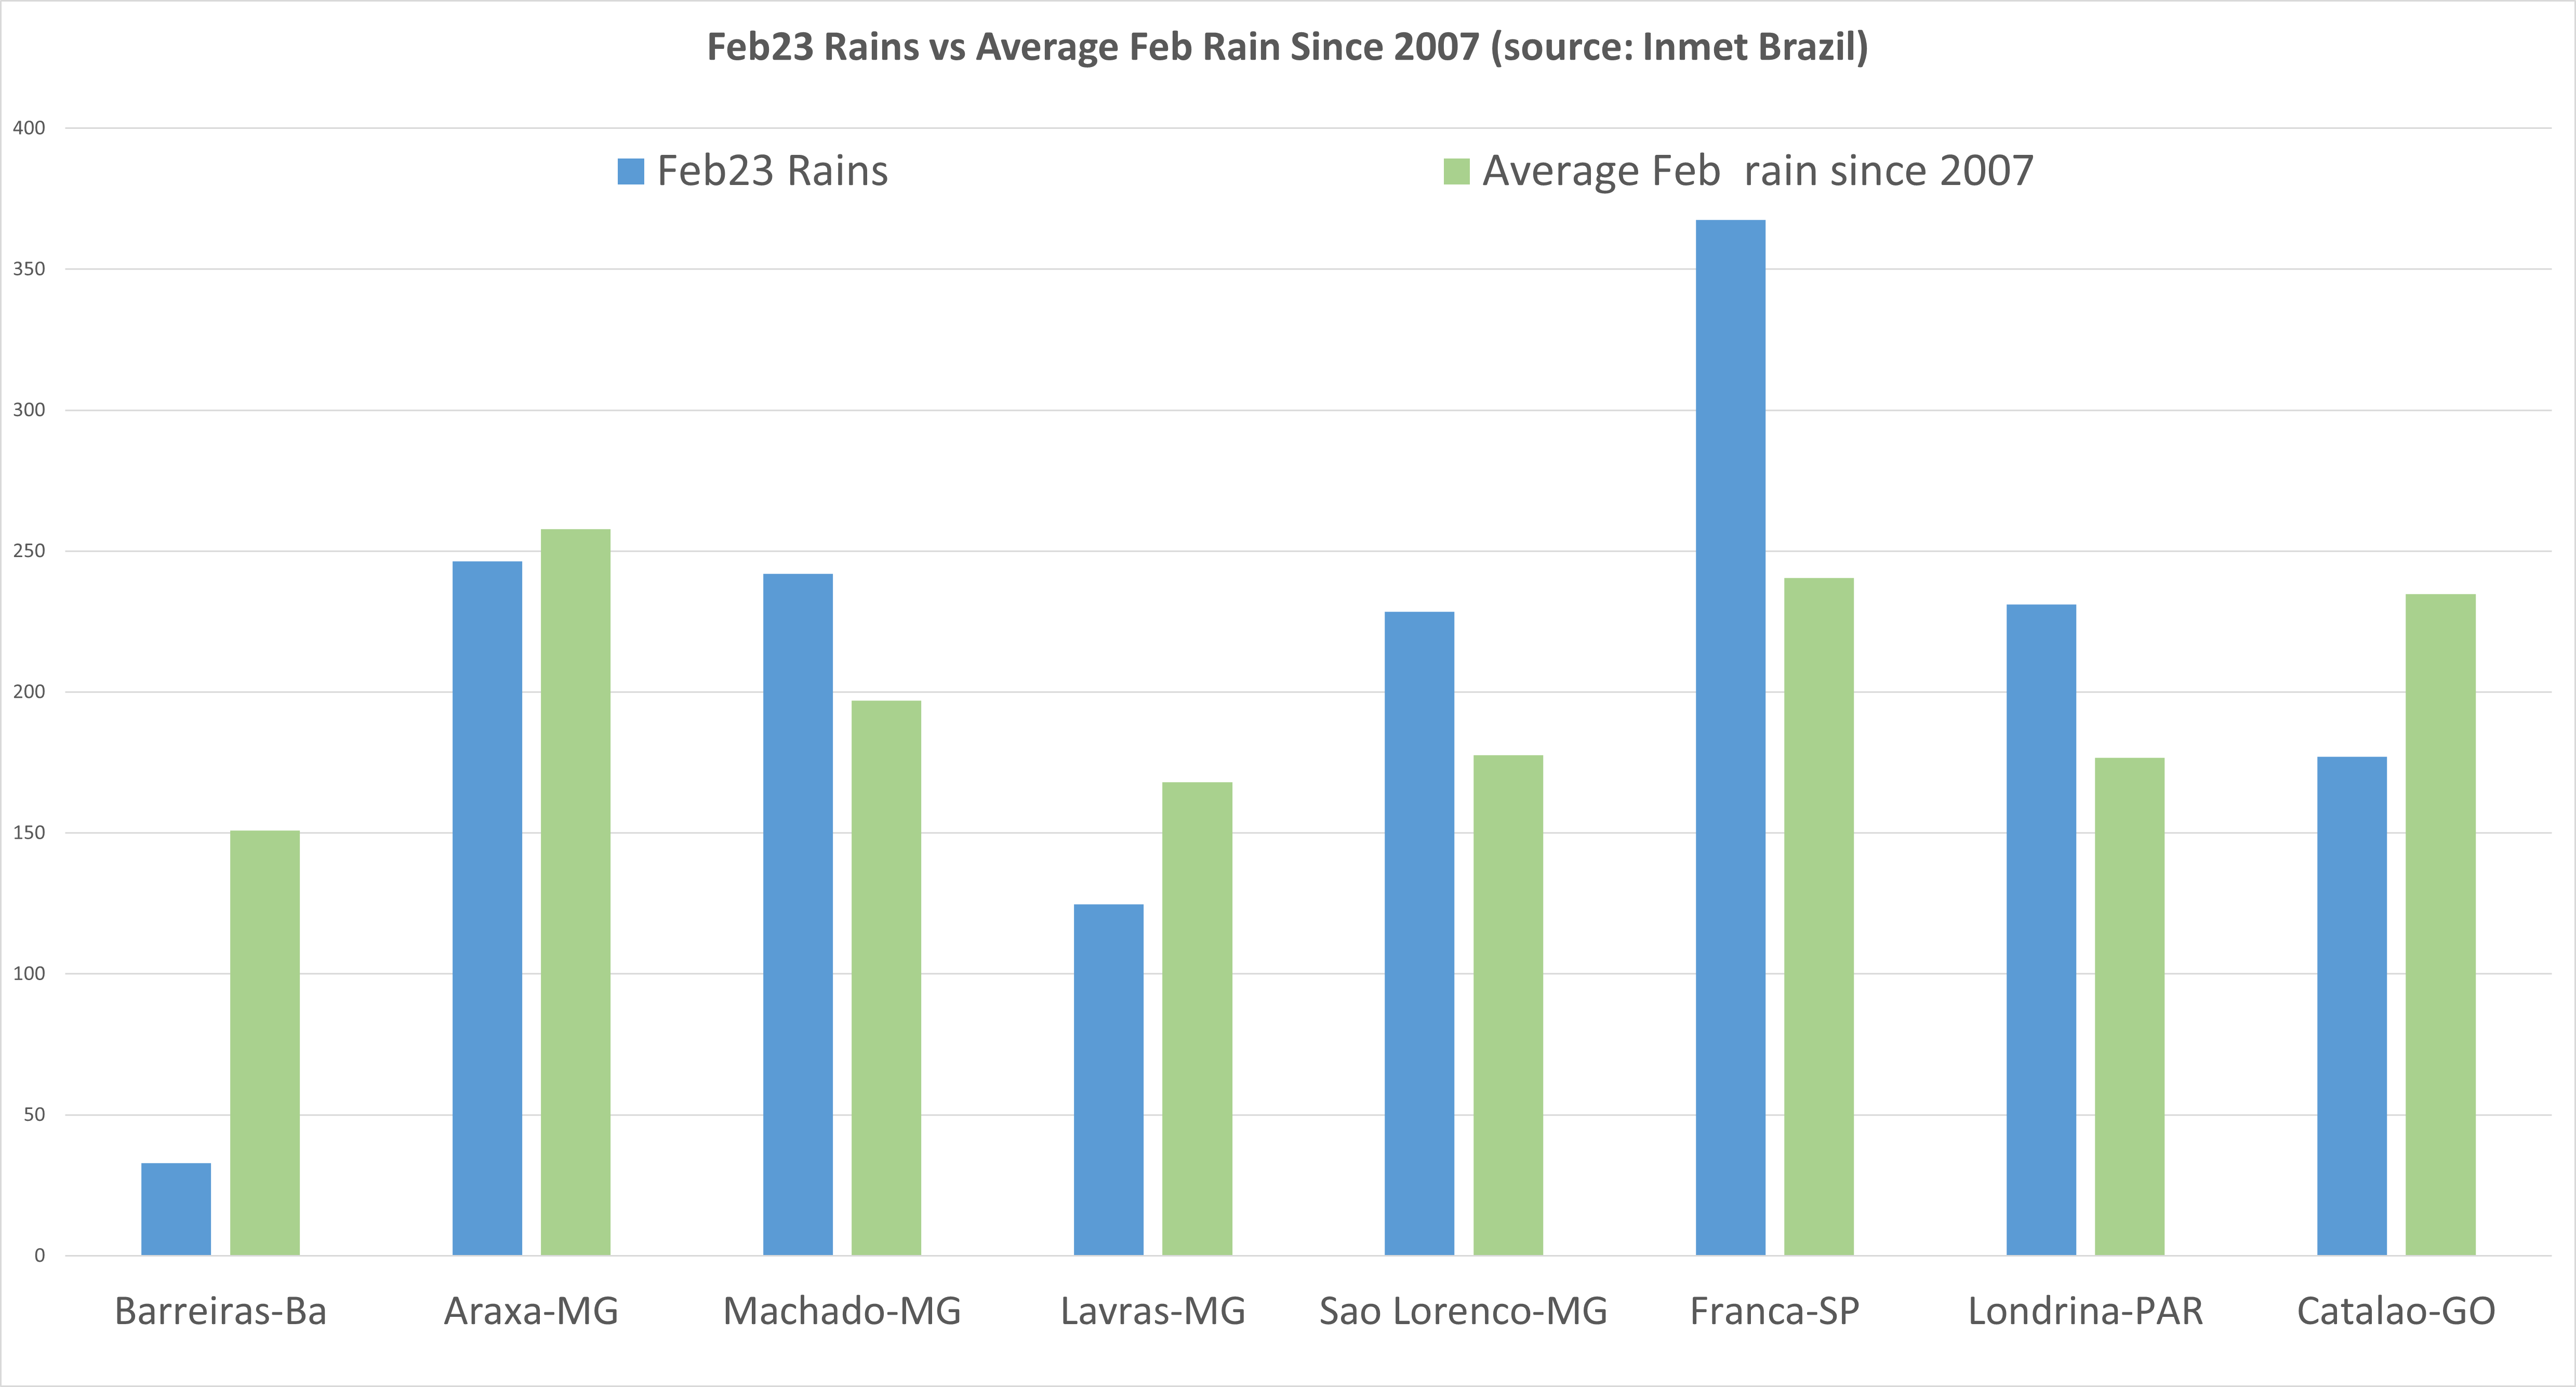
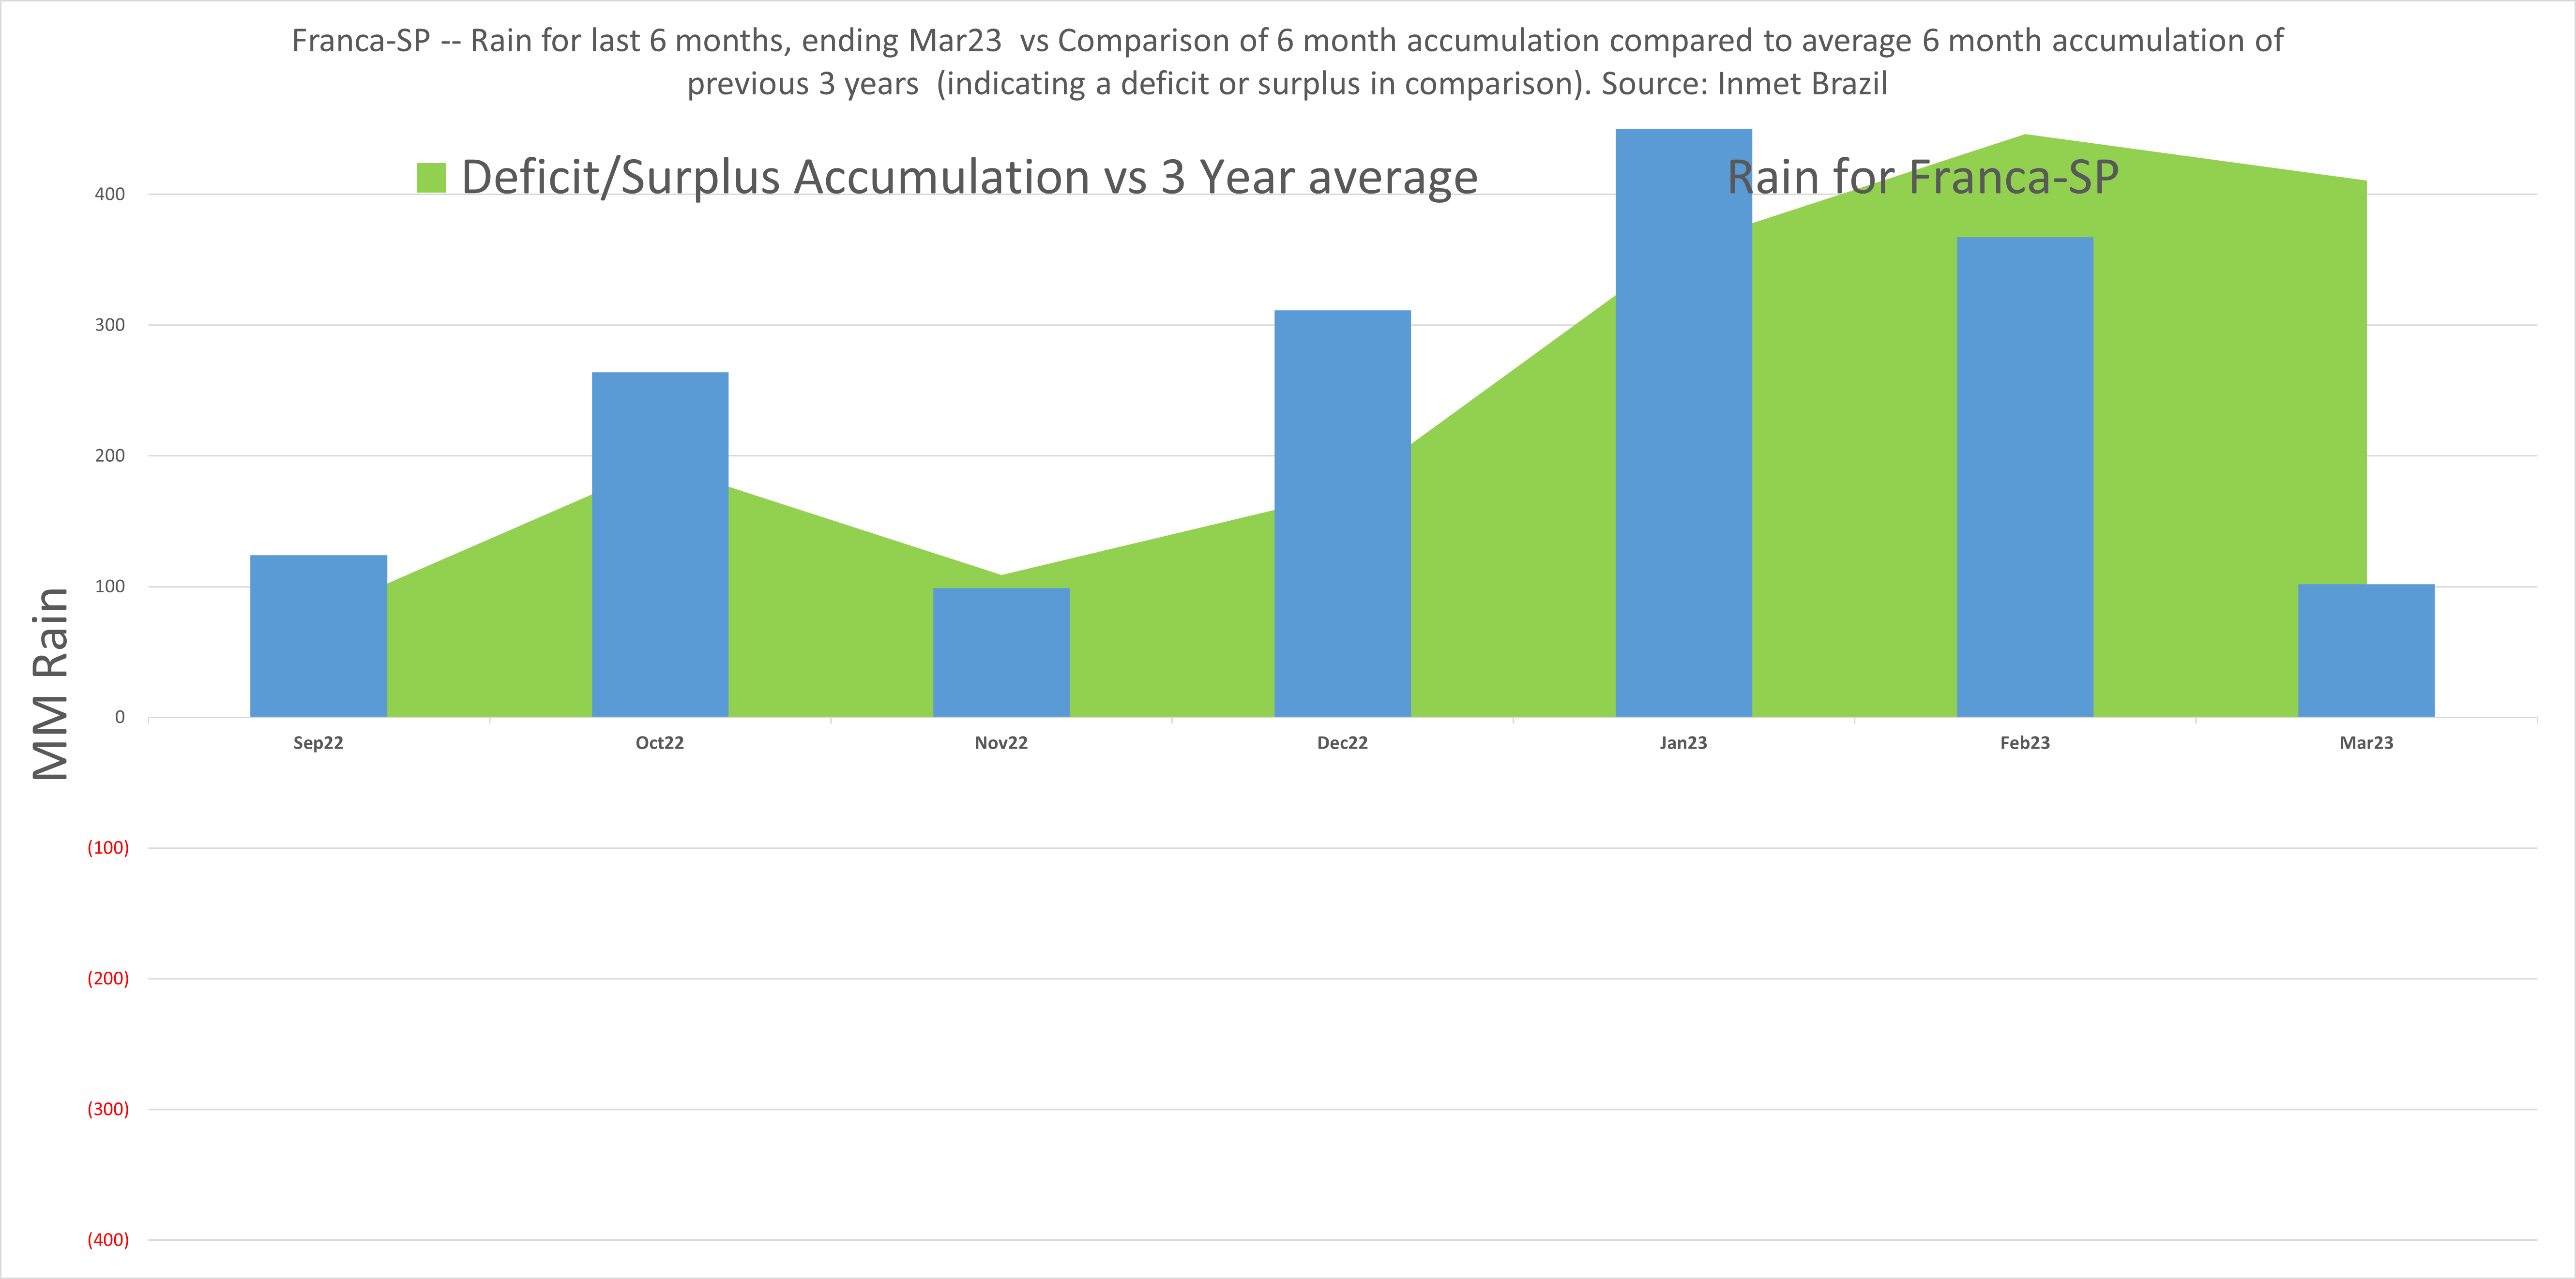
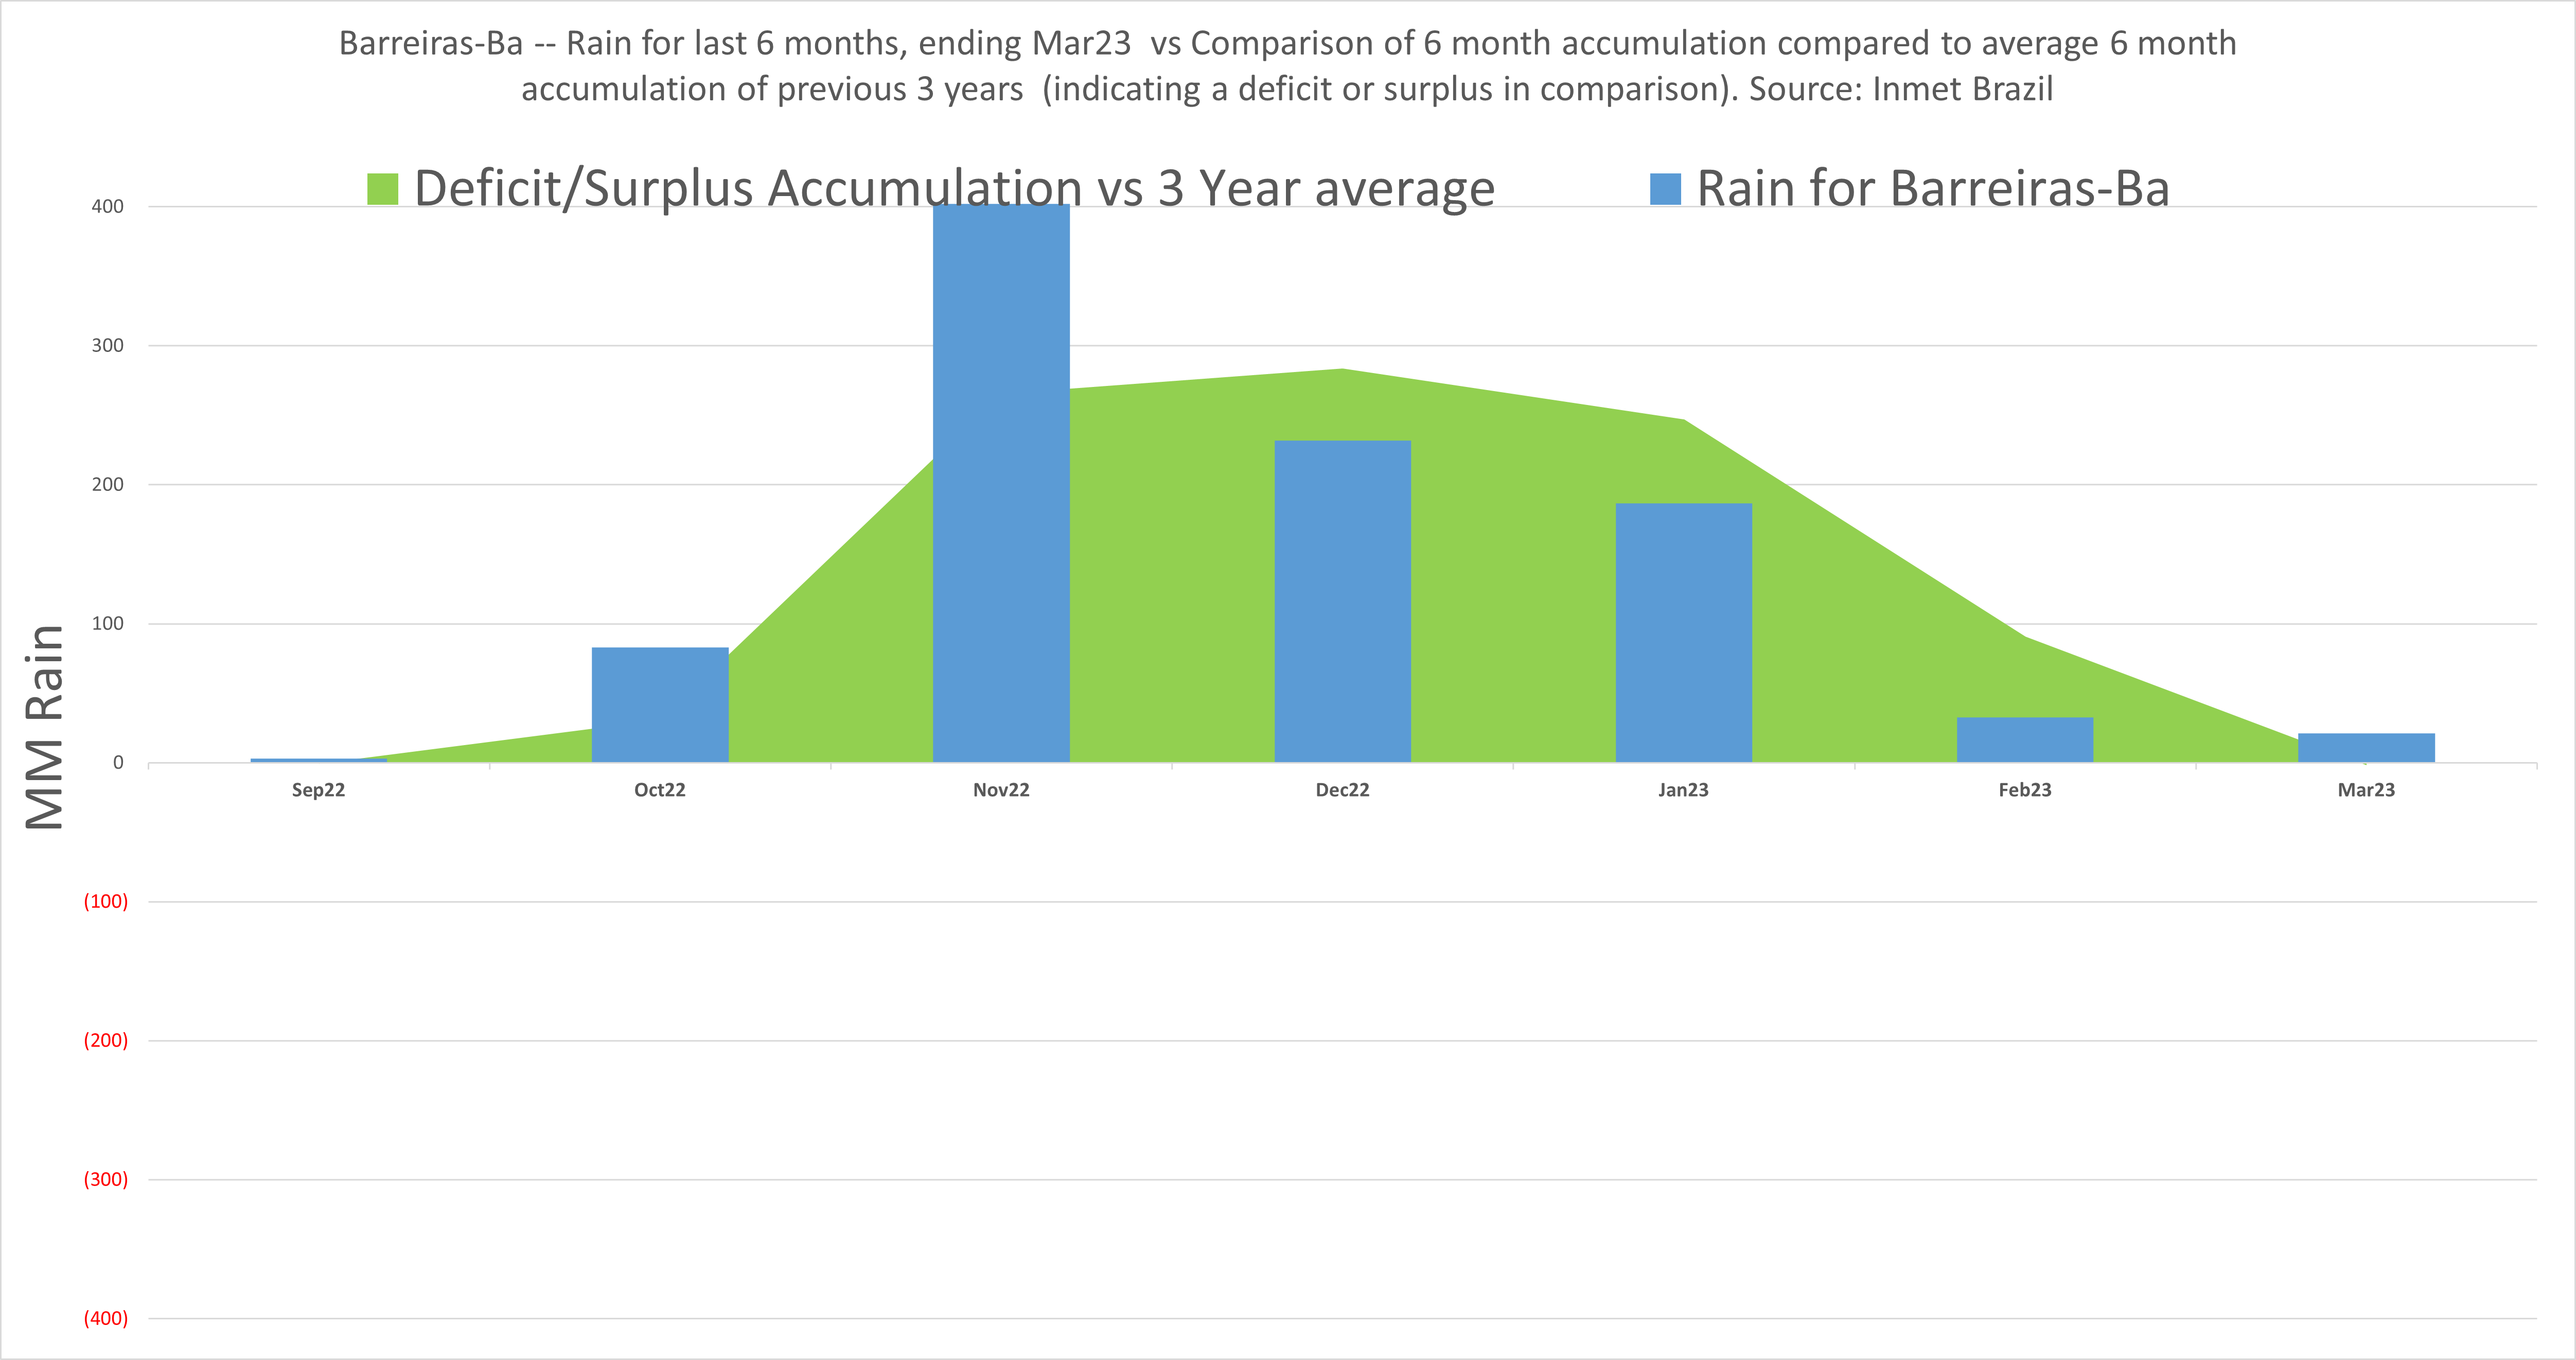
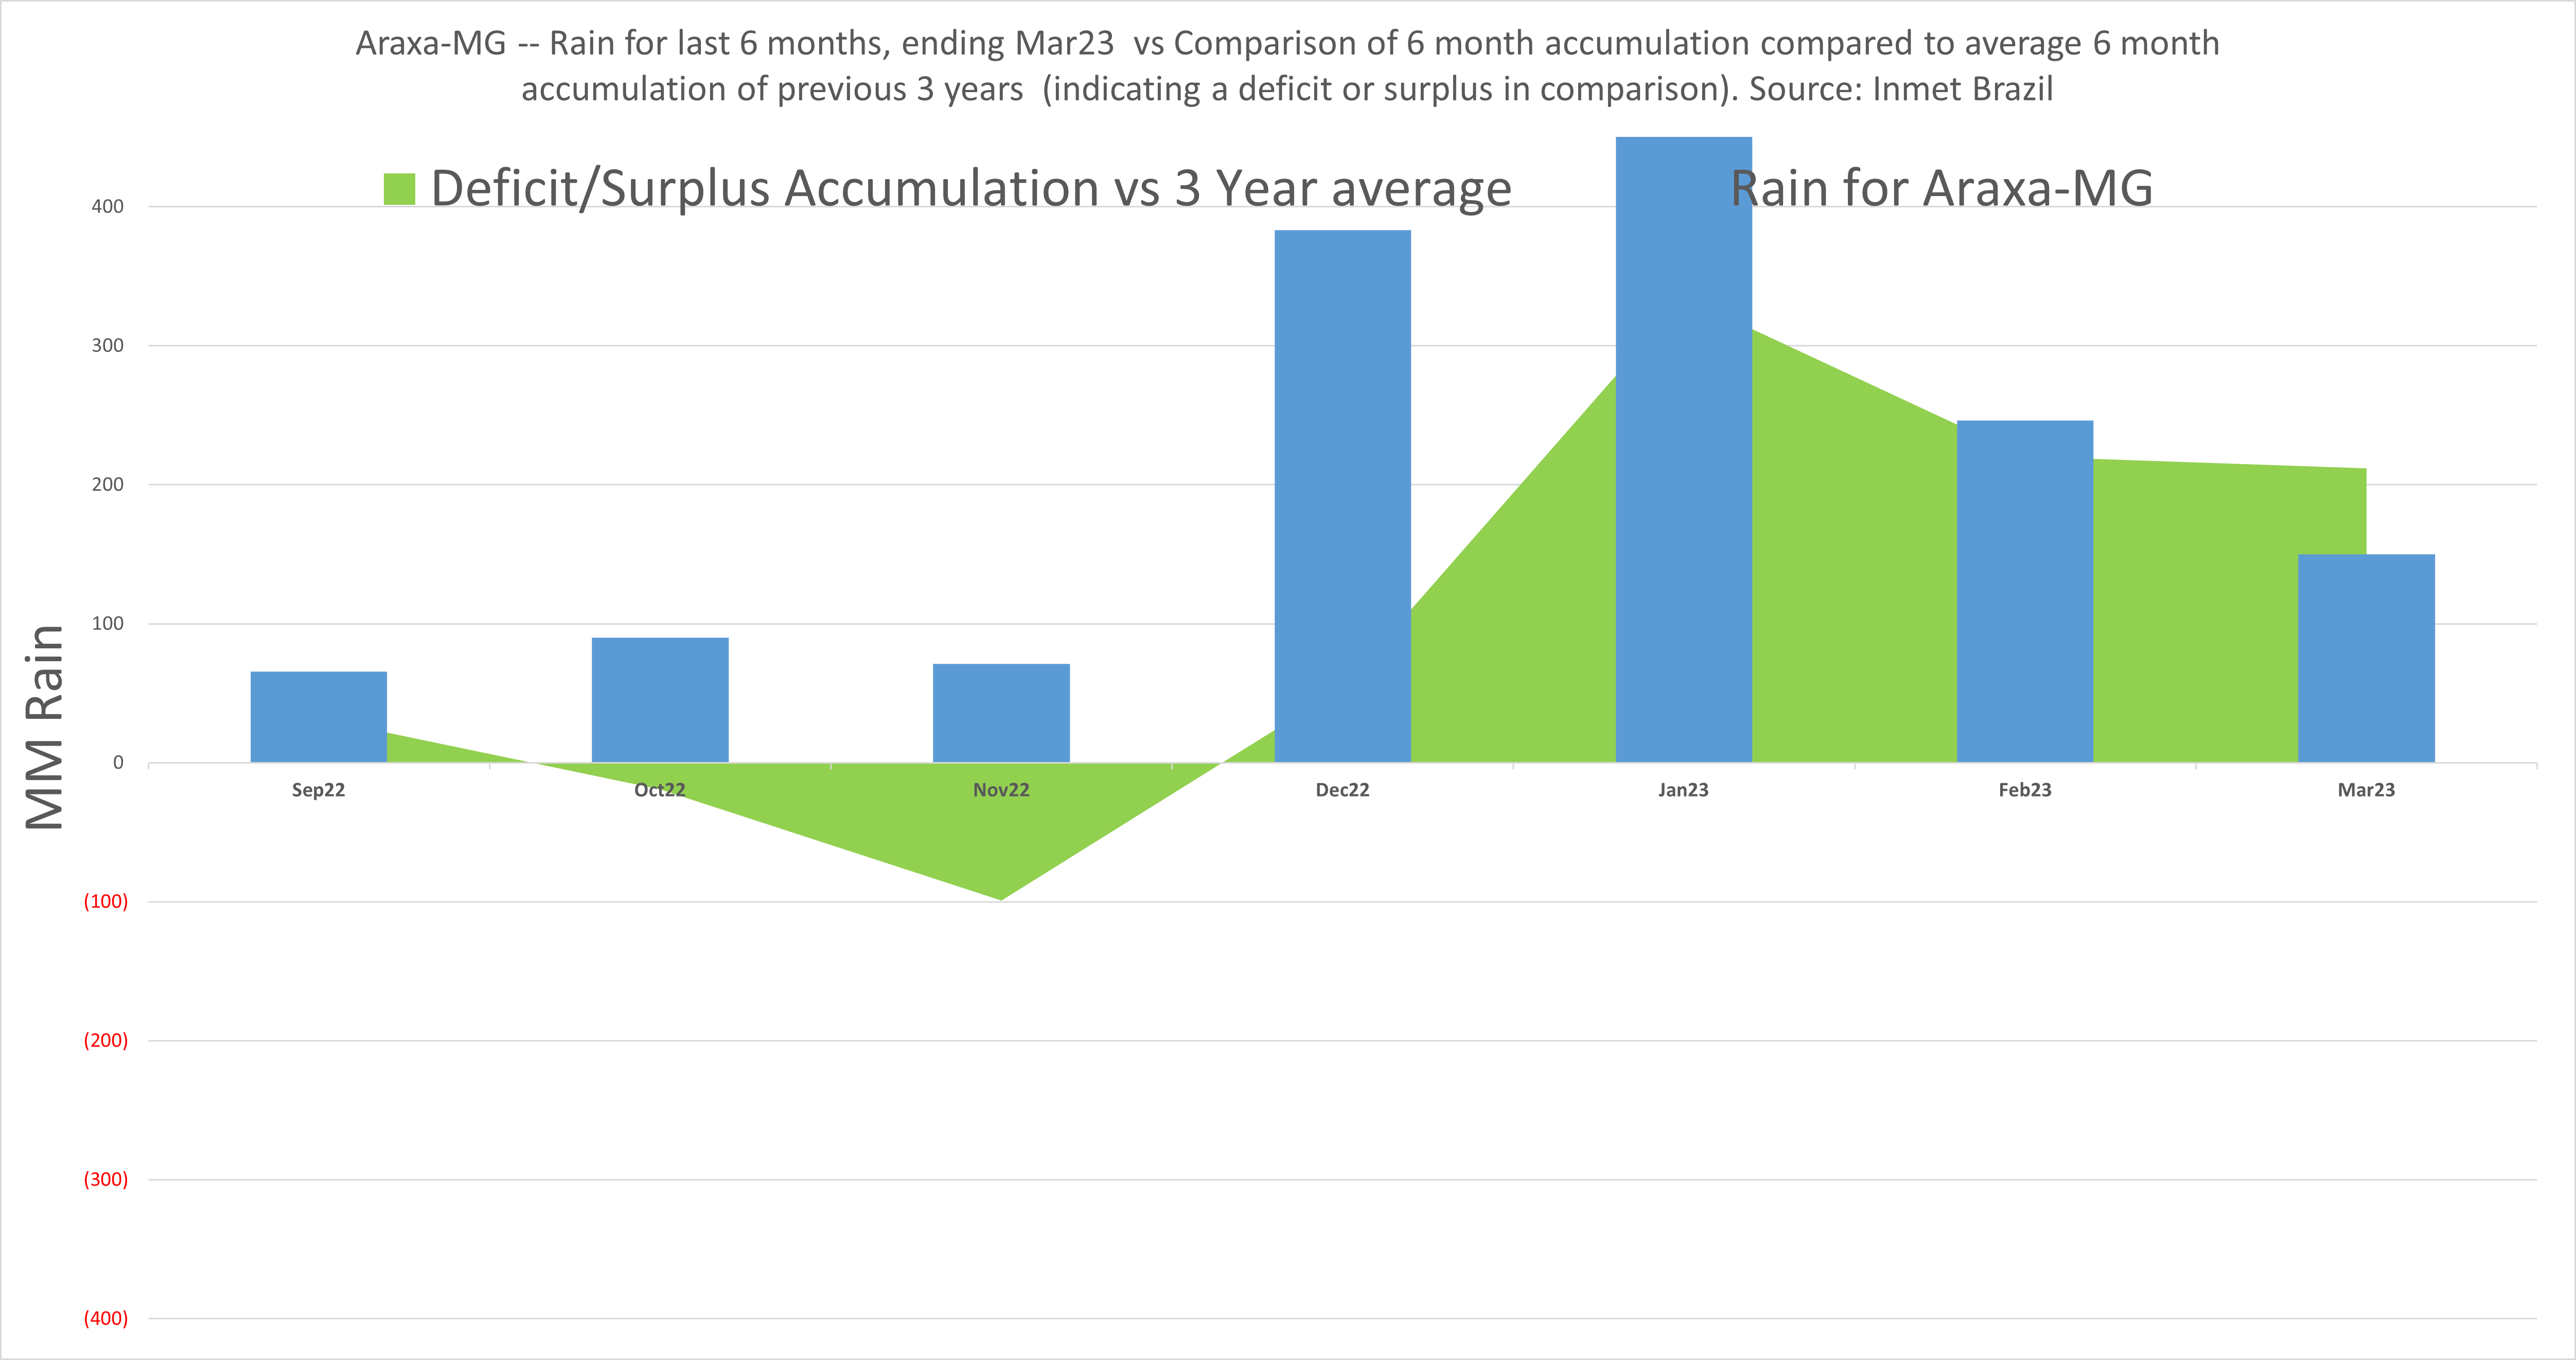
Brazil Rain
- Feb rains generally good.
- First graph is Feb monthly rains vs historical average
- Other graphs are just an indication of accumulation over the last 6 months vs. historical accumulation, including March.
- Moisture is supportive of current and future crops. Some regions might see some net drying.
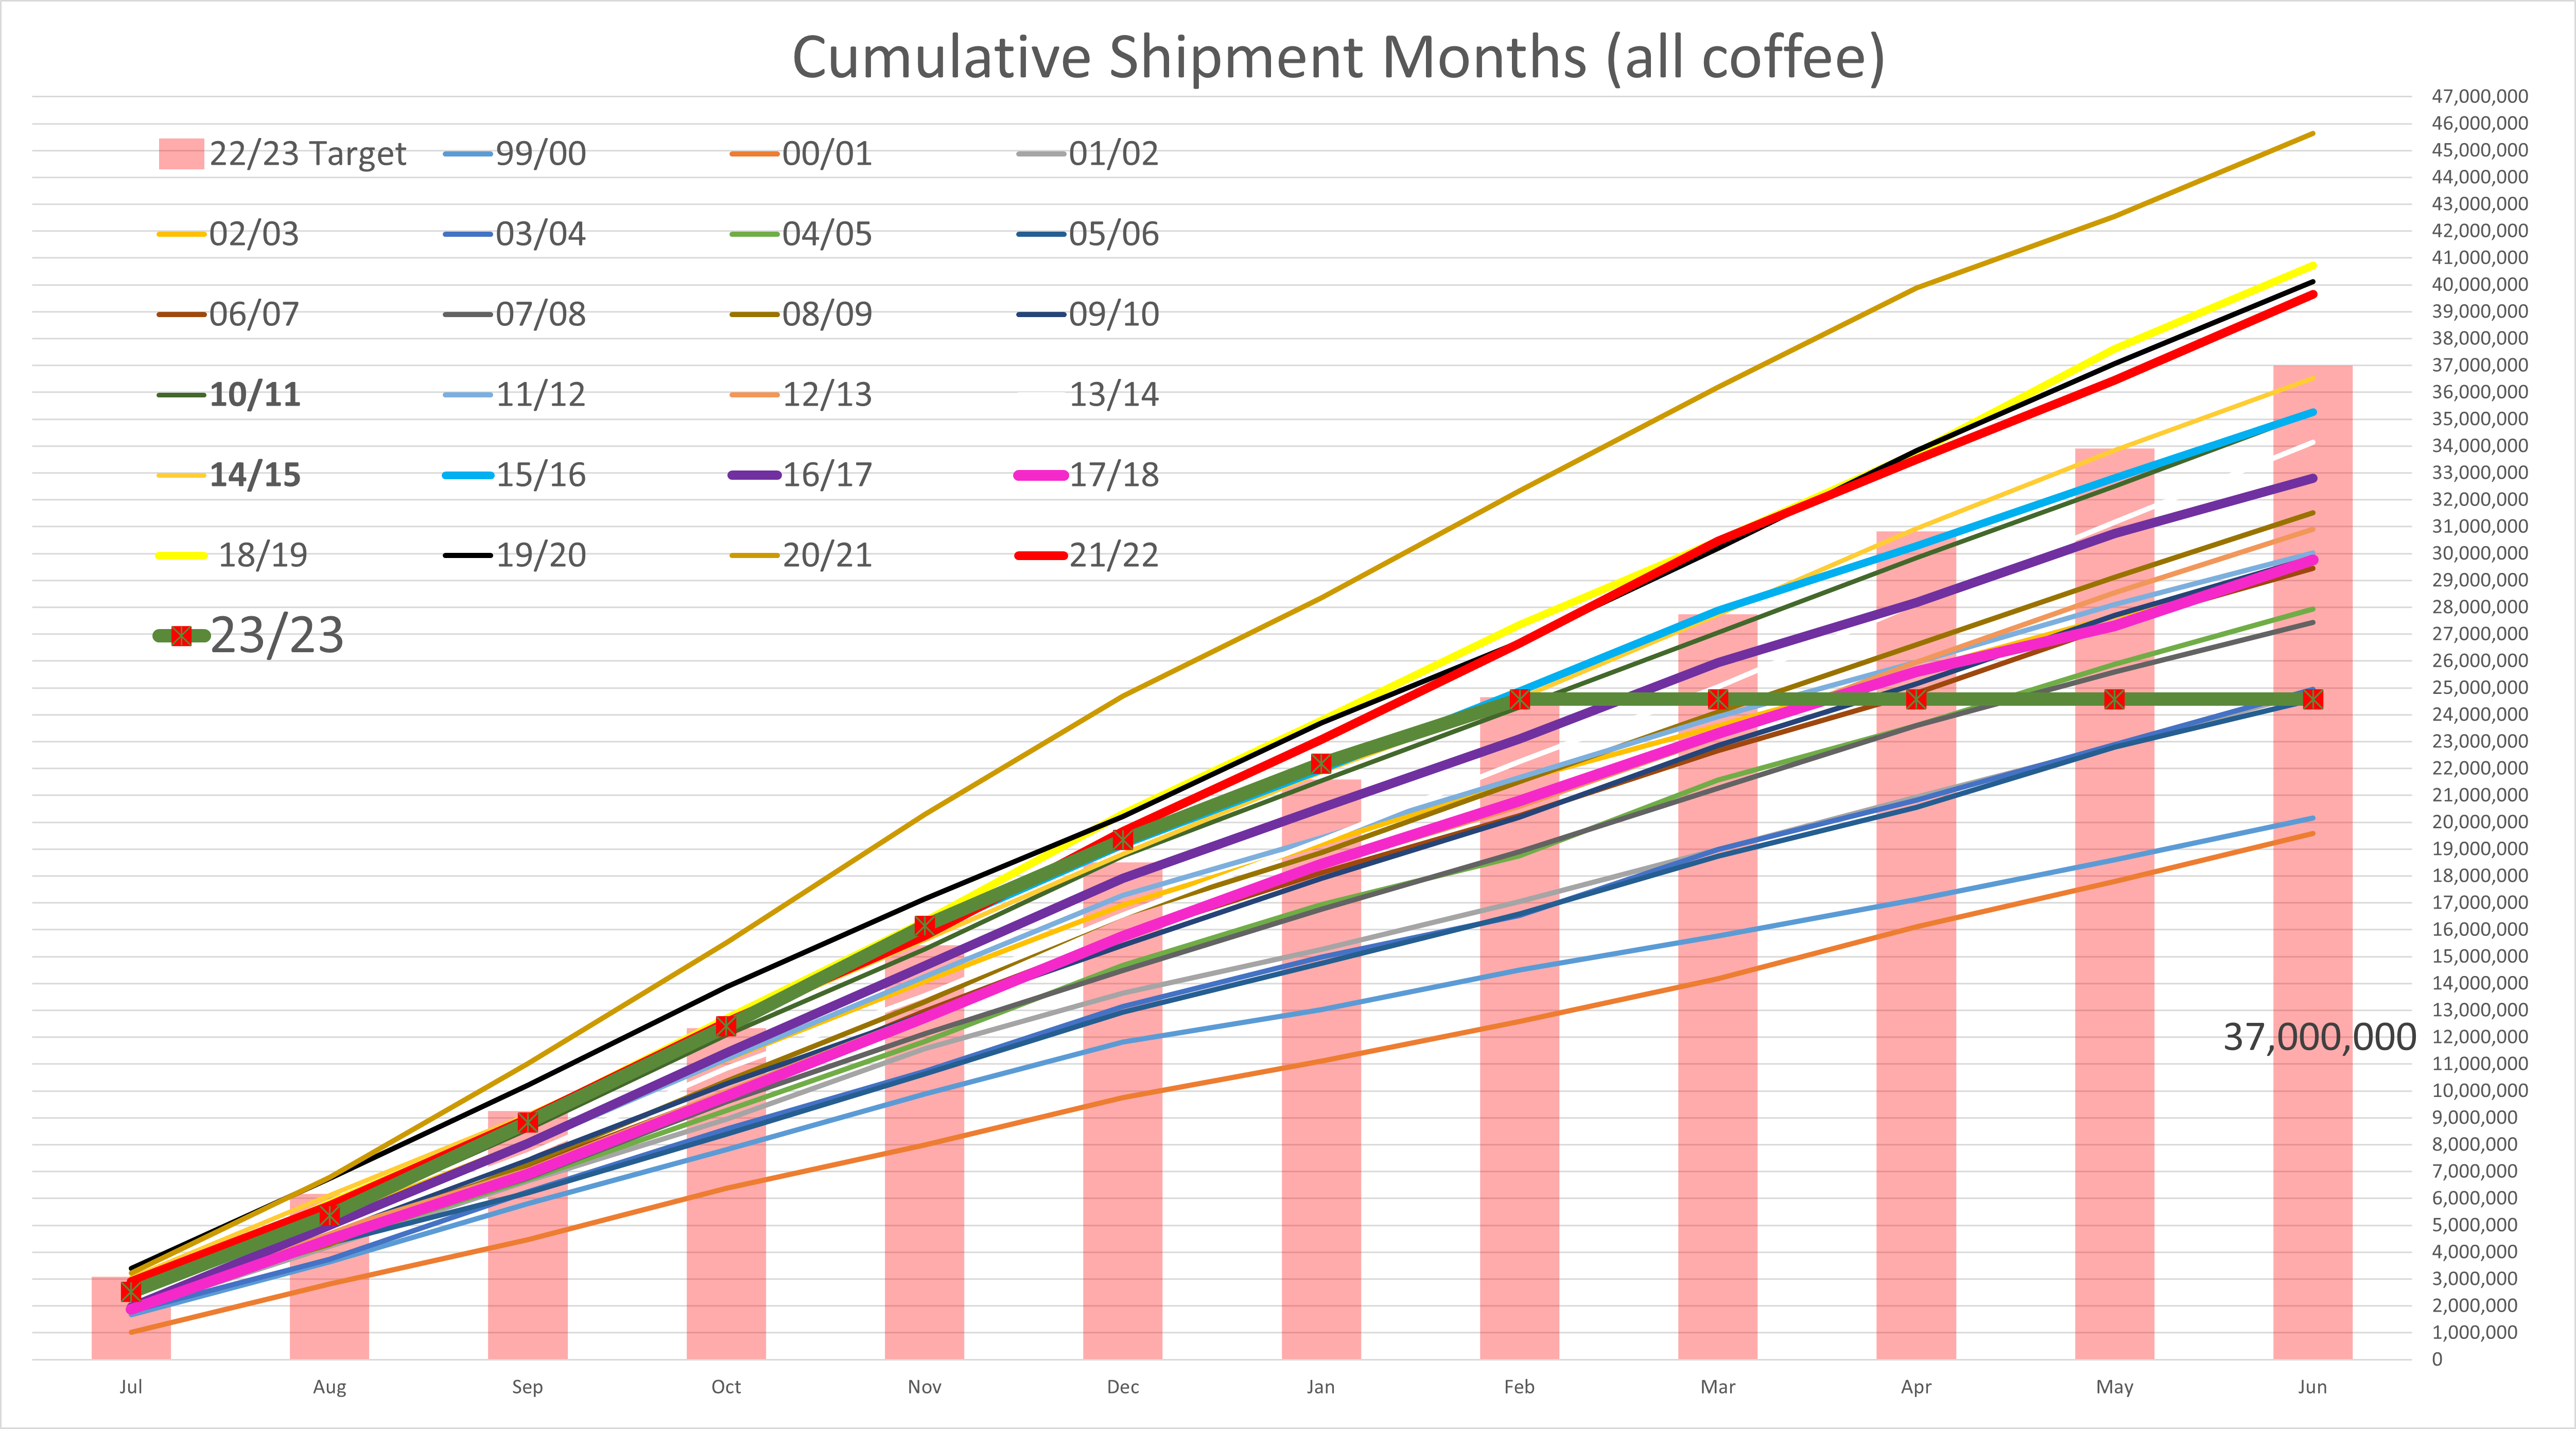
Brazil Export
- Exports pointing towards 37 mm.
- Diffs are high and exports are low which confirms that 22/23 crop might be a tad smaller (60.5 mm?)
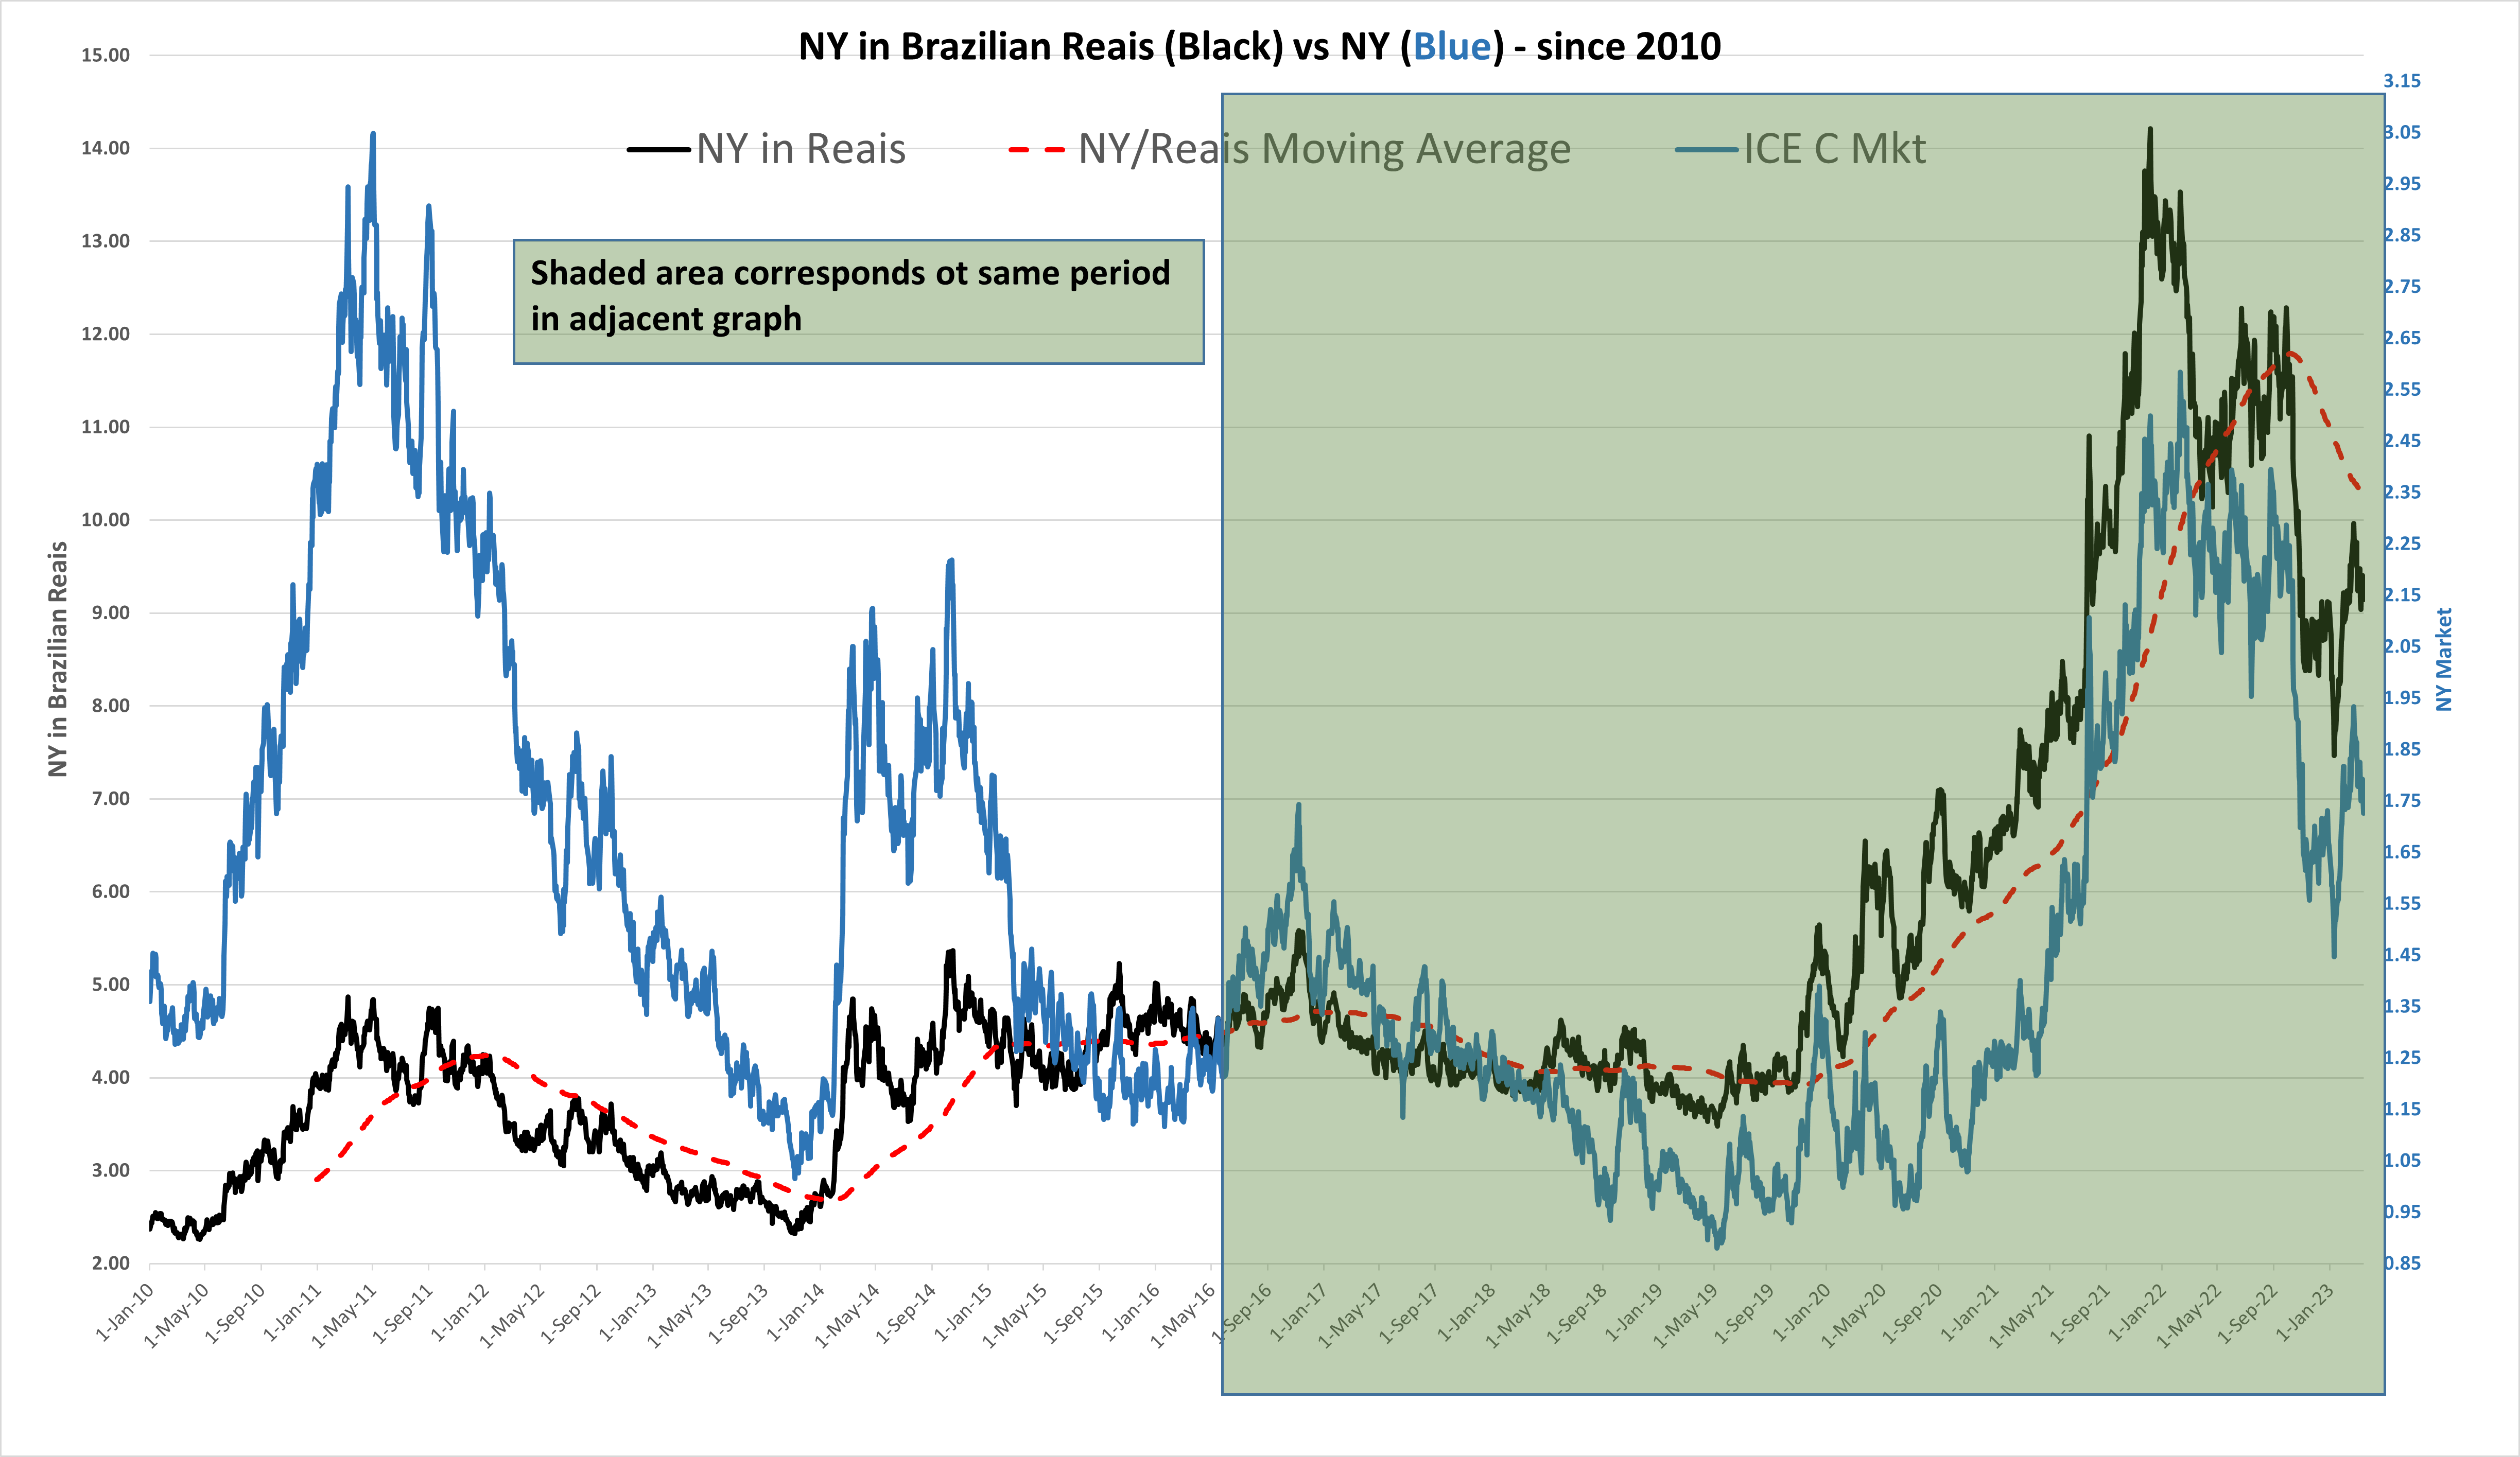
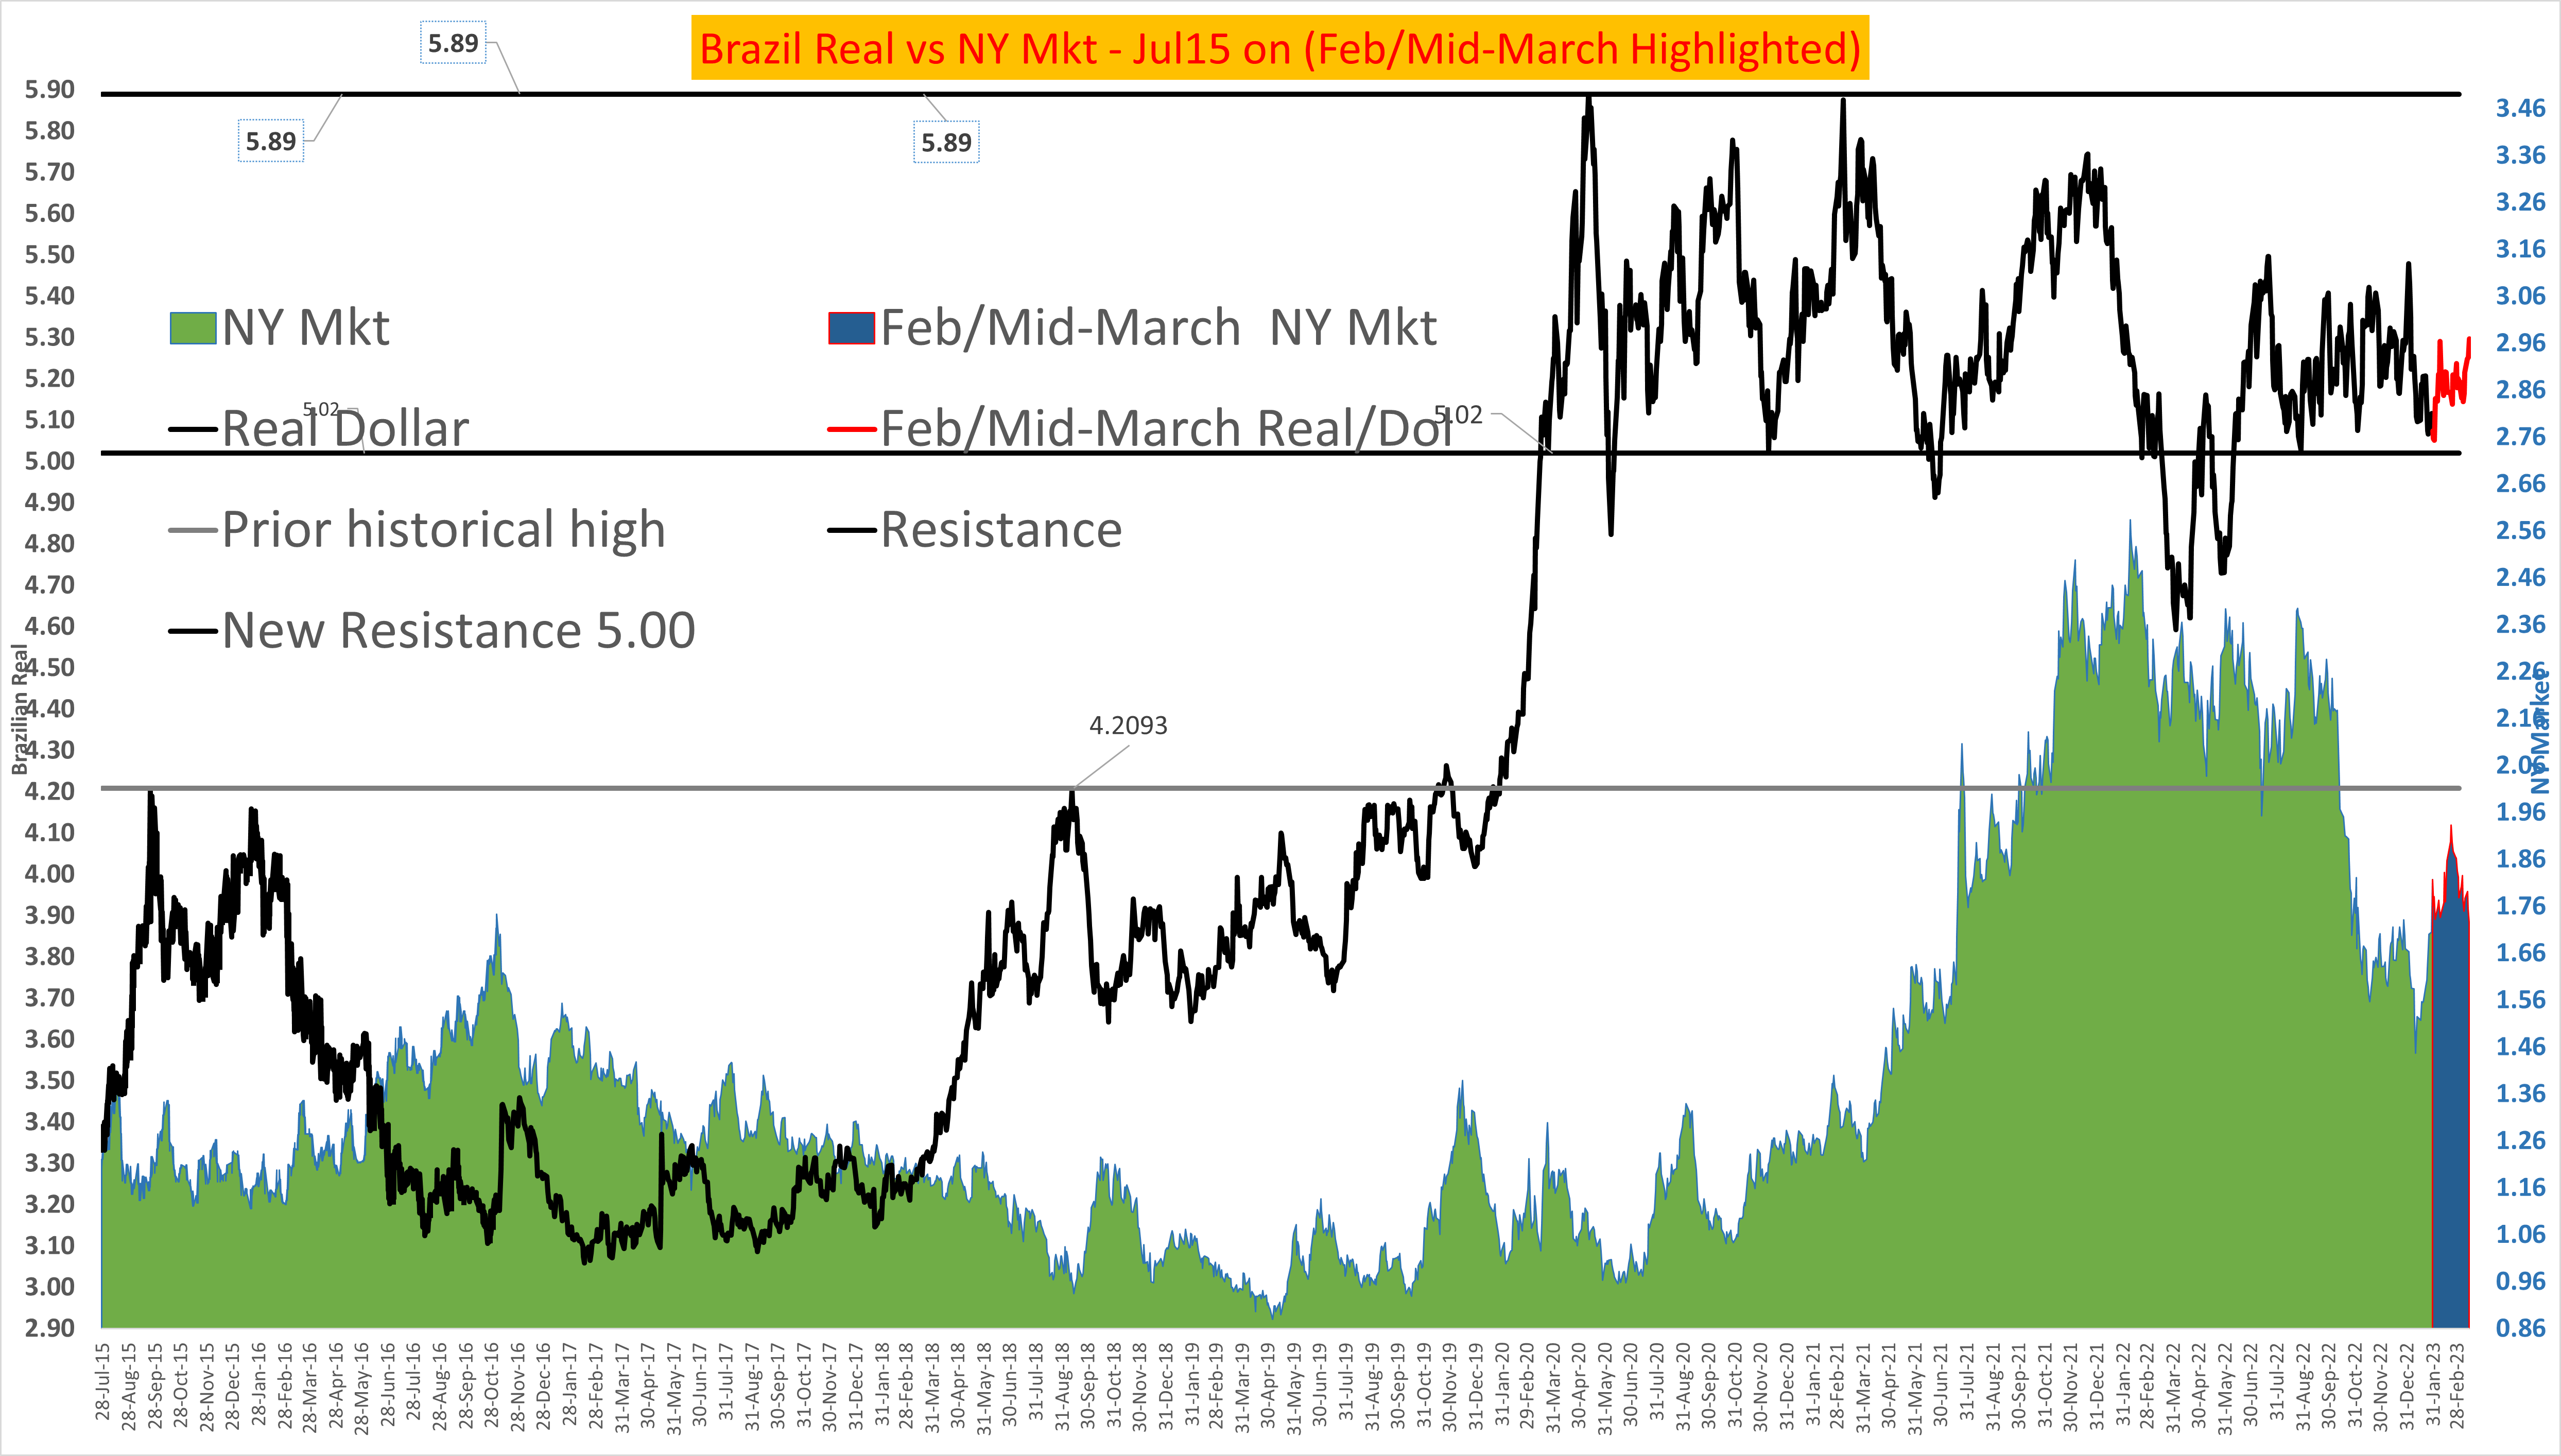
Brazilian Real
- Real still very range bound. As noted below I think overall the dollar weakens.
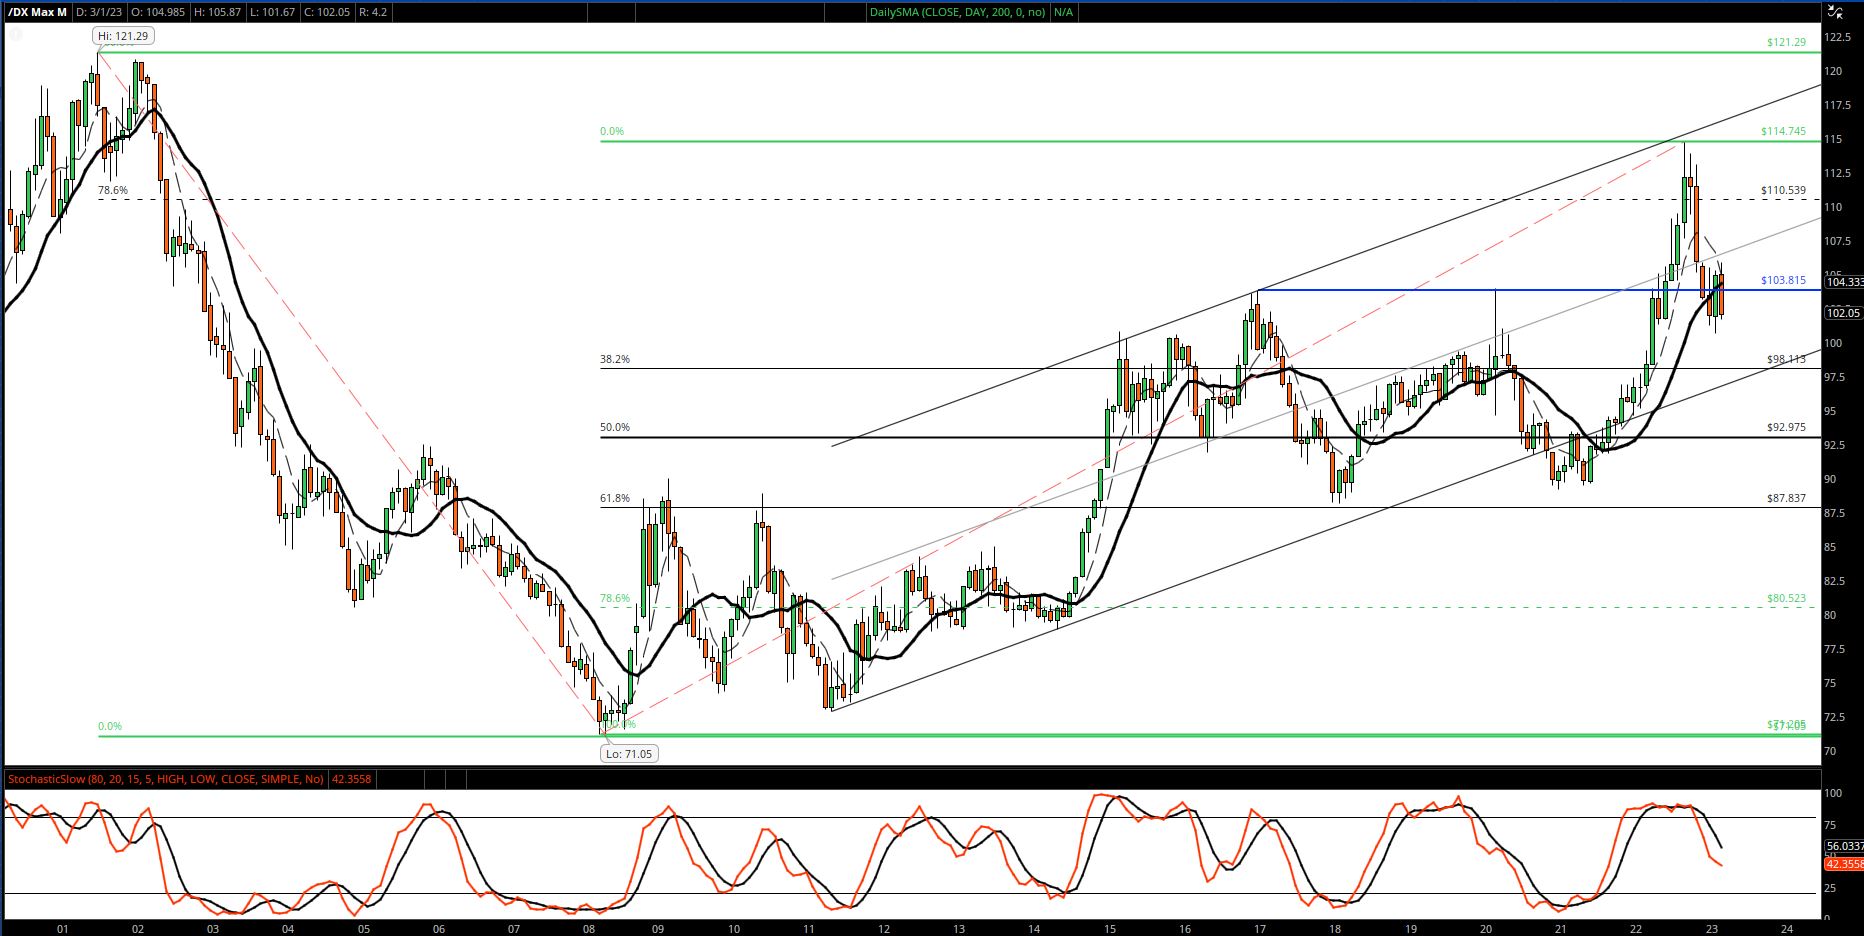
US Dollar
- Monthly graph below
- As expected months ago dollar strengthened to upper channel line. That completes a very sold 5 wave pattern up.
- Expectation now is that we retrace (depreciate) another 5 to 10 %.
- This ought to be supportive of coffee.
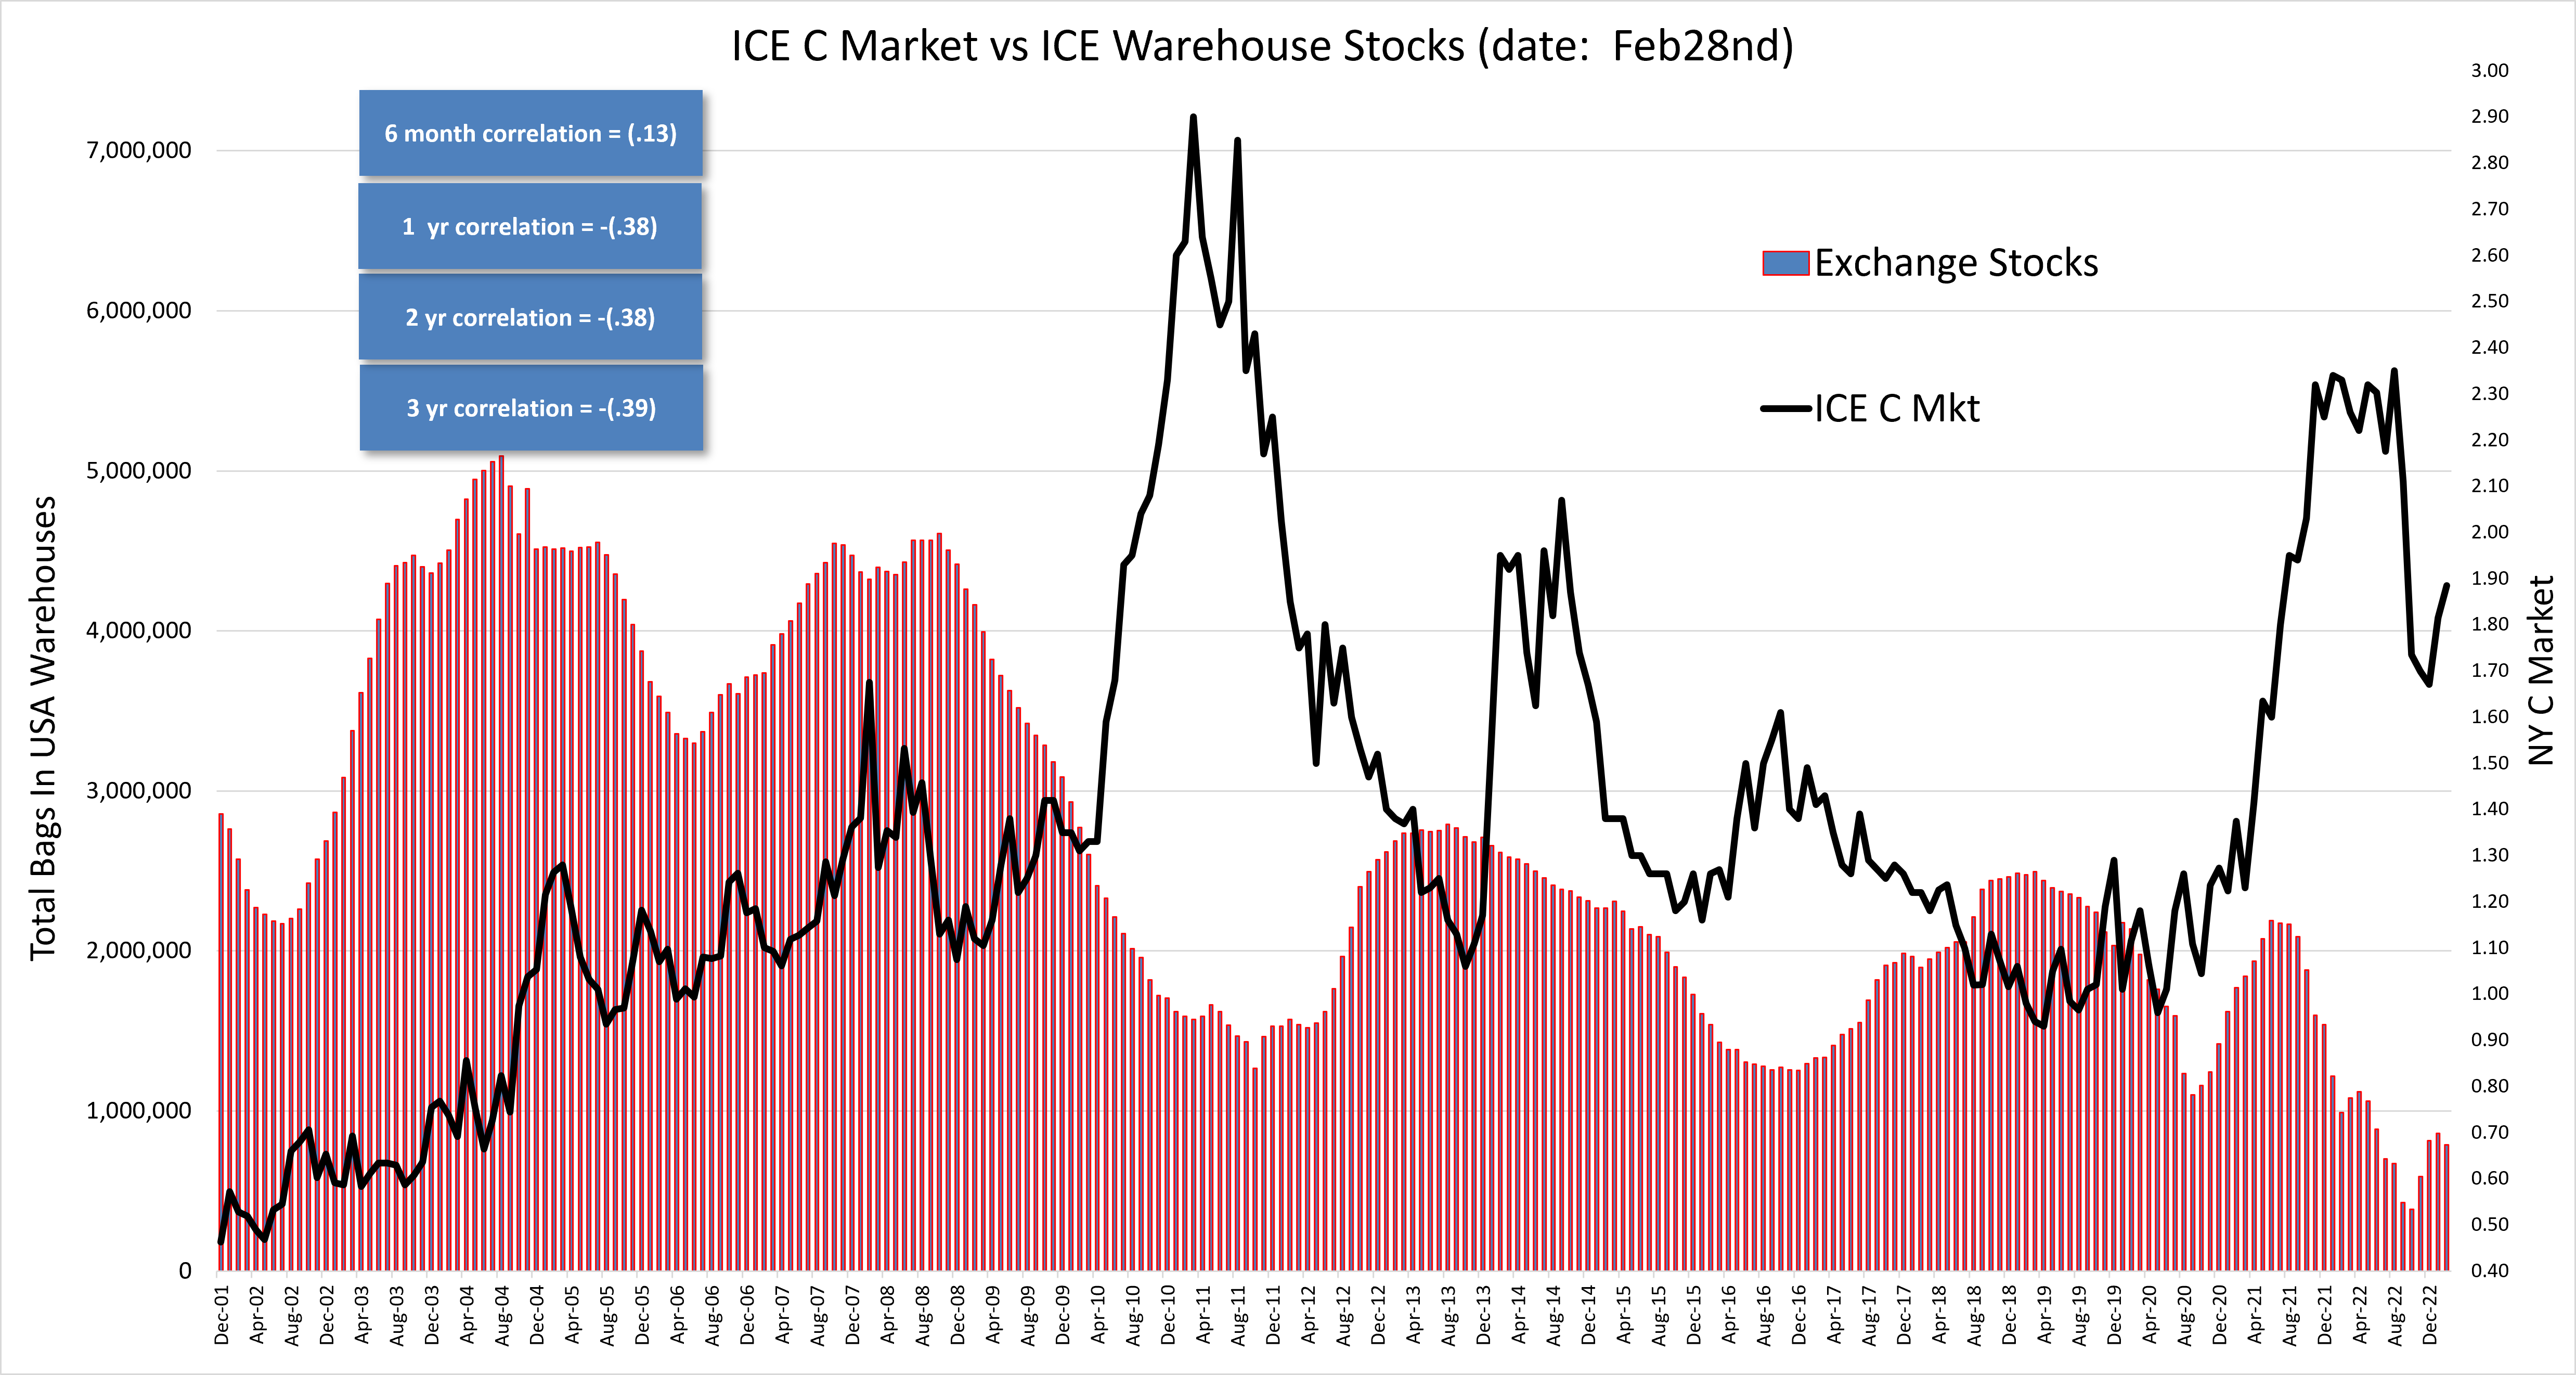
ICE Warehouse Stocks
- Stocks continue to drop with little to no pending lots.
- Until Brazil new crop comes on, nothing new likely to be tendered unless switch tightens more. Currently Brazil diffs are at near record highs.