Jan23 Market Report
Summary
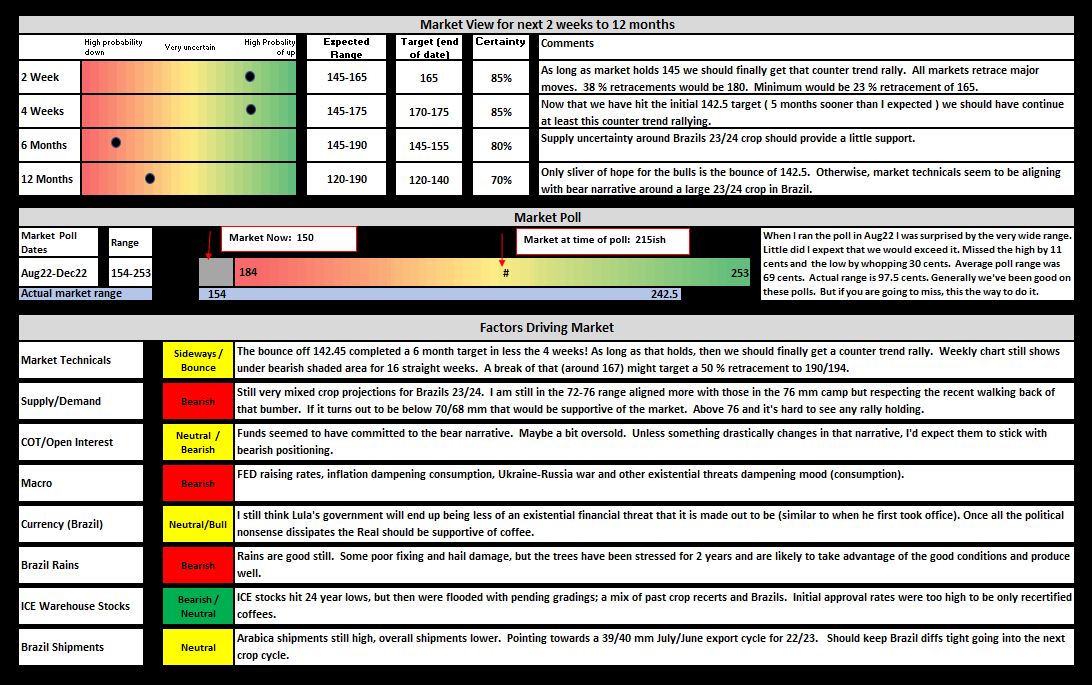
All big market moves (and small) retrace part of that move at some point. With the bulk of the market fall coming from 220 to 142 — that is, an impulsive 78 cent fall – we can probably safely assume that we will get some retracement of those 78 cents. High probability retracements tend to follow Fibonacci percentages of either 38 %, 50 % or 62 % (sometimes in really powerful moves, it will only retrace 24 %). There is decent technical evidence that at least a short-term low was put in place at 142.45. Therefore using above Fibonacci retracement levels we ought to see either 181, 194 or 205, respectively (or maybe only 165 using the 24 % retracement). But a safer bet would be closer to 181.
The two biggest technical factors supporting 142.45 as the short-term low are the fact that we bounced perfectly off historical resistance at 142.45 and, more arcanely, the first leg down of this fall matches perfectly this last leg down (that is a common pattern in movements of this type and magnitude and can be seen in the daily graph below).
Fundamentally, it’s a little too soon to be so certain about the size of the Brazil 23/24 crop, although it does point to being quite high (still hotly debate). Therefore, fundamentally we ought to get a bit of a pause that would be susceptible to any bullish news that might trigger short covering of Funds/Managed Money that is now decidedly short. Not nearly as short as they got in 2018, but on par with other over-extended short positioning. In 2018 they had a much more certain fundamental picture and the switch was considerably more in their favor.
Last report I thought we might get that retracement from 165, but eventually target 140. We did not get much of a retracement (more of a pause) but then quickly targeted this 140 level. Mea Culpa, but here we are now better positioned to see another retracement.
Is the secular bull story completely over? Hard to say. Right now nearly all signs both technical and fundamental support at least a medium term bearish stance. Depending on where the counter trend finds resistance and what it does when it gets there will help guide future views.
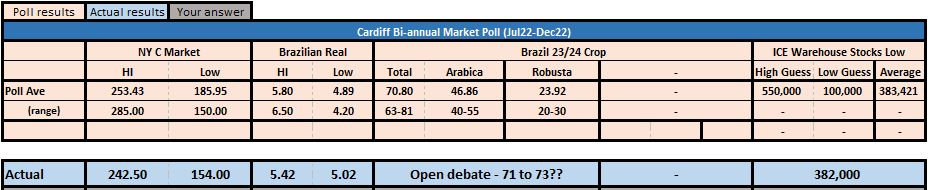
Update on the Aug22-Dec22 poll results.
- This was our worst poll as a group, although we nailed the prediction on how low the ICE Warehouse stocks would get. We came with in 1,000 bags of picking the low! I think this is a pretty interesting point. As a group the average expected low was 383,000 bags. The actual low was 382,000 bags. In real time the decline in ICE warehouse bags was matching everyone’s expectations and the switch was nearly inverted 10 cents. Both of those provided “evidence” that the bull thesis was correct. What happened was a near 70 cent fall of the market; which caught many by surprise, especially in its brutal relentlessness: the first 55 cents were nearly all down days. I think this ended up causing people to hold onto positions longer than they normally would have if they were following good risk management principles. And probably explains some of the relentless fall as positions were forced to liquidate.
- Poll results summary graphic:
- Highlights:
- Market
- Expected market range of 186 to 253.
- Actual market range was 154 to 252.
- Brazil 23/34 Crop
- Expected range: 63 to 81
- Actual: still not known, but still quite a range. I think it is likely more in the 67 to 74 mm range now. (next poll will ask this again).
- ICE Warehouse Stocks
- Expected low: 383,000
- Actual low: 382,000 !!!!
- Market
- Highlights:
So, as stated above, I do expect the retracement off the low and I think at least 181 is likely. Major resistance and conversely a big pull is closer to 210 right now. As time passes that will start to come down, but those major moving average (reversion to the mean) always happen at some point. If you had asked me 6 months ago what fair value is with a Brazil 23/24 crop of 76 mm, I would have said 150.
Recommendations
Buying physical coffee here and/or selling 140 puts and buying 180/220 call spreads would probably be a good bet.
Expectations that over the next 12 months better buying opportunities ought to emerge. If we somehow rally and start trading above 200/210 and hold there, then maybe this entire move down was just a correction of a major bull market. Does not seem likely right now.
Summary Graphic
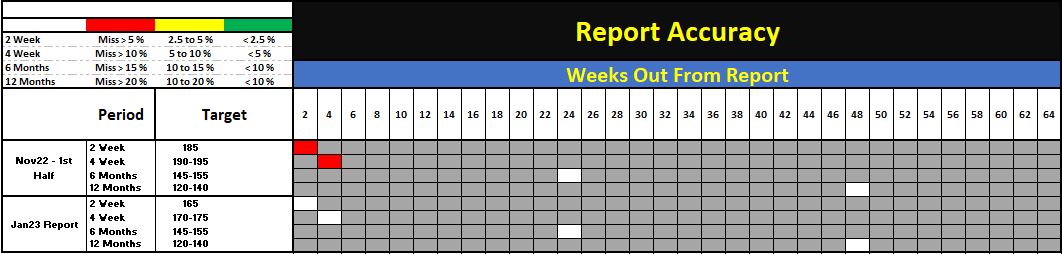
Report Accuracy
- In an effort to keep track of how useful these reports might be I am keeping a report card on how accurate the predictions are. Ie, with how many grains of salt should these recommendations be taken?
Supporting Graphs
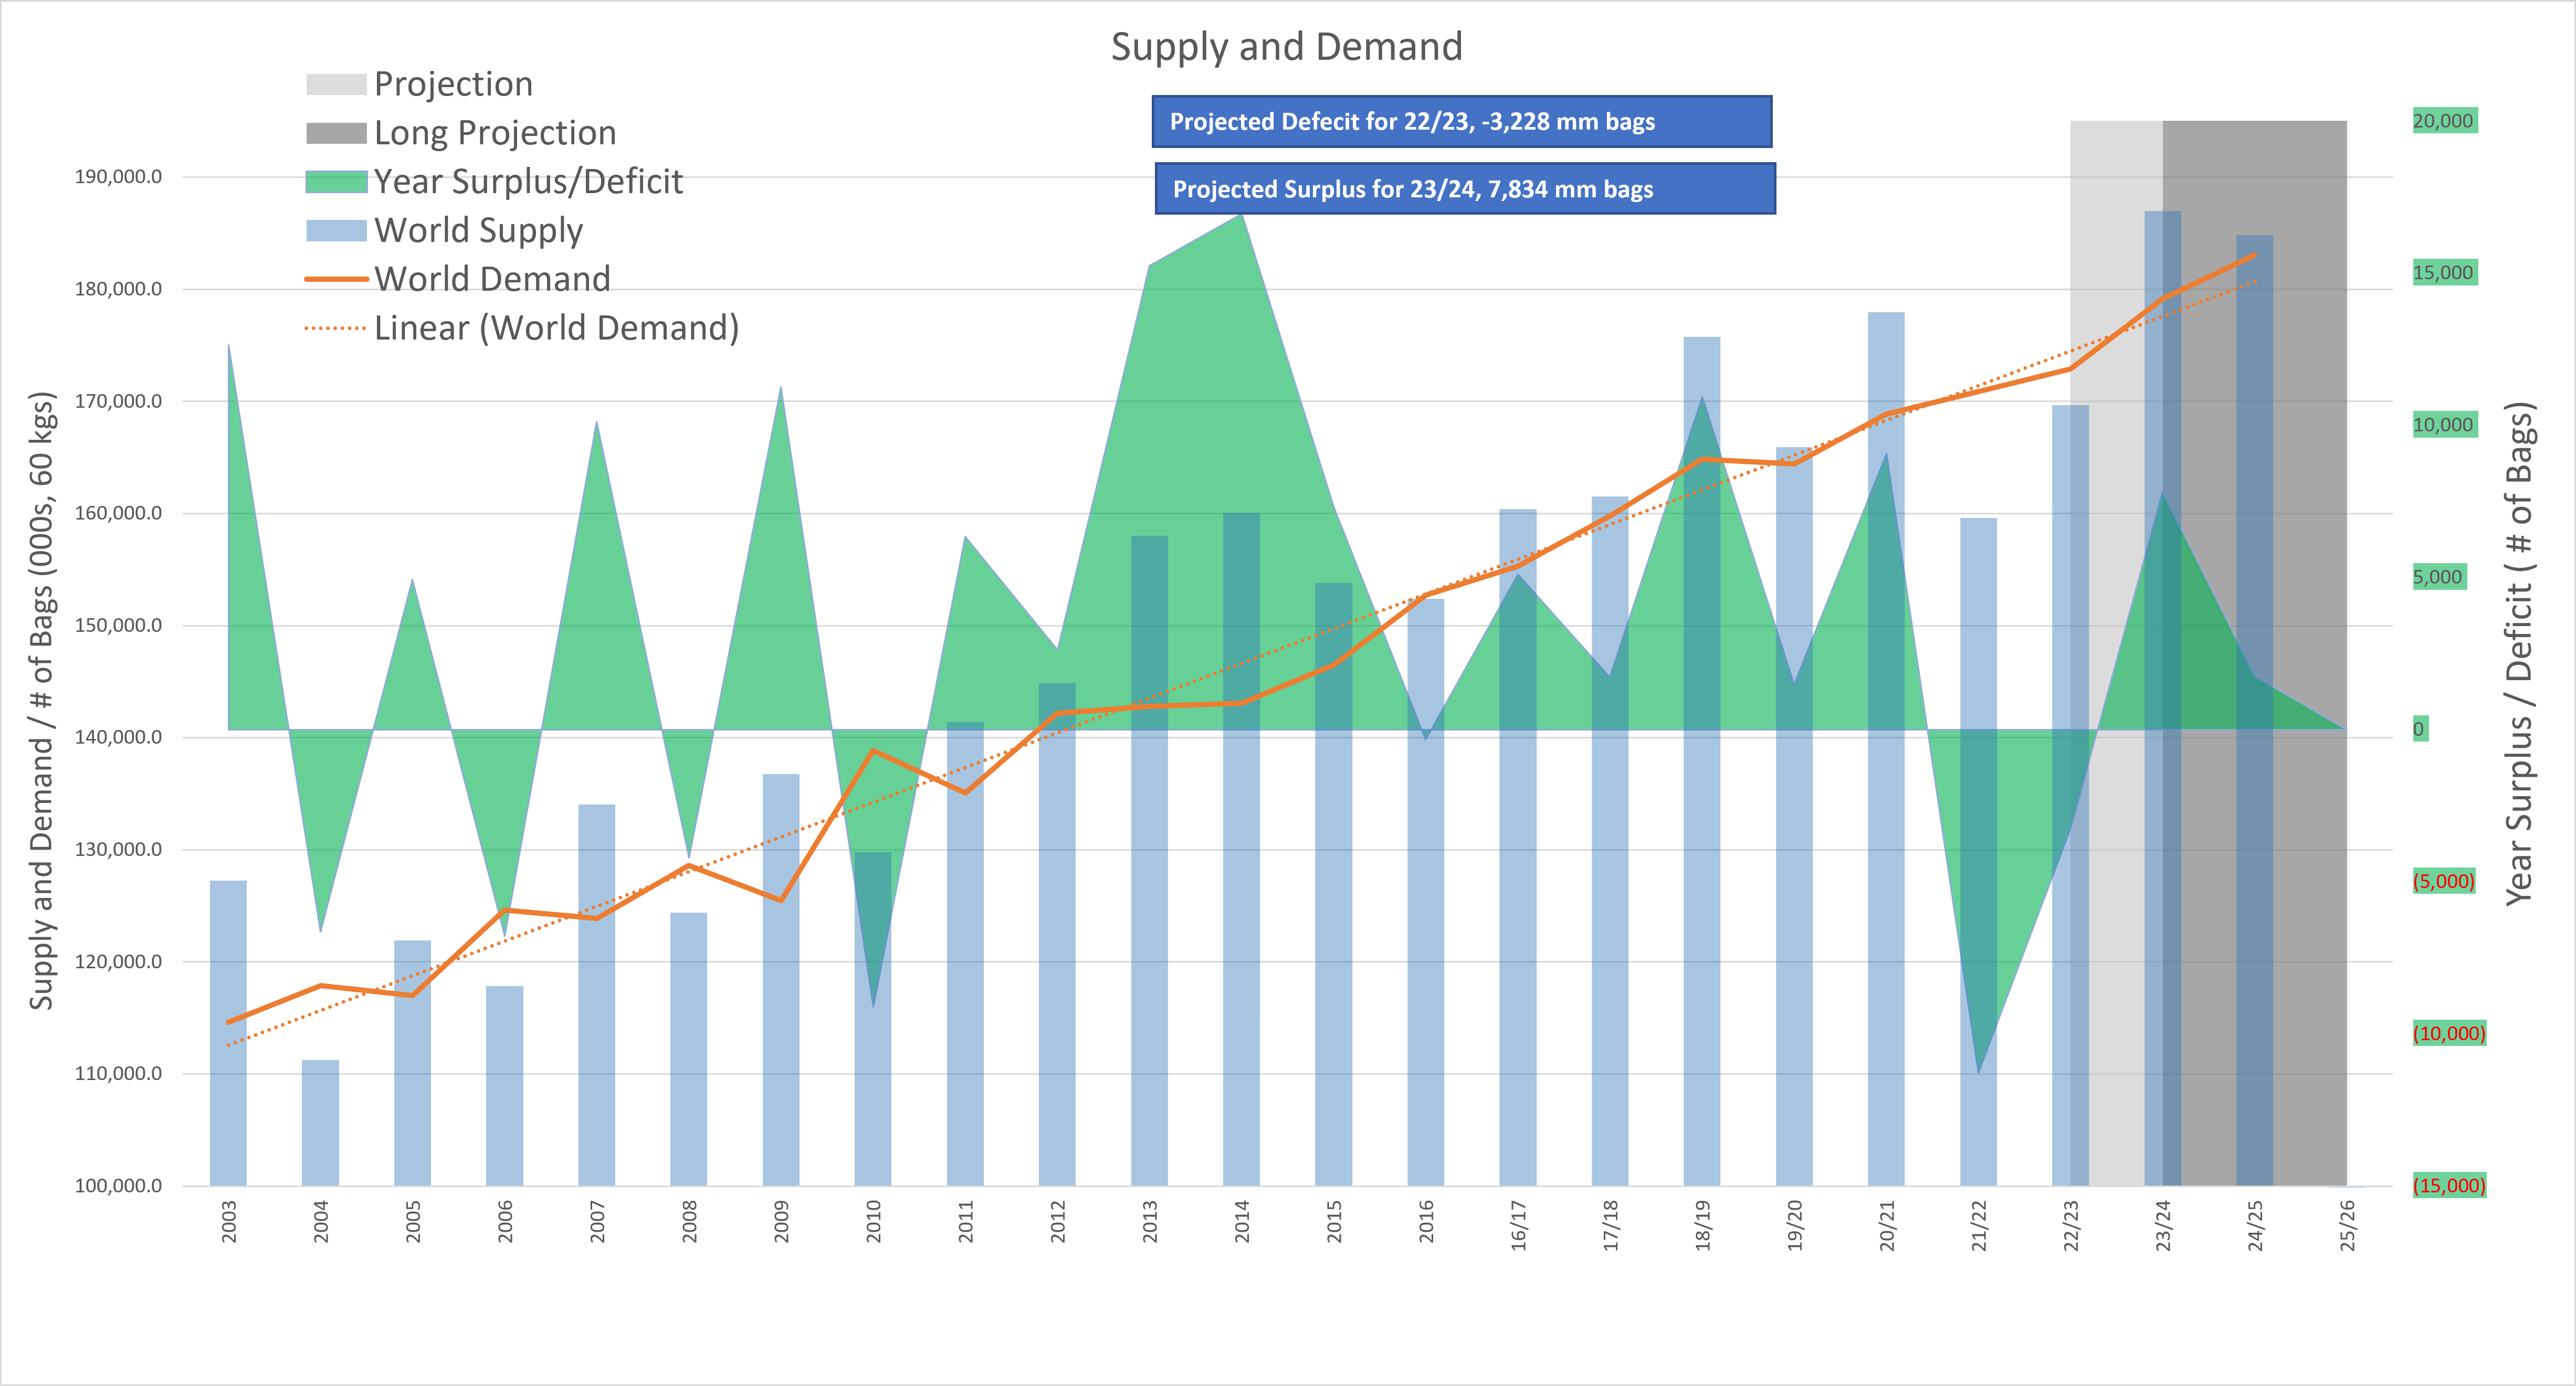
Supply and Demand
- 23/24 looks to be a decent surplus year and possibly 24/25.
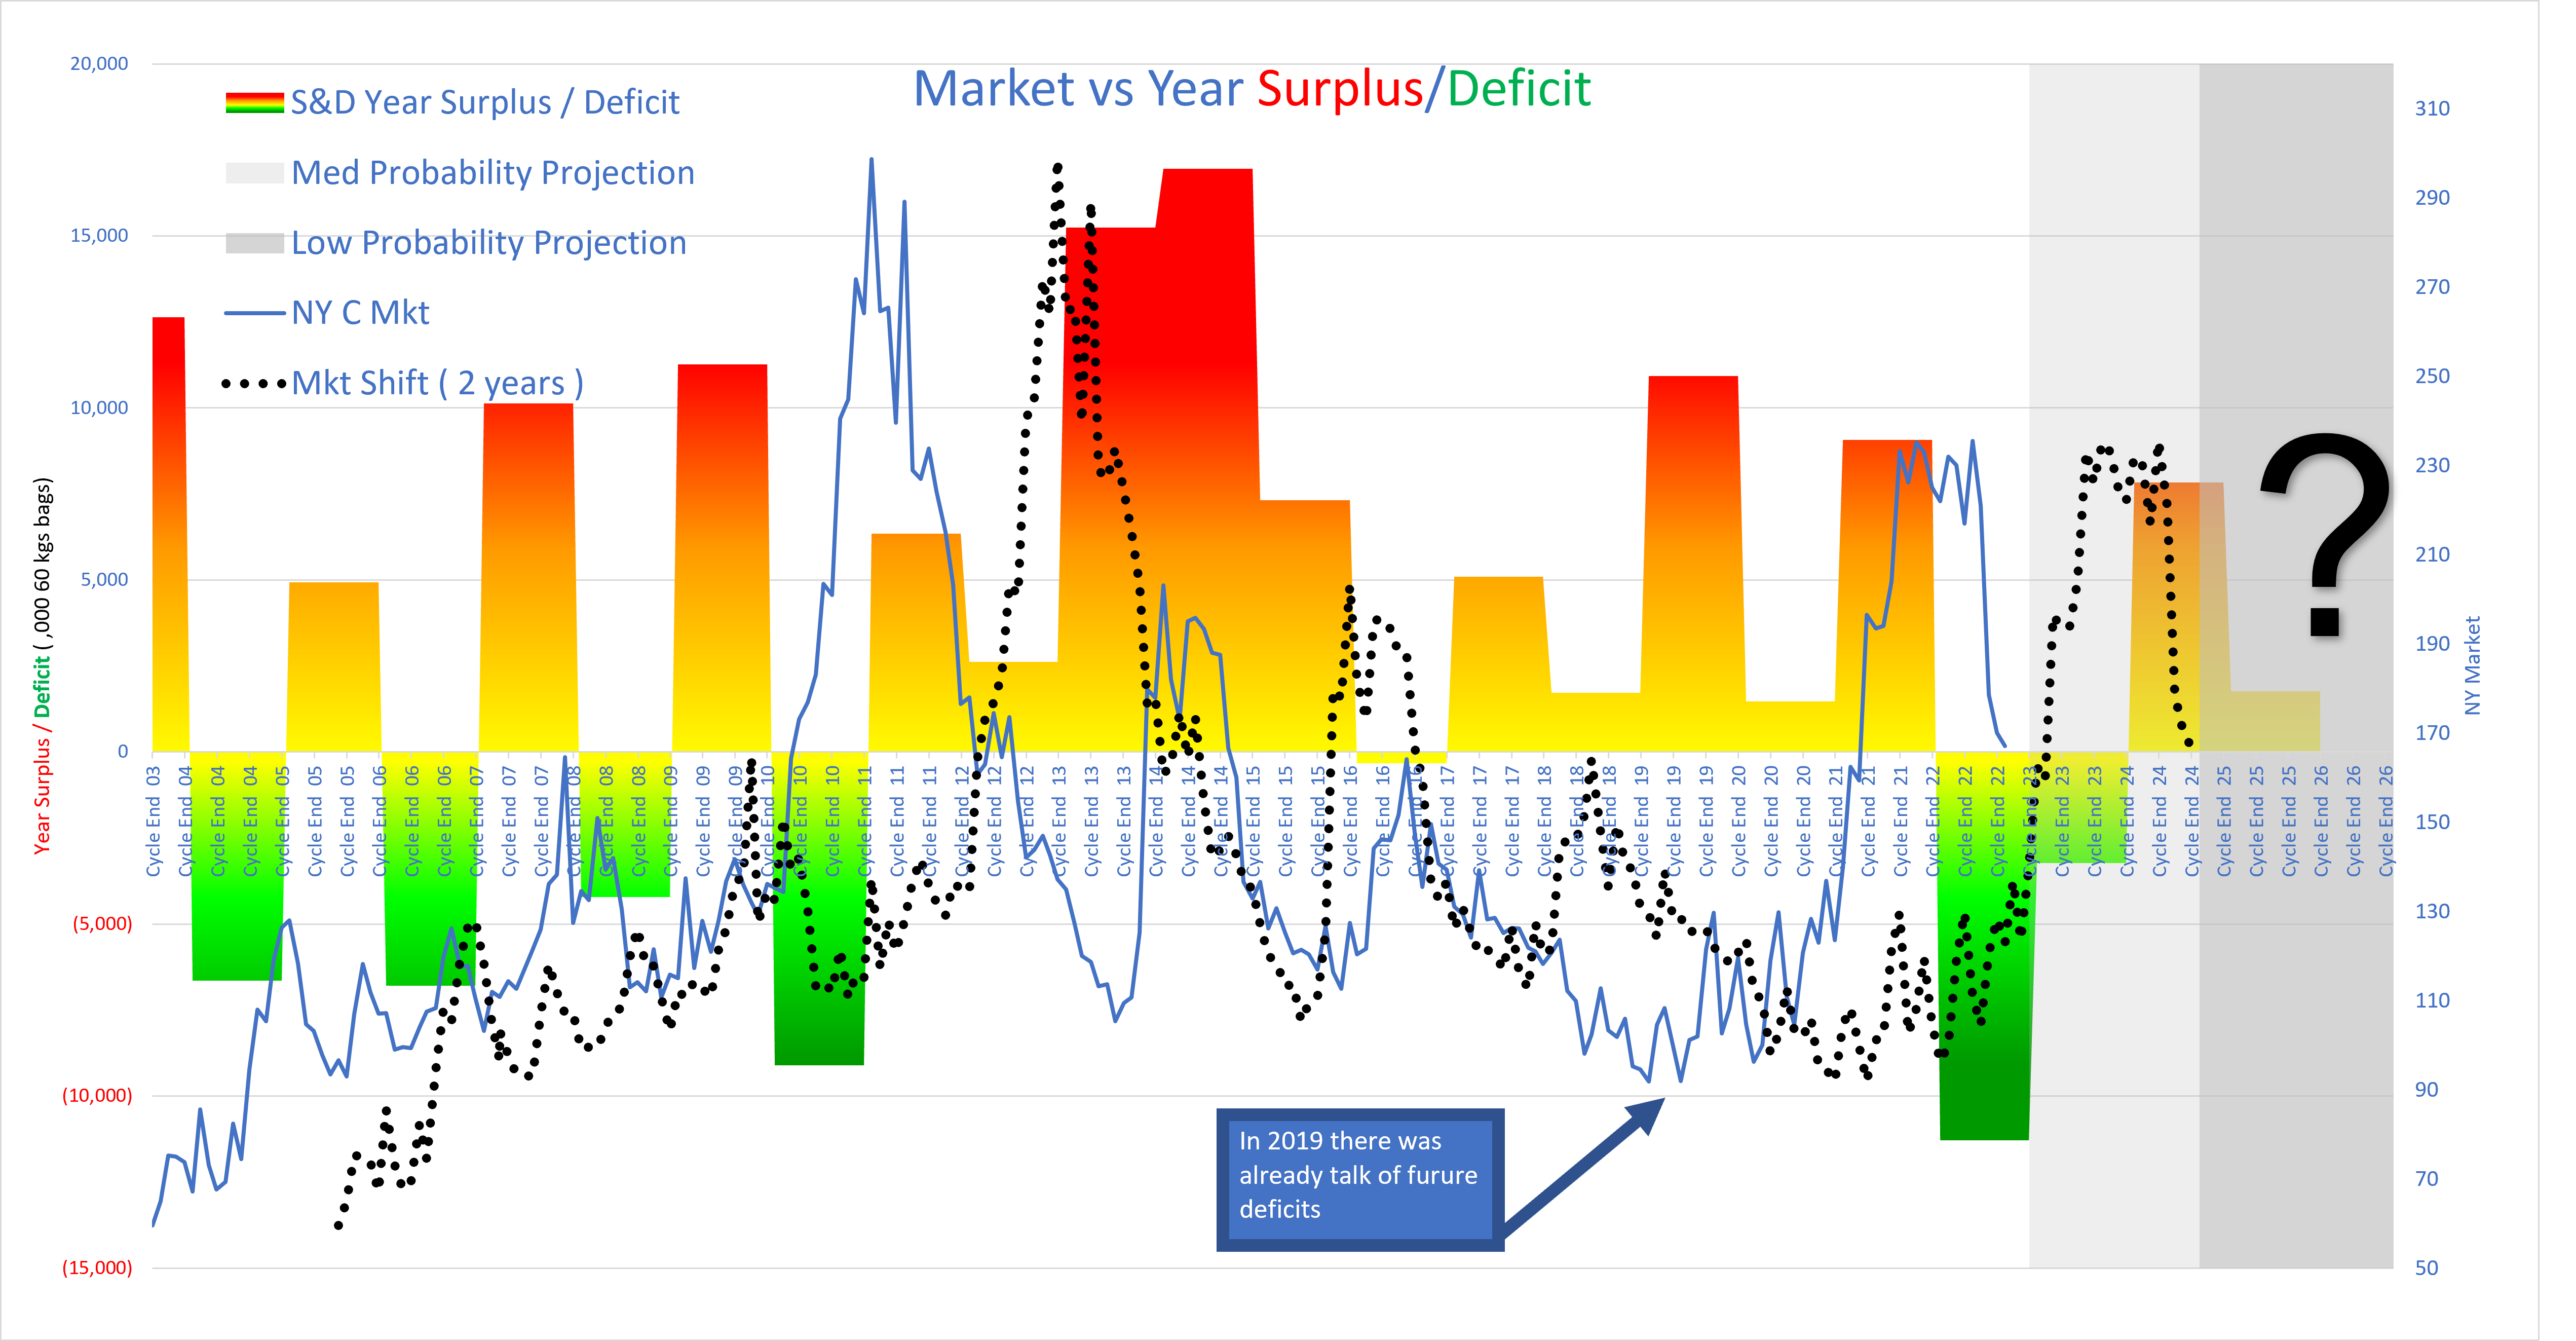
Market
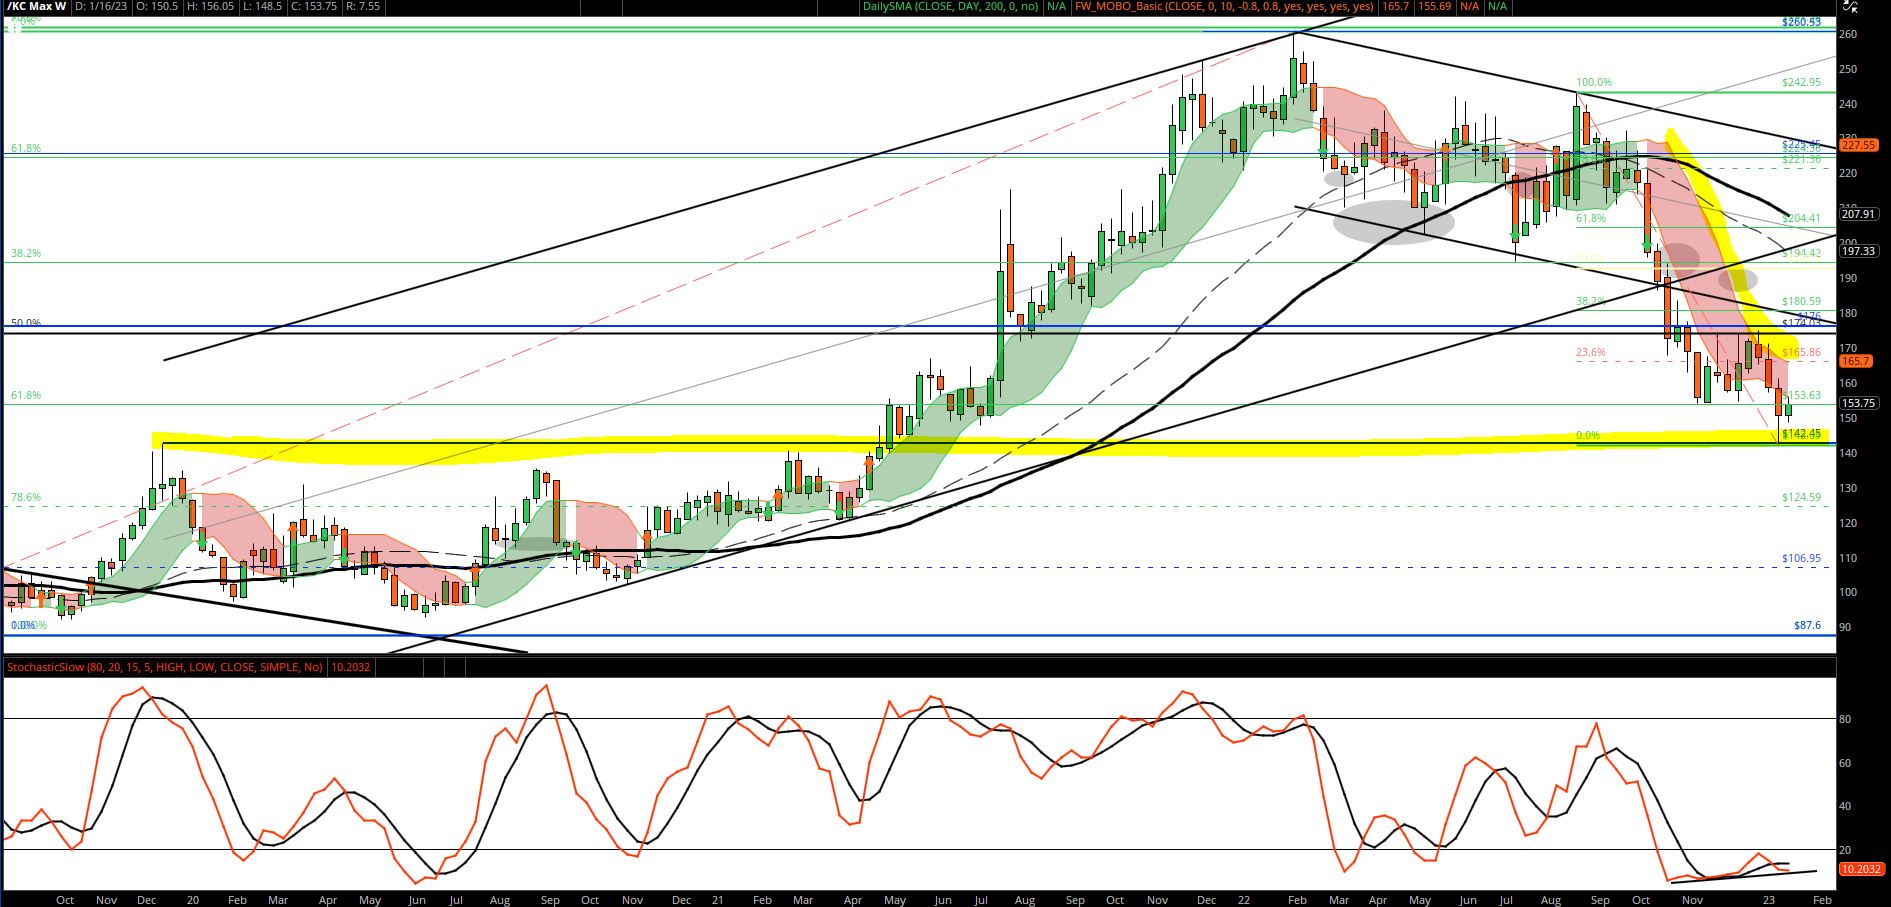
- The daily graph shows the matching legs down in yellow.
- The weekly graph shows the historical support around 142.50.
- Both have other bullish technicals such as bullish slow stochastic buy signals.
- On the weekly we are under the red shaded area. Market ought to test that upper band around 165. A break of that will not necessarily be bullish, but ought to open up 181.

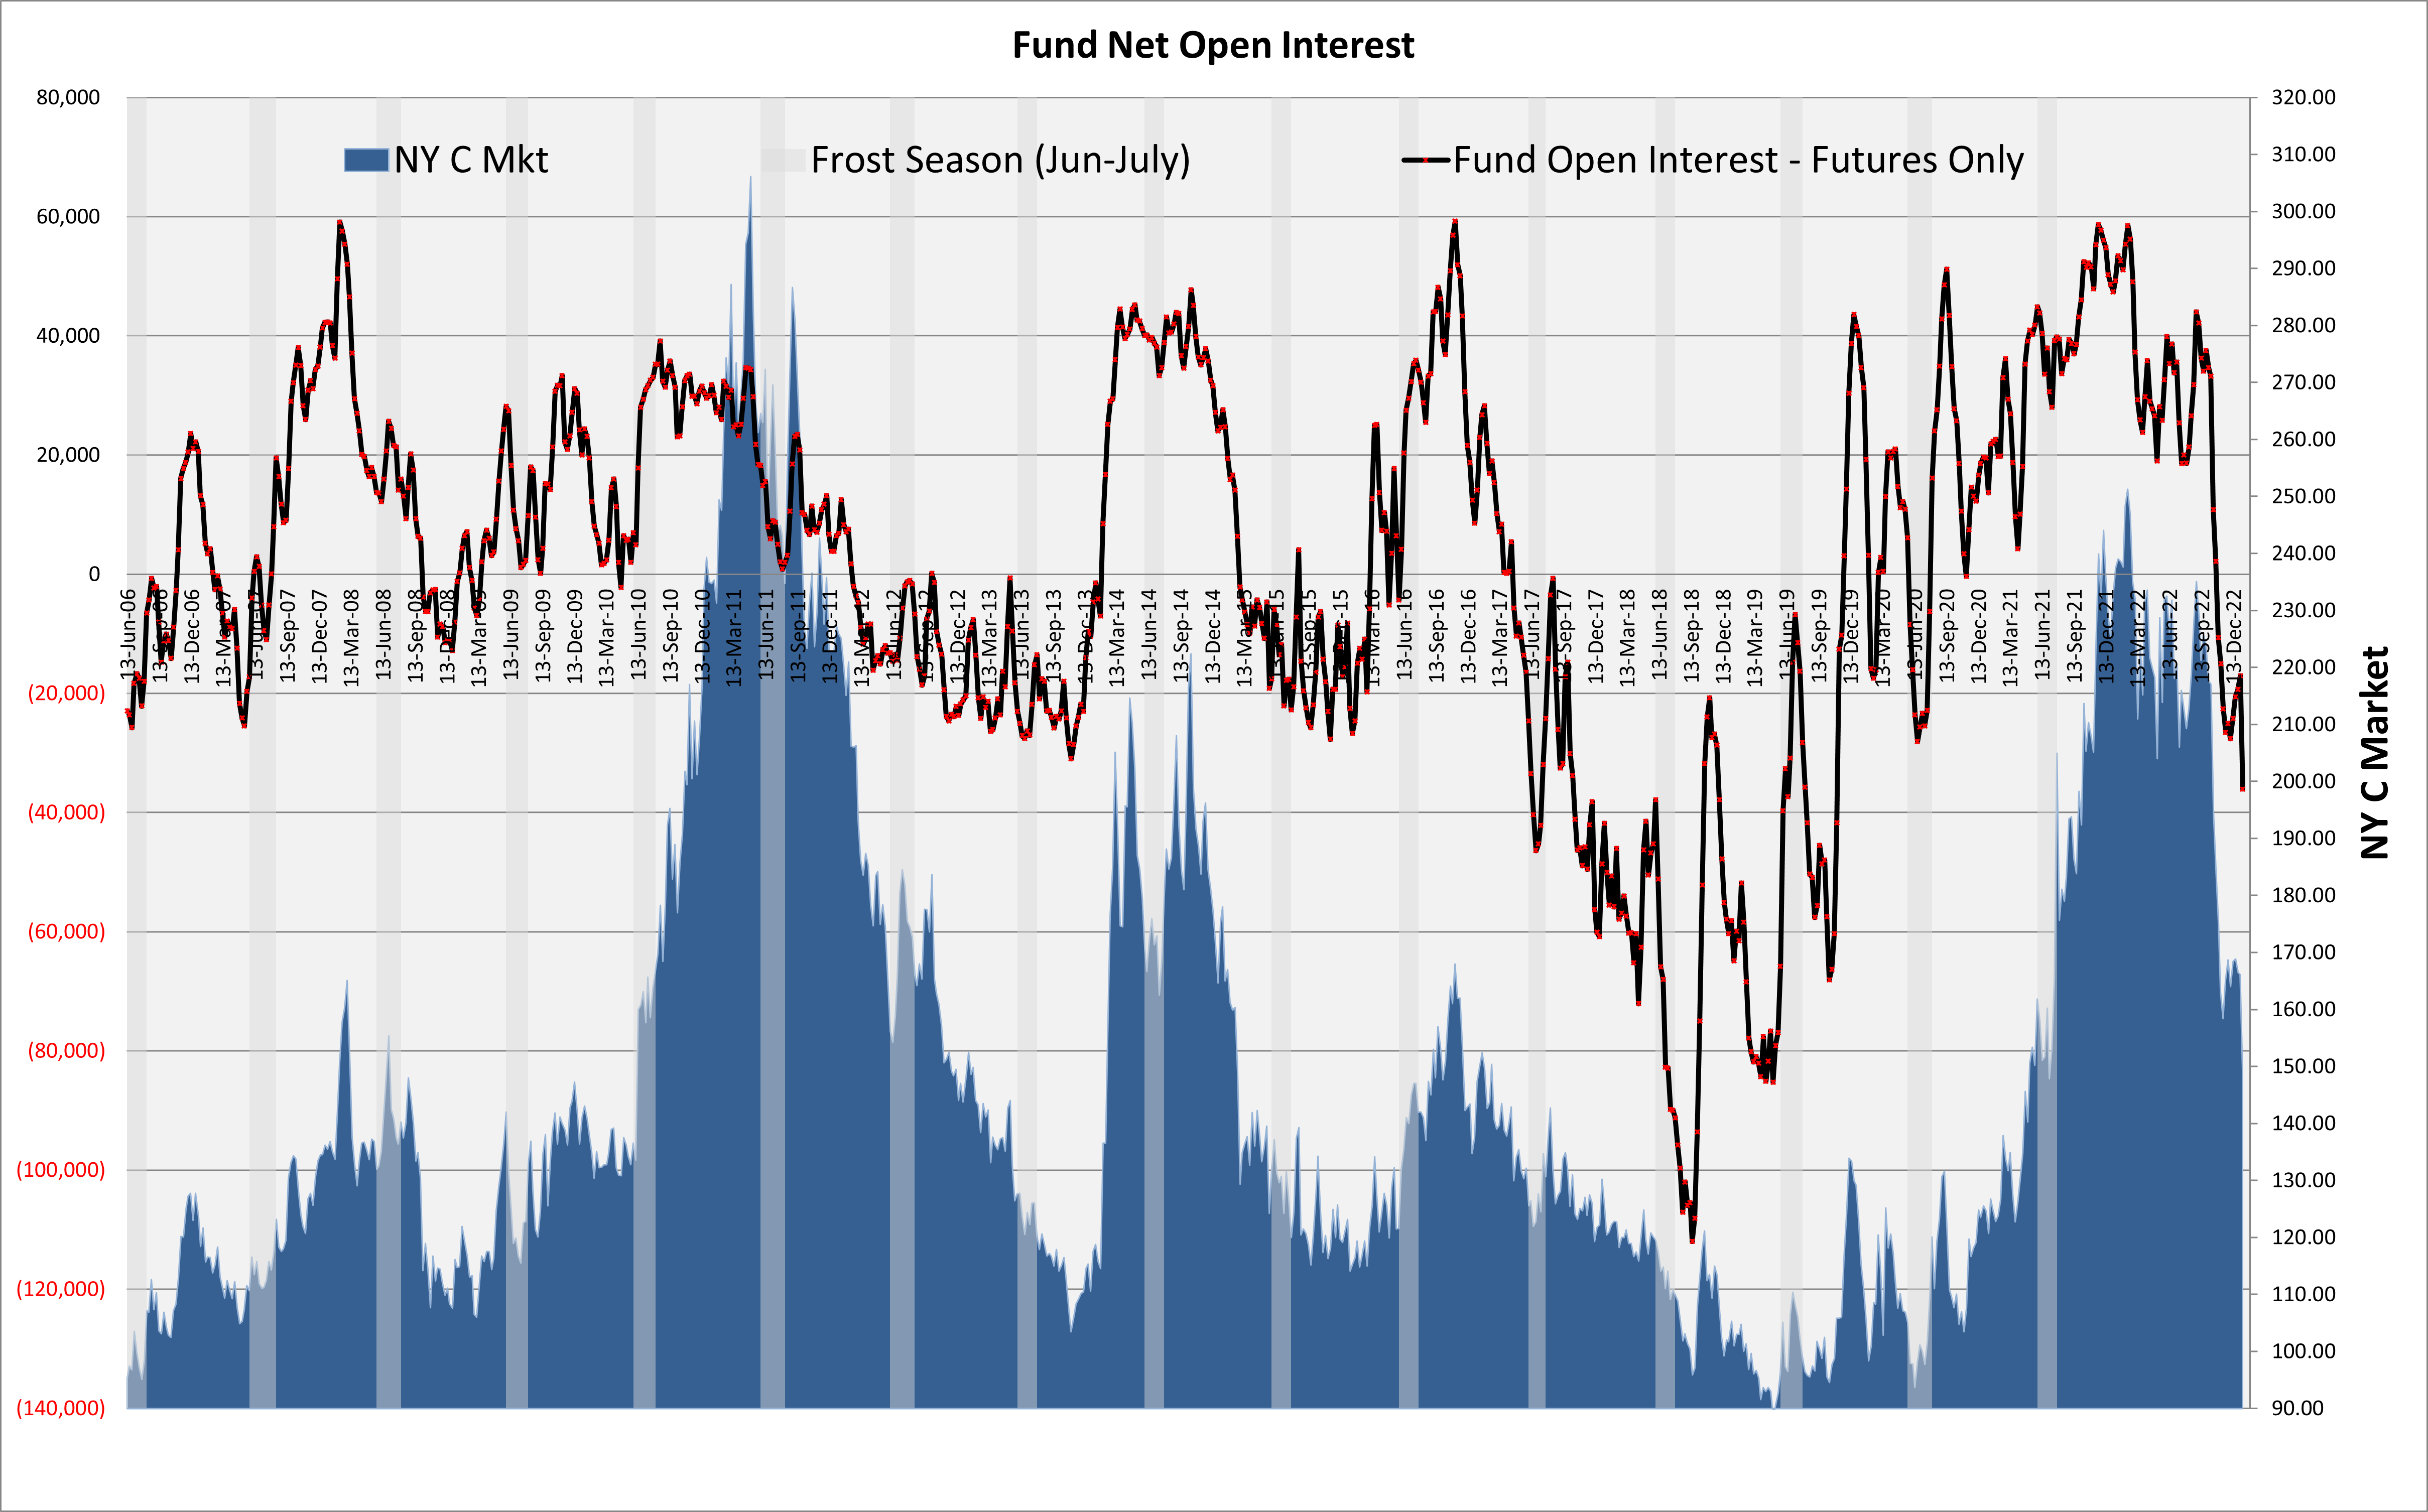
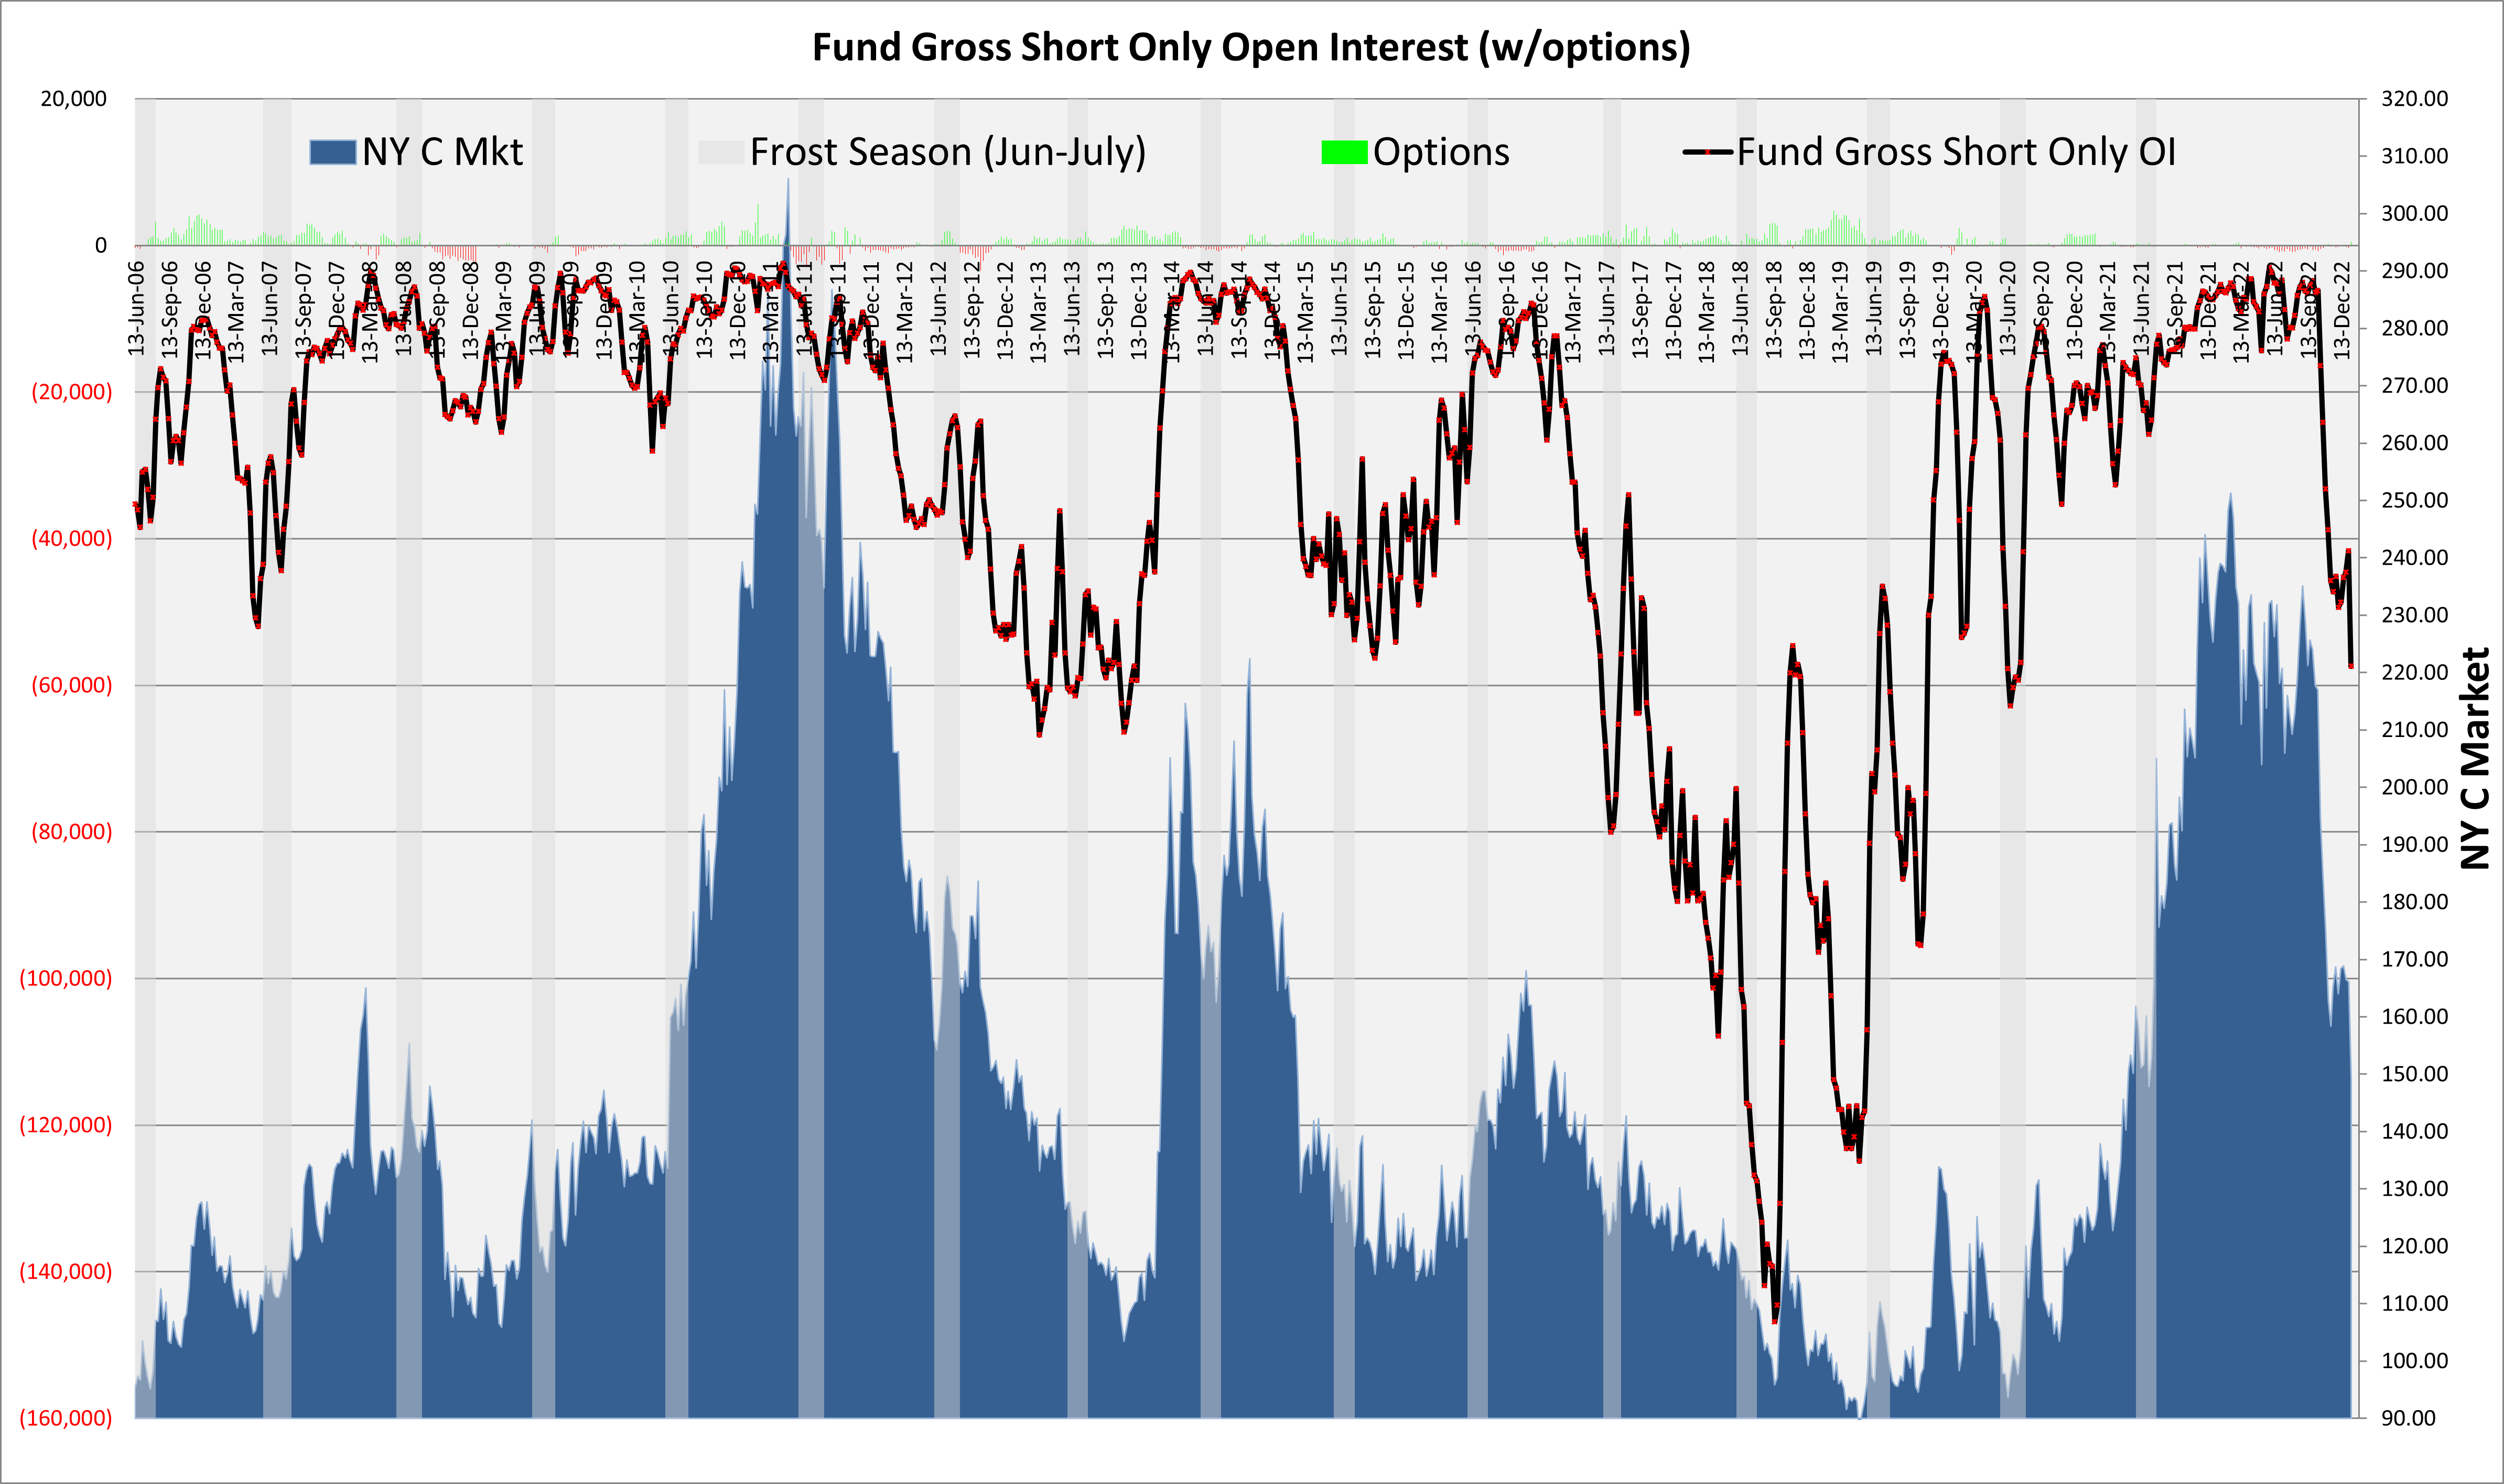
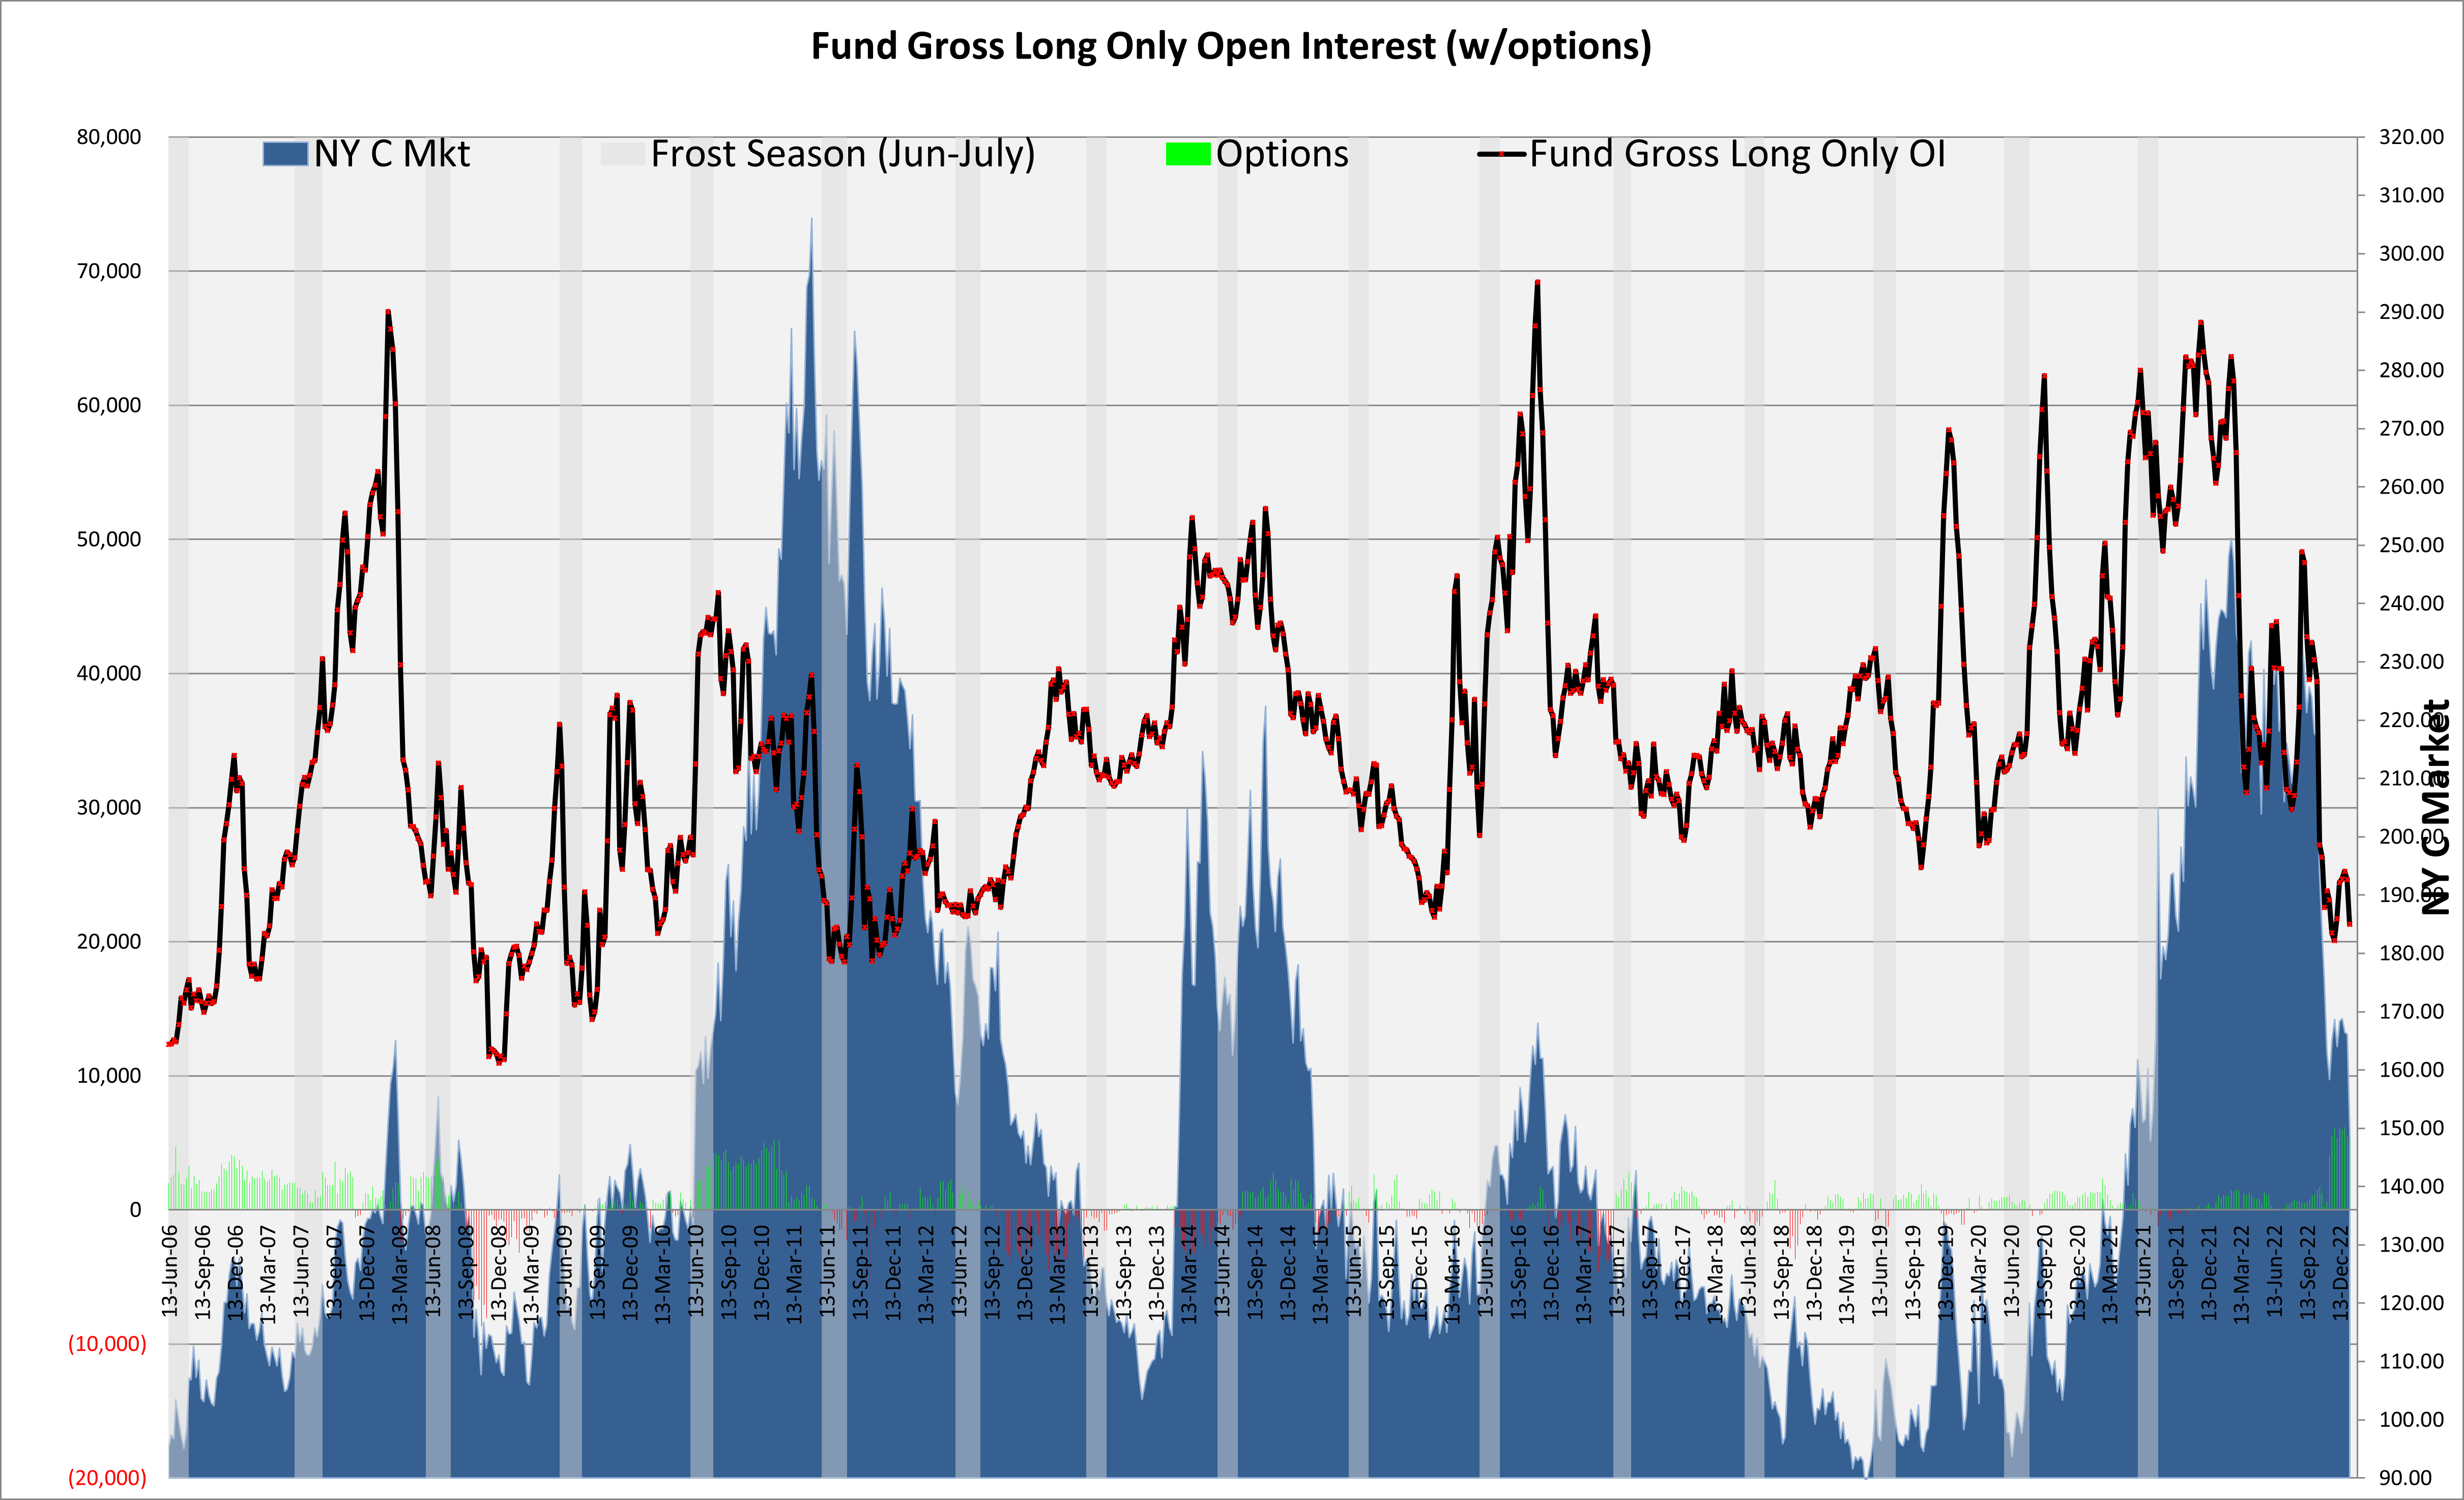
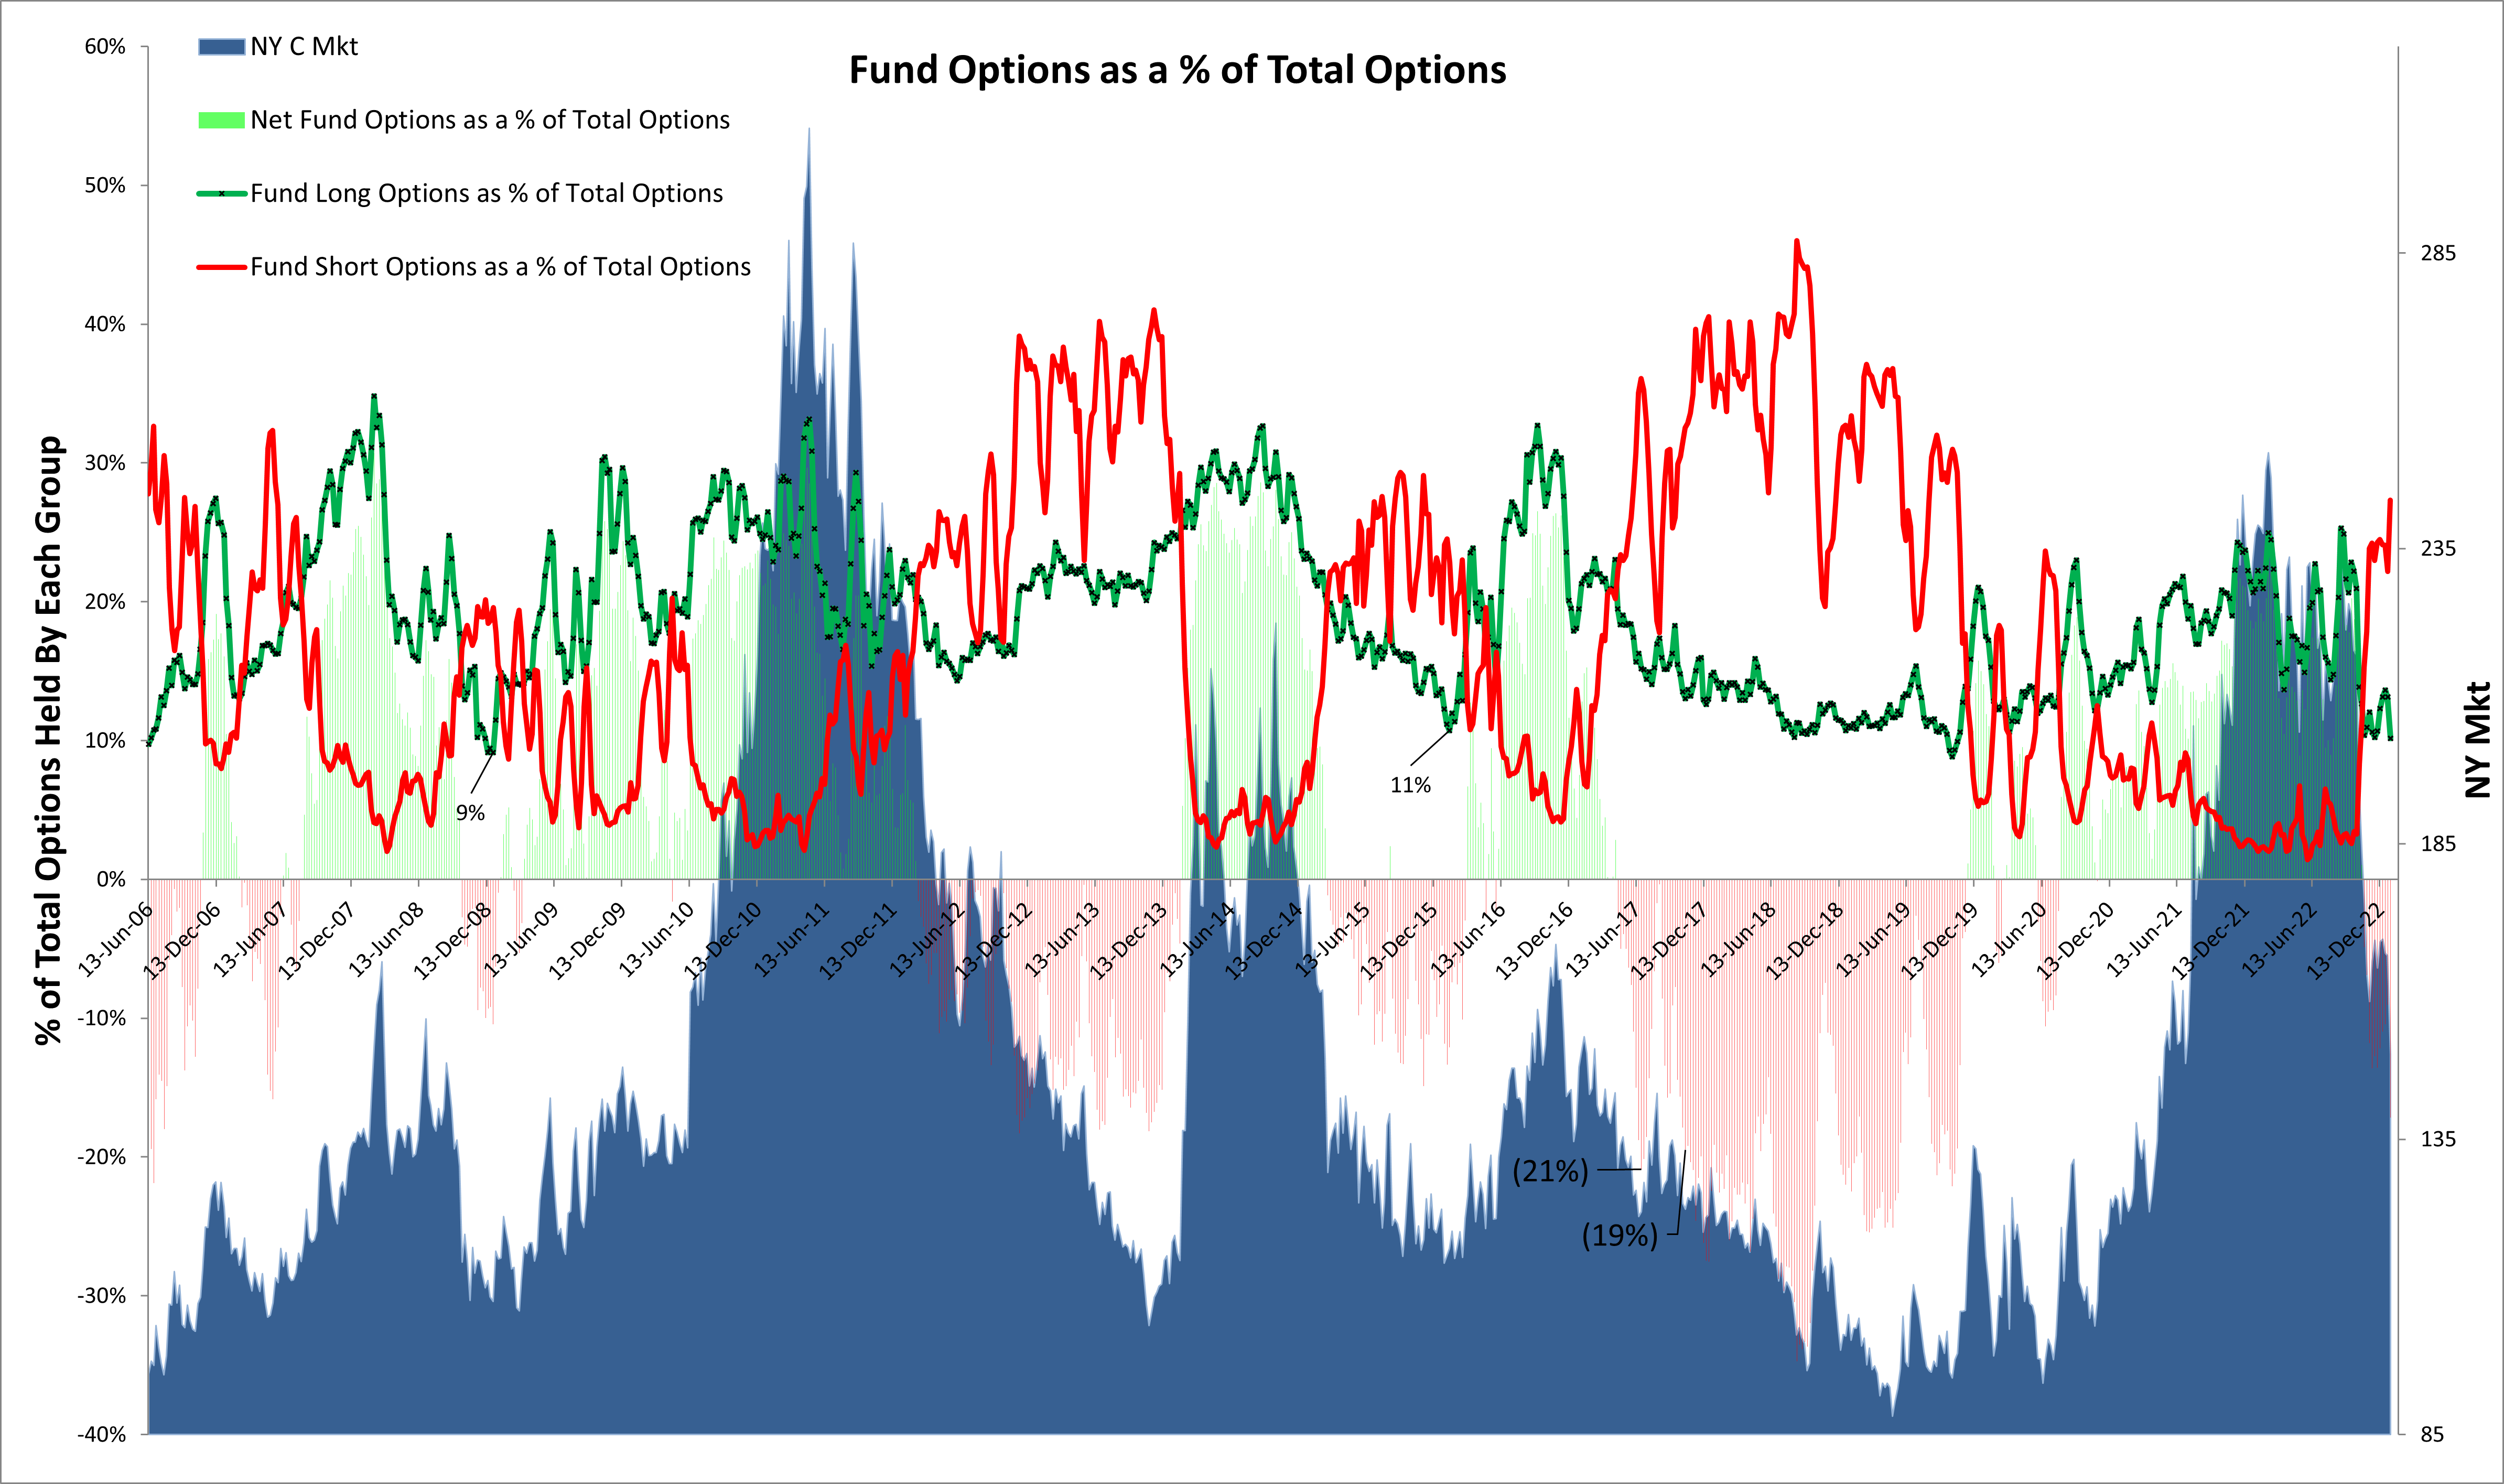
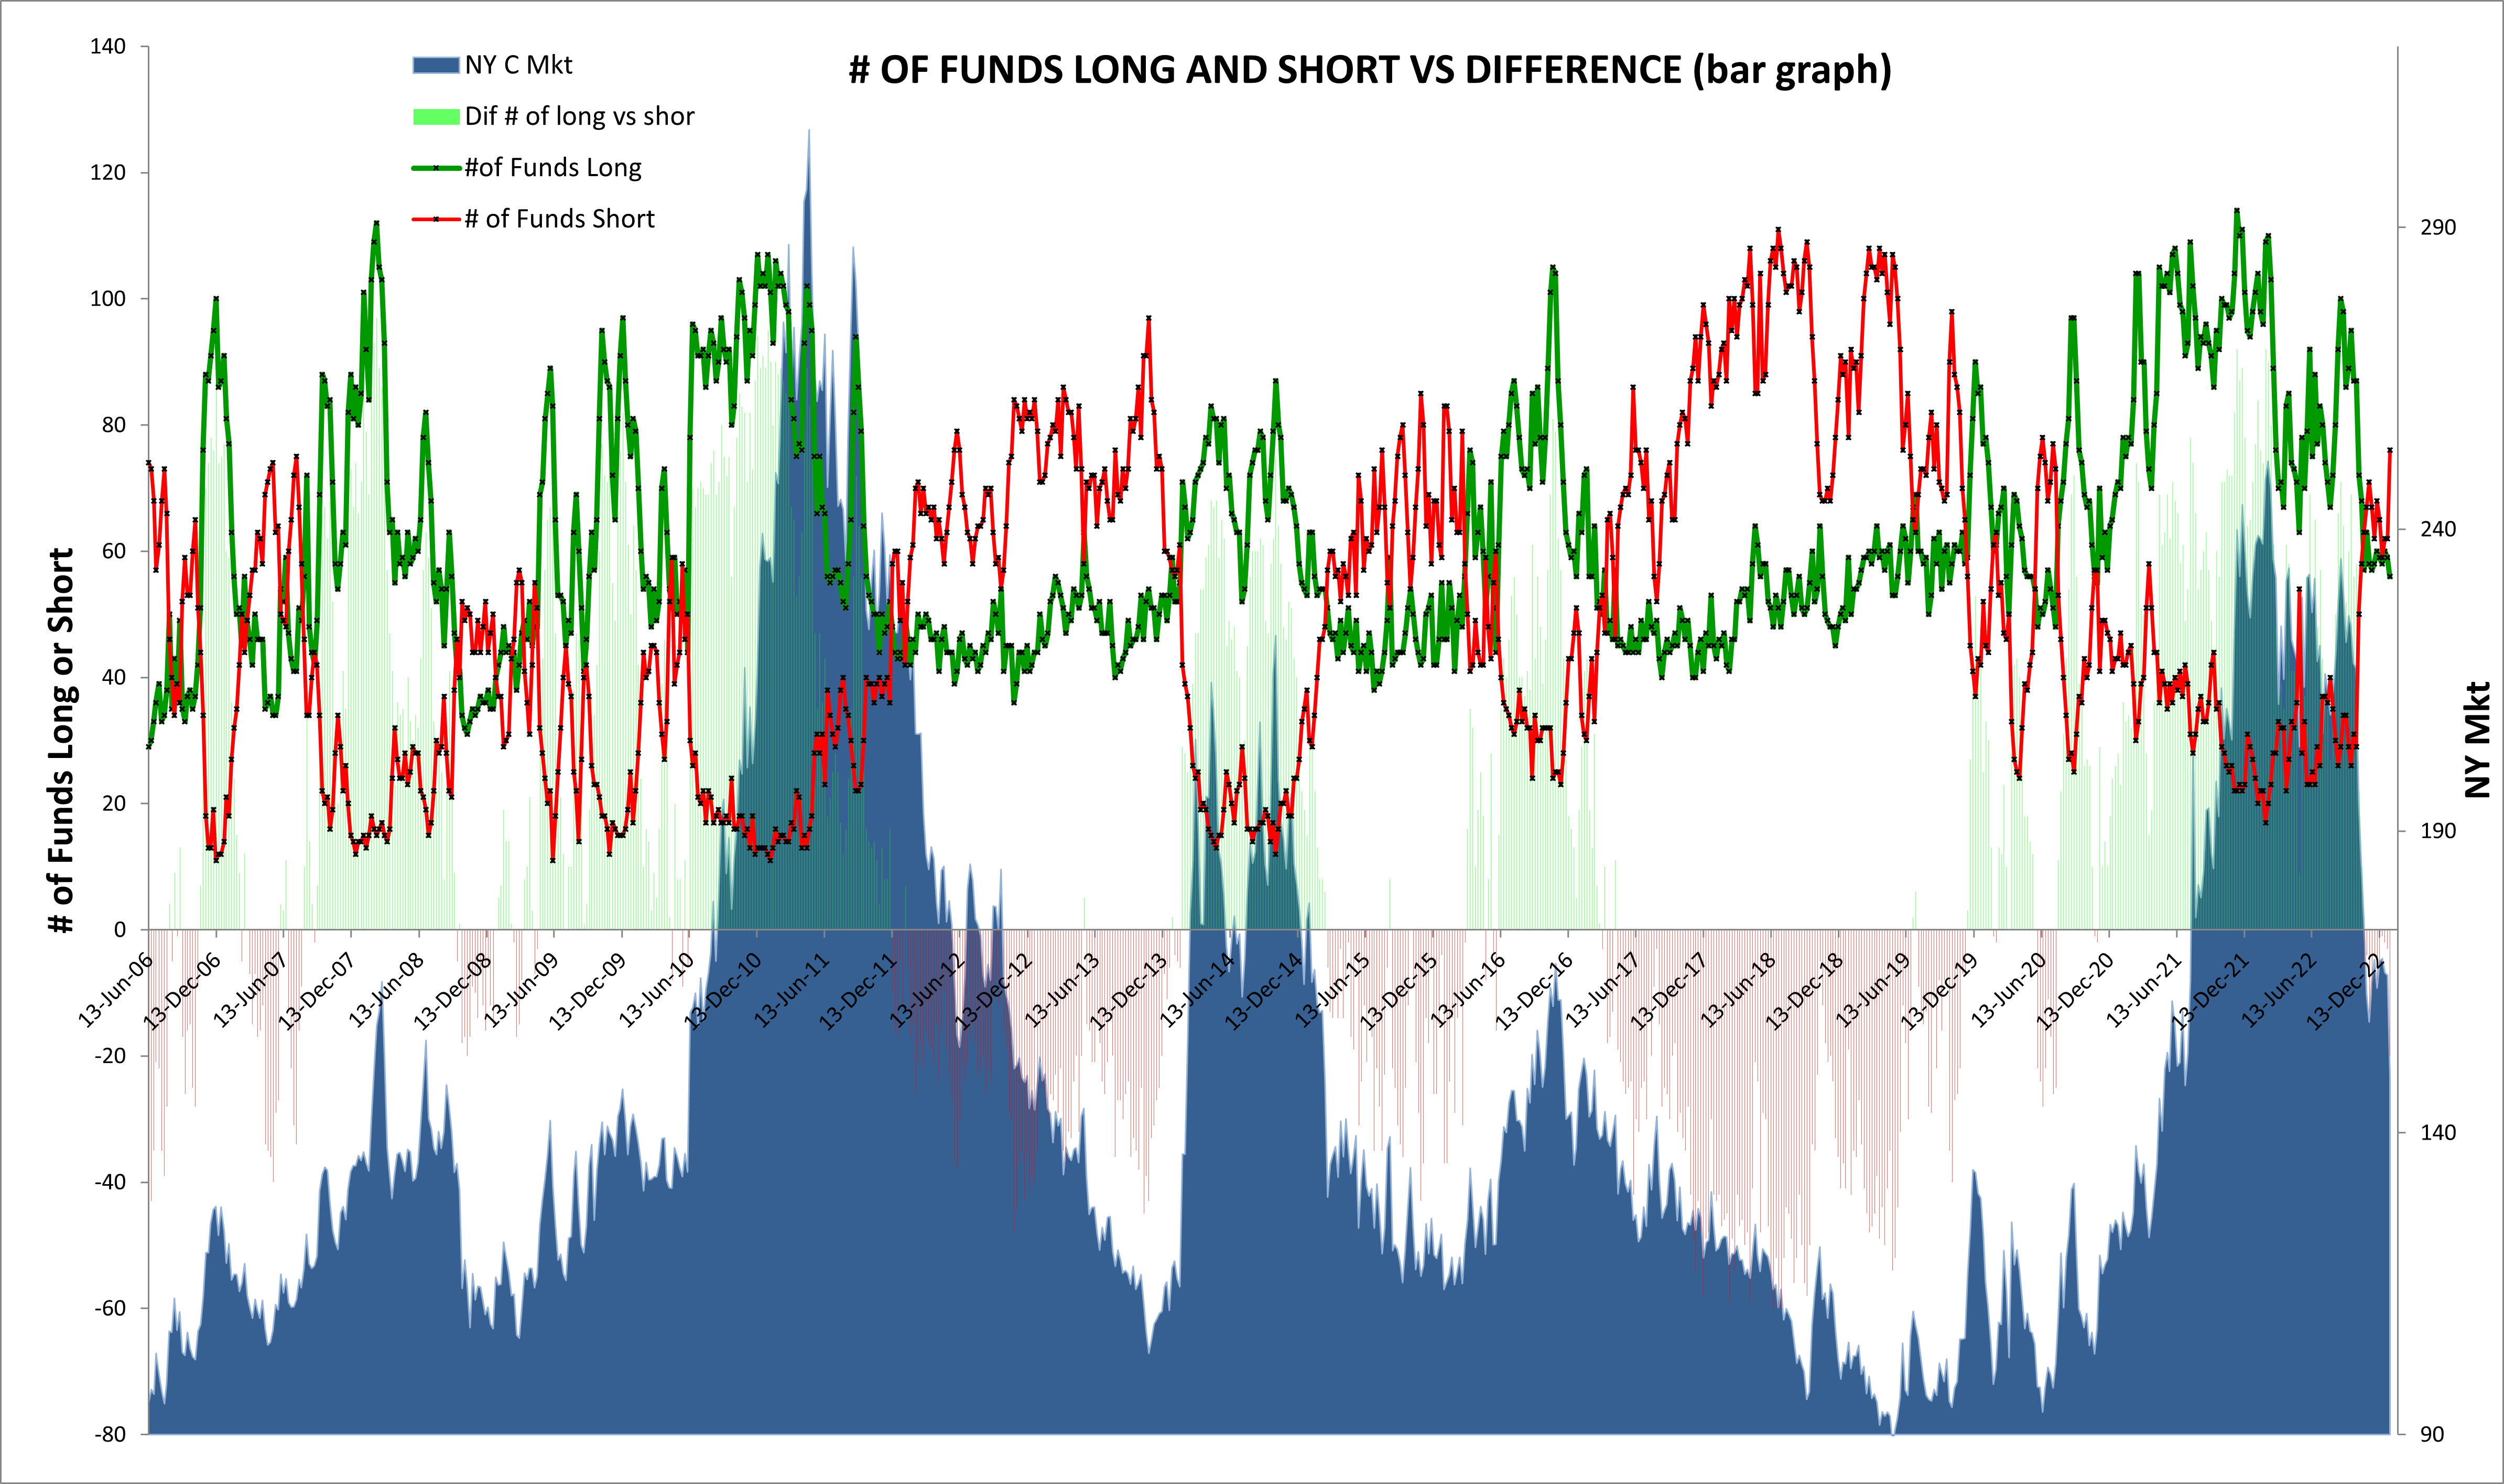
COT Open Interest
- Funds are very short and there are a large number of new funds that have gotten in at lower levels.
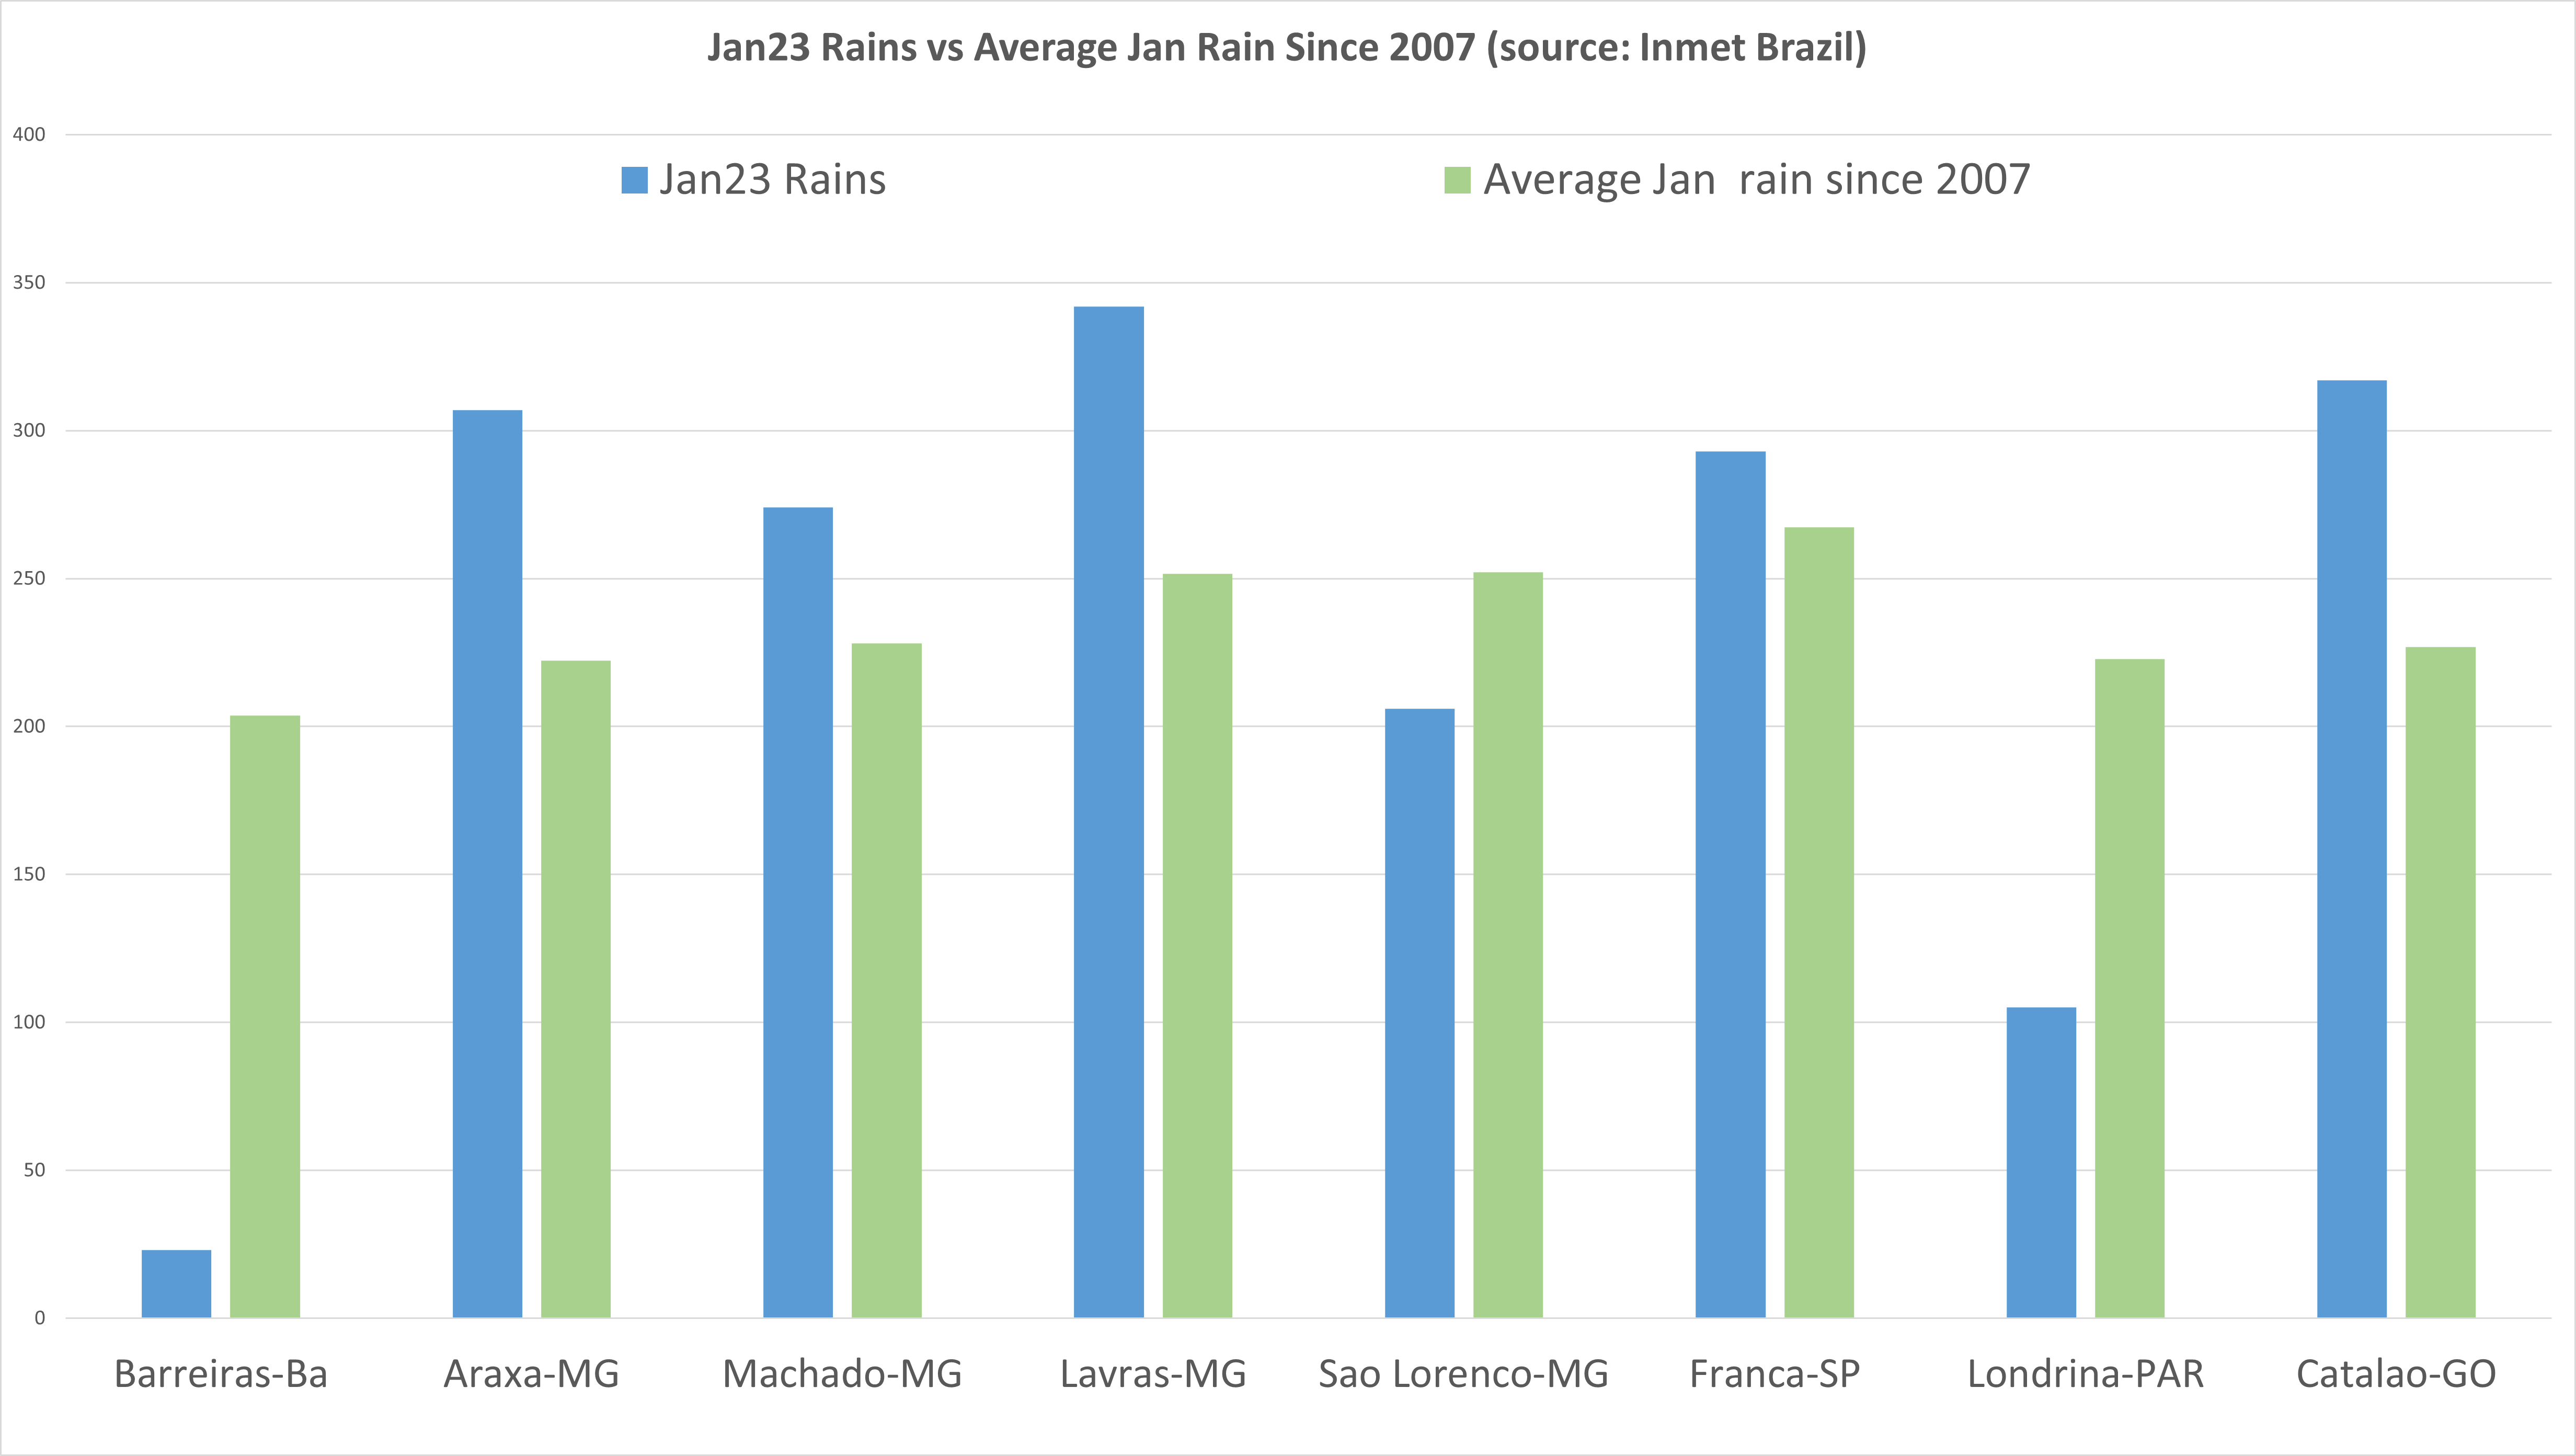
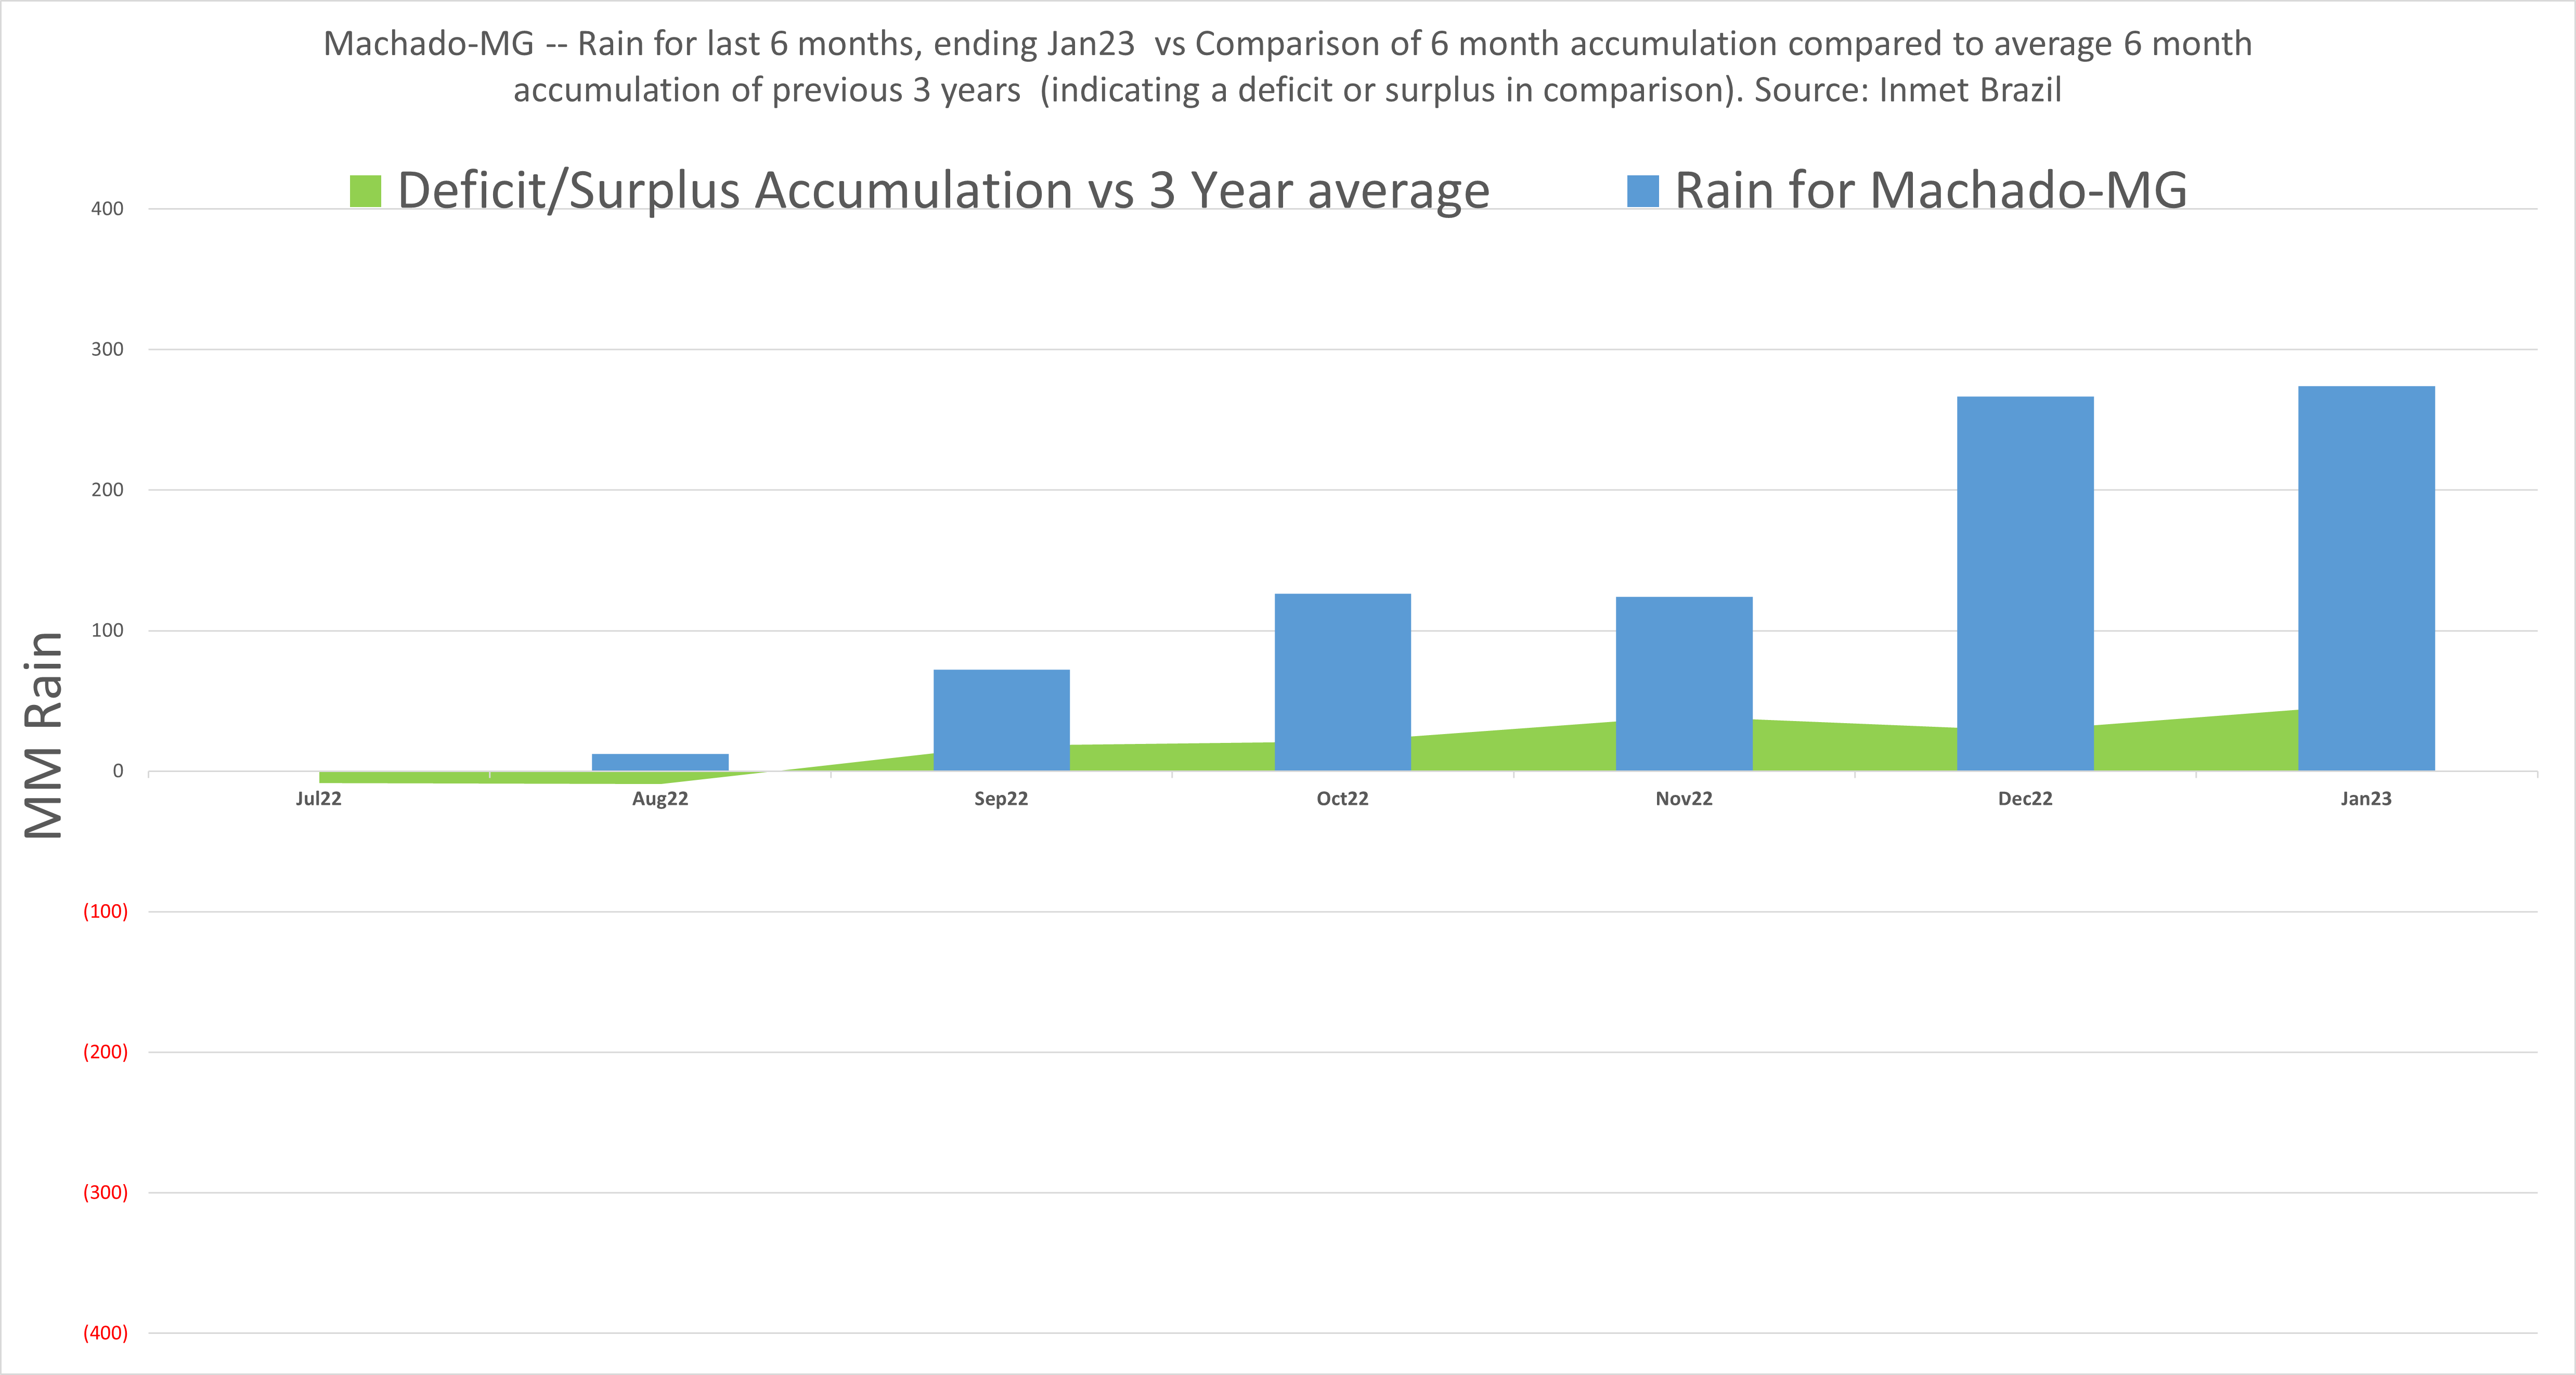
Brazil Rains
- Rains look fantastic.
- First graph is January rains that, at mid month, are on track to exceed average monthly rain fall in most areas.
- 2nd graph is emblematic of most areas that have seen an positive accumulation of moisture over last 6 months.